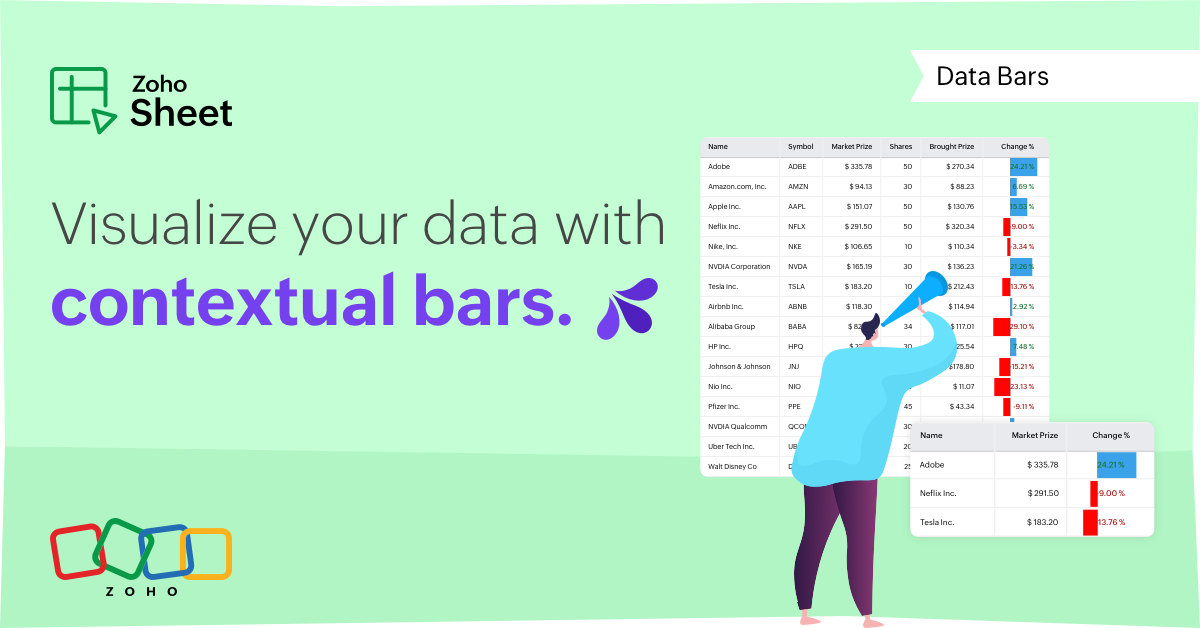
Introducing Data Bars: Graphically represent changes in data within the cells
Conditional formatting has helped millions of spreadsheet users analyze and highlight their data more efficiently. In addition to the classic rules, color scales, and icon sets available in Zoho Sheet, you can now apply Data Bars, a convenient method of visually analyzing the values in a cell range.
What are Data Bars?
Data Bars are cell-level bars that can be used to visually represent the position of a value in a given range, with longer bars representing higher values. This helps users summarize data sets at a glance. Let's say you have a monthly sales report and wish to see which months have the highest and lowest sales figures. Find these results in an instant using Data Bars!
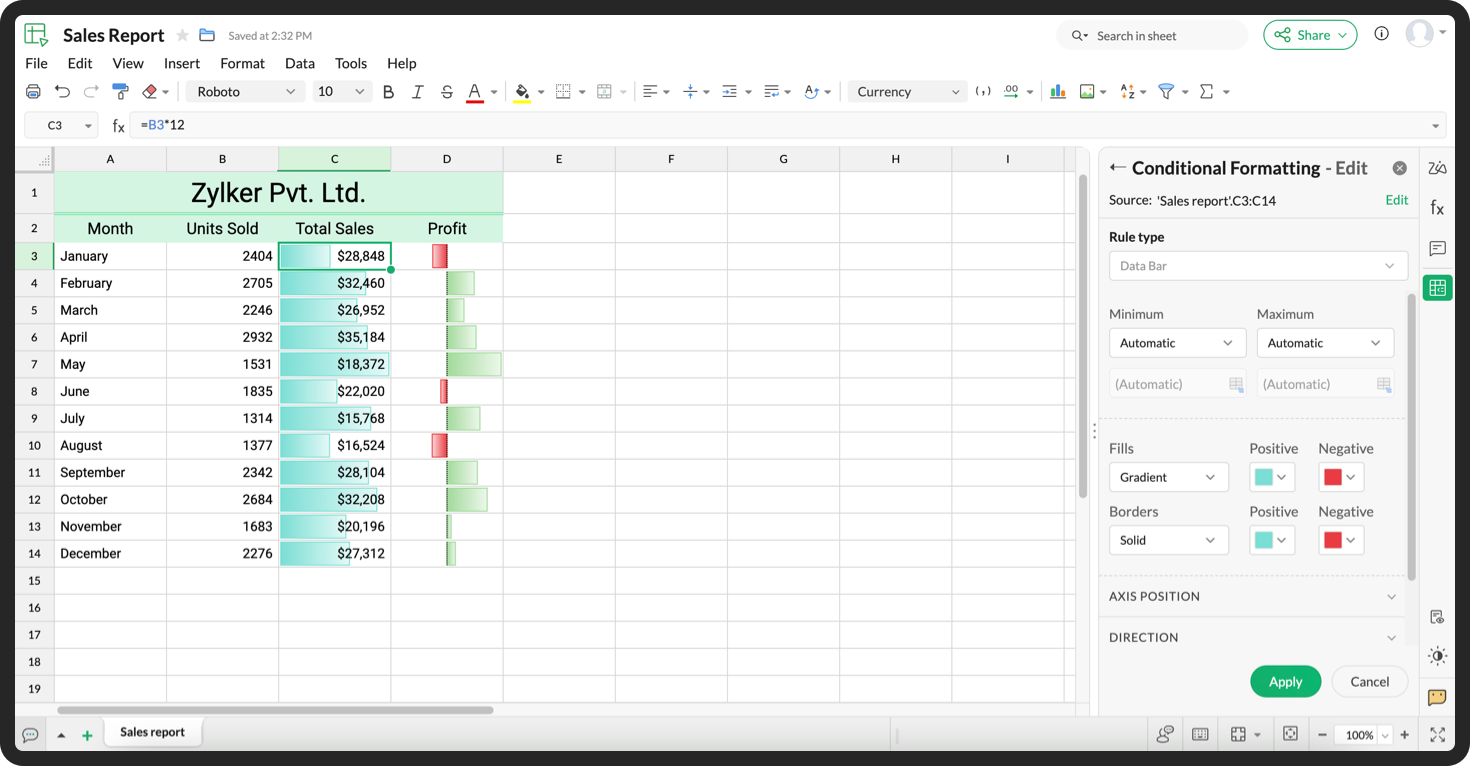
Customizations
Customize your data bars, by adjusting the border, color, and gradient of your bars. You can also choose the direction of the bars and the axis position in the cell, and hide cell content so that only your bars are displayed.
You can also use Data Bars in combination with other conditional formats, like color scales, to analyze your data. Not sure how to get started? Zia now offers suggestions on conditional formatting too!
Read more
Topic Participants
Jaya Shankari S
Aashok Kumar Sharma
Murugalakshmi S
Sticky Posts
New Features: Repeat Last Action, Insert Cut/Copied Rows/Columns and Hyperlink
You might have noticed the constant updates to Zoho Sheet of late. Here are 3 more features that have been added to Zoho Sheet recently: F4 - Repeat Last Action Insert Cut/Copied Rows and Columns Insert Hyperlink Here is a screen cast demonstrating each of these features. Read further below to learn more about these new features. F4 - Repeat Last Action: You can now repeat the last action you made on your spreadsheet by using the keyboard shortcut, F4. It is quite handy and helps you get your workWhat's new in Zoho Sheet: Simplify data entry and collaboration
Hello, Zoho Sheet community! Last year, our team was focused on research and development so we could deliver updates that enhance your spreadsheet experience. This year, we’re excited to deliver those enhancements—but we'll be rolling them out incrementallyIntroducing Forms in Zoho Sheet
We hereby bring you the power of forms in Zoho Sheet. Now, build and create your own customized forms using Zoho Sheet. Be it compiling a questionnaire or rolling out a survey, Zoho Sheet can do it all for you. Forms is an excellent feature that helps you collect information in the simplest of ways and having it in Zoho Sheet takes it a notch higher. Build Simple yet Powerful forms Building forms using Zoho Sheet is fairly simple. The exclusive 'Form' tab lets you create one quickly. Whether youSlicers are now available in Zoho Sheet—filter your data interactively
At Zoho Sheet, we diligently track user requests and feedback. In line with this, based on extensive user requests, we've integrated Slicers to pivot tables and are delighted to announce its release. Slicers are interactive visual filters that have add,Introducing Data Bars: Graphically represent changes in data within the cells
Conditional formatting has helped millions of spreadsheet users analyze and highlight their data more efficiently. In addition to the classic rules, color scales, and icon sets available in Zoho Sheet, you can now apply Data Bars, a convenient method
Recent Topics
SOME FEATURES ARE NOT IN THE ZOHO SHEET IN COMPARISION TO ZOHO SHEET
TO ZOHO sir/maam with due to respect i want to say that i am using ZOHO tool which is spreadsheet i want to say that some features are not there in zoho sheet as comparison to MS EXCEL like advance filter and other Features which should be there in ZOHOZoho sheet for desktop
Hi is zoho sheets available for desktop version for windowsTip #18: 6 Trendlines and when to use them in your spreadsheet data?
Charts are a great tool for visualizing and interpreting large chunks of data in spreadsheets. Zoho Sheet offers you 35+ chart options, along with AI-powered chart recommendations based on the data set you select. There are various chart elements thatPerform customized calculations with the new LAMBDA functions!
We released the LAMBDA function in Zoho Sheet in 2021, enabling customized calculations inside predefined functions. Now, we're extending LAMBDA's capabilities with six new functions. Each of these functions applies LAMBDA to the given input, performsTip #17: Easily share spreadsheets with non-Zoho account users
With efficient, collaboration-friendly options, Zoho Sheet is a popular choice among users. Sheet's external share links help you collaborate more effectively by sharing your spreadsheets with anyone outside your organization, including users who do notWork seamlessly with Sheet's shortcuts without affecting the browser
Navigating your worksheets and performing specific actions should be a quick and easy process. That's where keyboard shortcuts come in. Shortcut keys help you accomplish tasks more efficiently, eliminating the need to move away from the keyboard. WhatZoho Sheet for iPad: Improved UI, external keyboard support, and more!
The portability and capabilities of the iPad have made it an essential device in the business world. With this in mind, we had launched an exclusive Zoho Sheet app for iPad, with device-specific improvements and enhanced usability. Now, we're improvingThe new Zoho Sheet for Android: Seamless UI and advanced features
At Zoho Sheet, we know mobile apps have become the go-to platforms for creating, sharing, and storing information. And we understand the importance of an efficient and seamless app experience. We've been working hard on improving the overall user experienceZia in Zoho Sheet now makes suggestions on conditional formats, picklists, and checkboxes
Zia, Zoho's popular AI assistant, has been helping users succeed across Zoho applications since inception. In Zoho Sheet, Zia helps users efficiently build reports and analyze data with recommendations about data cleaning, charts, and pivot table. Also,VBA attached to button no longer works on external shared sheet
Hi - we have a Sheet that our clients use, which requires them to press a button once they've entered data. The button then triggers a flow via a webhook. The button works fine when editing within Zoho Sheet - however when shared externally it no longercan I use zoho sheet for survey?
Hi I wanna use zoho sheet for my ARY to know consumer better so i wanna have permission to do soHow to Avoid Impacting Other Users When Hiding Columns in Zoho Sheet
Hi Team, We’re experiencing a challenge with the column-hiding feature on Zoho Sheet during collaborative sessions. When one user hides a column, it becomes hidden for all users working on the file, which disrupts others' workflows. In comparison, ExcelWhat are the benefits of procurement software in a growing business setup?
I’ve been exploring tools that can help automate purchasing and vendor-related tasks. I keep hearing about the benefits of procurement software, especially for businesses that are scaling. I want to understand how it helps in streamlining operations,What formula to use in computing total hrs and decimal hrss
So , my data includes log im column , 2 breaks with 2 columns that says back and lunch and 1 column that says back and logged out. What formula should i use to be able to automatically have my total hours as I input time in each column? ThankyouReplacing email ID,
In zoho sheets If I am sending it as an email attachments can I replace sender email ID from notifications to my email ID.Latest Enhancements and Bug Fixes in Zoho Meeting
Hello there, We hope you're doing well. The latest updates from Zoho Meeting include enhancements like adding names for instant meetings, renaming participants, enabling text notifications for participant entry/exit, viewing details of bandwidth optimization,Multi-video feed in webinars, custom domain options, and our integration with MS Outlook
Hi there, We hope you're doing well. With your help, we have been able to release many useful features and enhancements in 2020. We, the Zoho Meeting team, would like to thank you all for the feedback, support, and encouragement you've given as we workedAdd co-hosts in meetings, manage webinar registration and other enhancements
Hello all, This month's updates allow you to add co-hosts while scheduling meetings. You can also control your webinar registrations better by allowing or blocking registrations from the domain or country of your choice. Read on to learn more. MeetingA new UI for distraction-free engagement in online meetings and webinars that scale up for 3000 attendees
Hello all, We're excited to share our new, refined UI for online meetings. Here's how the new UI will improve your experience during online meetings: We've re-designed Zoho Meeting's online meeting UI to enable users to fully engage in conversationsI Can't Clone Webinar that I Co-Organize
How do i get our account admin to give me permission to clone our webinars? I am a co-organizerLatest updates in Zoho Meeting | Calendar view, Zia integration with OpenAI, edit the recurring pattern in a recurring meeting, device error notifications revamp, and more.
Hello everyone, We’re glad to share a few updates and enhancements in Zoho Meeting, including the Calendar view, being able to edit the recurring pattern in a recurring meeting, revamped device error notifications, and other enhancements that you’ll findNew enhancements in the latest version of the Zoho Meeting Android mobile app.
Hello all, In the latest version of Zoho meeting Android mobile app (v2.2.6), we have brought in support for the below enhancements. Close account: Now users will be able to close their Zoho account directly from the app. Unmute toast message: If a userShare material, Lock Meeting and revamped feedback UI in the latest version of the Meeting iOS app.
Hello all, In the latest version of the Zoho Meeting iOS mobile app (v1.6), we have brought in the below enhancements. Share material in meeting: We have introduced share material during meeting that allows participants to view supported materials suchLatest updates in Zoho Meeting | New chat feature between an organizer and co-organizer in webinars, recording consent for webinar co-organizers and attendees in the Android app, and more.
Hello everyone, We’re excited to share a few updates for Zoho Meeting. Here's what we've been working on lately: A new chat feature between an organizer and co-organizer in webinars, recording consent for webinar co-organizers and attendees in the AndroidLatest updates in Zoho Meeting | A new Files tab to manage all your PDFs, PPTs, Video files and recordings, live transcription , ability to lock settings and adaptive echo cancellation.
Hello everyone, We’re excited to share a few updates for Zoho Meeting. Here's what we've been working on lately: A new Files tab to manage all your PDFs, PPTs, Video files and recordings, live transcription during sessions, ability to lock settings andLatest updates in Zoho Meeting | Meeting Rooms , Pin video feeds and customize from and reply-to email addresses
Hello everyone, We’re excited to share a few updates for Zoho Meeting. Here's what we've been working on lately: Introducing Zoho Meeting Rooms, an immersive solution for teams to connect over virtual meetings in video conference rooms. You can also pinLatest updates in Zoho Meeting | New top bar video layout, a revamp of our in-session settings and now import webinar registrations with a CSV file
Hello everyone, We’re excited to share a few updates for Zoho Meeting. Here's are some of them : We have moved audio, video, virtual background and preferences under a single settings pop-up for better user navigation. You can now upload a CSV file containingImportant update: Changes in email sender policies
Hello, This is to announce important changes to email sender policies from Google that may impact your use of Zoho Meeting. Restriction on public domains Effective February 1, 2024, Google is implementing policies that will affect the configuration ofChat for webinar session, schedule meeting session for 24 hours - Zoho Meeting iOS app update
Hello, everyone! In the most recent iOS version of the Zoho Meeting app, we have introduced the chat functionality for the webinar session. To access this feature, the Organizer should have the 'Public chat' option enabled on the Zoho Meeting desktopInvoice Copy 2005116990189
Please provide the invoice for the trancaction 2005116990189Darshan Hiranandani About
Hi, I’m Darshan Hiranandani, a dedicated software developer with a strong passion for creating efficient and user-friendly applications. With a degree in Computer Science and several years of experience in the tech industry, I specialize in full-stackLatest update in Zoho Meeting | On-demand webinars
Hello everyone, We’re excited to introduce our new on-demand webinar feature, you can now provide pre-recorded sessions that your audience can access immediately, no need to wait for scheduled sessions. Benefits of On-demand webinars : Scheduling flexibilityZoho Meeting iOS app update - Join breakout rooms, access polls, paste links and join sessions, in session host controls
Hello, everyone! In the latest iOS version(v1.7) of the Zoho Meeting app, we have brought in support for the following features: Polls in meeting session Join Breakout rooms Paste link in join meeting screen Foreign time zone in the meeting details screen.Zoho Meeting app update.
Hello, everyone! In the latest Android (v2.3.7) and iOS (v1.7.1) versions of the Zoho Meeting app, we have brought in support for the following features: Report Abuse option. WorkDrive integration. Report Abuse option You can now report to us any deceptiveZoho Meeting Android app update - v2.4.0
Hello everyone! We are excited to announce that we have brought in support for the following features in the latest version of the Zoho Meeting Android app(v2.4.0): 1. Start Personal Meeting Rooms 2. Revamp of the schedule meeting screen and meeting detailsIntroducing Zoho Desk integration and a few minor enhancements
Zoho Desk Integration We've now introduced an integration between Zoho Meeting and Zoho Desk to efficiently manage meeting-related customer inquiries. With this integration, you can track, respond to, and resolve meeting-related tickets directly fromZoho Meeting iOS app update: Hearing aid, bluetooth car audio and AirPlay audio support.
Hello everyone! We are excited to announce the below new features in the latest iOS update(v1.7.4) of the Zoho Meeting app: 1. Hearing aid support: Hearing aid support has been integrated into the application. 2. Bluetooth car Audio, AirPlay audio support:Zoho Meeting Android app update: Breakout rooms, noise cancellation
Hello everyone! In the latest version(v2.6.1) of the Zoho Meeting app update, we have brought in support for the following features: 1. Join Breakout rooms. 2. Noise cancellation Join Breakout rooms. Breakout Rooms are virtual rooms created within a meetingiOS 12 update: Introducing autofill passwords and Siri Shortcuts in Zoho Vault
With this iOS 12 release, Zoho Vault users can now autofill usernames and passwords on Safari and other third-party apps. Users can enjoy a seamless login experience to their everyday apps without compromising security and also access passwords stored in Zoho vault with Siri Shortcuts by adding personalized phrases. How to enable autofill password on your iOS device? First, you need to update your device to iOS 12. Apple recommends you to take a backup before you update your device to the latestZoho Vault: A look at what's new for iOS, iPadOS, and macOS
Hi everyone, At Zoho Vault, we constantly aim to improve your security experience. Based on both internal and external feedback, we have recently rolled out updates across our iOS, iPadOS, and support for macOS platforms. Introducing the desktop app forNext Page