Advanced Analytics for Jira
Get and analyze your project management data from Jira Software Cloud in minutes. With this connector, gain in-depth insights on projects, versions, epics, sprints, and many such KPIs.
The Advanced Analytics for Jira includes 75+ prebuilt reports and dashboards over your Jira data that help you to jump-start your analytics right away.
General
1. What is Zoho Analytics?
Zoho Analytics is a self-service BI and data analytics software that lets you analyze your data, create stunning data visualizations, and discover hidden insights in minutes.
Zoho Analytics offers the following important capabilities:
- Complete Online Business Intelligence and analytics service, accessible anytime, anywhere!
- Easy to adopt a 'spreadsheet-like' interface with powerful drag & drop based reporting features for quick report creation.
- Visual Analysis capability for in-depth analysis and to slice & dice your data.
- Wide range of reporting capabilities like Dashboards , Charts , Pivot Views , Summary Views , Tabular reports , and KPI widgets .
- Data import from various sources such as data stored in local drive ( CSV , Excel , JSON , HTML , XML , JSON , Statistical & MS Access files ), Web feeds and cloud storage . Also supports data import from local/hosted Databases and cloud databases. Supports periodic scheduling of importing data .
- Integrated with a suite of 15+ Zoho products such as Zoho CRM , Zoho Desk , Zoho Projects , Zoho People , Zoho Books , Zoho Subscriptions , Zoho Inventory , Zoho Campaigns , etc.,
- Integrated with 45+ popular business applications like Xero , QuickBooks , Stripe , Shopify etc.,
- Integrated with Zapier and Zoho Flow to power up import from over 500+ apps.
- Integrates with custom applications using APIs .
- Easily blend/merge data from across different sources to create meaningful business reports and get end-to-end cross-functional analytics.
- Supports an advanced formula engine for deriving key business metrics from your data.
- Supports SQL (Structured Query Language) driven querying for powerful data preparation and report creation.
- Supports Data alerts to track vital changes in your key business metrics.
- Collaborative reporting and analytics with fine-grained permission control over your shared data and reports with your colleagues & friends.
- Efficiently collaborate with your users by setting up real-time commenting on a shared view.
- Publish reports for wider consumption. Embed reports/dashboards within your websites, web applications, and blogs.
- Email , Export , and Print reports in a variety of formats.
- Highly secure as all users login only over HTTPS (SSL connection). All your data and reports are hosted in secure data centers. (Refer to Security and Privacy )
- Supports Logo Rebranding .
- Get the mobile apps (optimized for both IOS and Android platform) and access the reports and dashboards on the go.
2. Why Jira Software Analytics?
Get and analyze your project management data from Jira Software Cloud in minutes. With this connector, gain in-depth insights on projects, versions, epics, sprints, and many such KPIs.
Advanced Analytics for Jira brings in all the capabilities of Zoho Analytics described in the above question .
- A full-featured business intelligence (BI) and reporting tool that can slice & dice the Jira Software data to create any reports/dashboards you require.
- Create your own reports and dashboards based on your Jira Software data and also by blending data from other data sources.
- Blend Data - Build cross-functional visualizations to extract end-to-end insights by combine\ing data from a wide range of business applications.
- Ask Zia - Workspace is Ask Zia trained and can answer your question in minutes.
- Share reports and dashboards with your colleagues.
- Set up Alerts to get notifications on key business metrics.
- Schedule and email your reports whenever you want.
- Export your reports as PDF, HTML, Excel, CSV and image files.
- Embed your reports on websites, blogs, etc.
3. Who can subscribe to the Zoho Analytics - Jira Software connector?
Users with paid accounts of both Zoho Analytics (at least the Basic plan) or Zoho CRM Plus / Zoho One and with admin privileges in Jira Software Cloud can avail this connector.
Pricing & Trial
1. How much does this connector cost?
Jira Software Analytics is bundled free for all the paid users of Zoho Analytics. The Zoho Analytics paid plans start at ₹ 1,200 per month . Click to learn more about Zoho Analytics pricing page.
2. Do you provide trial evaluation for this connector?
Yes, we do provide a 15-day free trial for this connector from the date of set up.
3. What do you mean by 'Users' in the (connector) pricing plan?
Anyone to whom you privately share your Workspace, tables (data), reports, and dashboards, created in Zoho Analytics, for collaboration is considered a 'User' in Zoho Analytics. A user is identified by his/her unique email address, with which their Zoho Analytics account was registered.
Suppose you subscribe to the Zoho Analytics Standard plan, you can privately share the data/reports in your account and collaborate with 4 other persons. Now your Zoho Analytics account is said to have 5 users (including yourself).
4. What do you mean by 'Rows'/'Records' and how is it calculated in the pricing plan?
In Zoho Analytics, a row or record is defined in the same context as in a database (or spreadsheet). In simple terms, a table consists of rows (records) and columns (fields). Each row in a table represents a set of related data and has the same structure.
For example, in a table that represents "Customers", each row would represent a single record. The number of rows calculated for pricing is the sum of all rows/records stored across all your Workspace tables in your Zoho Analytics account.
Setup
1. Who can setup the Jira Analytics Connector?
The Account Administrator and the Organization Administrators can set up the Advanced Analytics connector. Click here to learn about Managing Users.
The credentials of the Administrator who set up the connector, will be used for establishing any connections with source application by other administrators.
2. How do I setup the Jira Software Cloud Advanced Analytics connector?
 Note: Only Jira administrators can set up this integration.
3. How long should I wait for my Jira Software data to initially appear in Zoho Analytics?
After setting up the integration, you might have to wait sometime for the initial fetch to happen. Depending on the amount of data in your application, the reports and dashboards might take up to 5 minutes to display all the metrics. If you access the workspace before the initial fetch, it will not display any data.
4. What are the modules in Jira Software Cloud that will be synchronized in Zoho Analytics Workspace?
The following are the default modules that will be imported from Jira Software Cloud.
- Sprints: Detailed list of the sprints created in Jira Software.
- Backlogs: A record of every product backlog.
- Projects: List of the projects configured in Jira Software.
- Epics: Details of every epic created in Jira Software.
- Issues: A history of the issues logged in Jira Software.
- Worklog: A detailed record of the time logged in Jira Software.
5. I got this email which said 'Setup Process Failed'. What should I do?
- Open the Workspace in which you have set up the connector.
- Click the Data Sources button in the Explorer tab.
- In the Data Sources page that opens click the Retry Now link. If the issue persists please do write to support@zohoanalytics.com. We will look into it and get back to you immediately.
6. I got this email which said 'Jira Data Synchronization Failure'. What should I do?
Data sync may sometimes fail due to a variety of reasons such as Authentication Failure, your business application is down etc. In that case, you will receive the "Data Synchronization Failure" mail with the reason for the failure and its solution. Click here to learn more about Synchronization Error Failures and their solutions.
7. How frequently can I synchronize my data with Zoho Analytics?
You can choose to synchronize data at one of the intervals mentioned below.
- 1 Hour (Enterprise plan Only)
- 3 Hours
- 6 Hours
- 12 Hours
- Every day
Note:
- Users in Enterprise plan alone can choose to synchronize data at every 1 hour.
- Users in Basic plan can synchronize their data only once everyday.
8. Can I edit the Jira Software Cloud Synchronization setting?
Yes, you can edit the synchronization setting if you are the administrator who setup the connector. To do so,
- Open the corresponding Jira Software Cloud Advanced Analytics Workspace in Zoho Analytics.
- Click Data Sources on the left panel.
- In the Data Sources page that opens, click the Edit Setup link.
- The Edit Setup - Jira Software Cloud Online dialog will open. Modify the settings as needed.
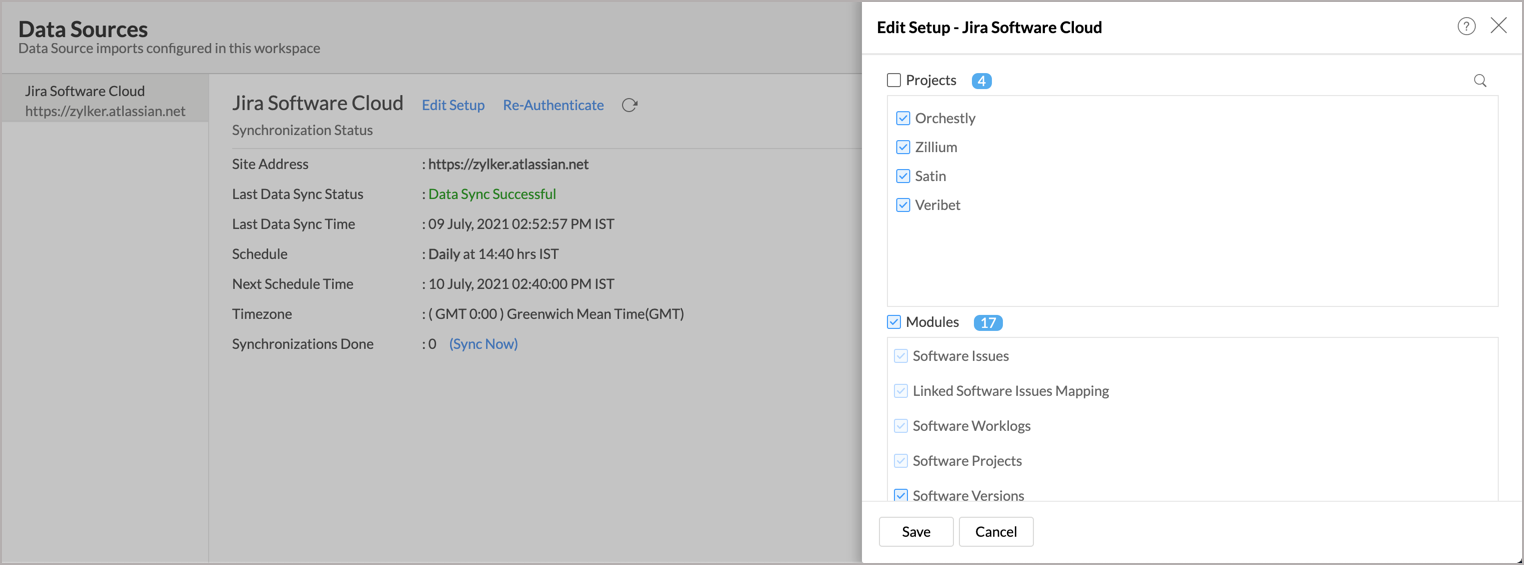
- Click Save . The synchronization setting will be modified and data will be synced in the next synchronization interval.
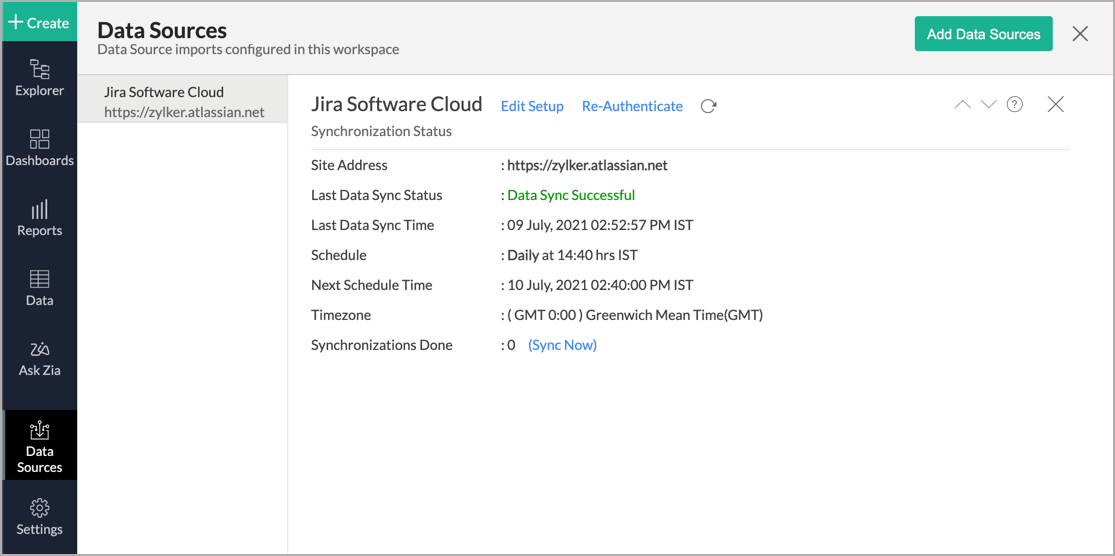
9. Can I view the data synced history?
- Open the corresponding Jira Analytics Workspace in Zoho Analytics.
- Click Data Sources on the left panel. All the data source of the workspace will be listed.
- Click Jira. The Data Sources page for Jira will open.
- In the Data Sources page that opens, click the Sync History link.
- A calendar with the sync history of the last 45 days will open. The date when the data sync has happened will be highlighted. Hover to view the number of times the data had got synced on a specific date.
- Click the date to view more details.
- Time - Displays the time when the data is synced.
- Status - Shows whether the sync was a success or a failure.
In case of failure, the reason will be displayed. Refer to this page to learn how to resolve the issue and avoid further failure .
10. Can I synchronize my Jira Software Cloud data instantly?
Yes, you can synchronize your Jira Software Cloud data instantly when needed.
To synchronize your data instantly:
- Open the corresponding Jira Software Cloud Advanced Analytics Workspace in Zoho Analytics.
- Click Data Sources on the left panel.
- Click Sync Now . Jira Software Cloud data will get instantly synchronized.
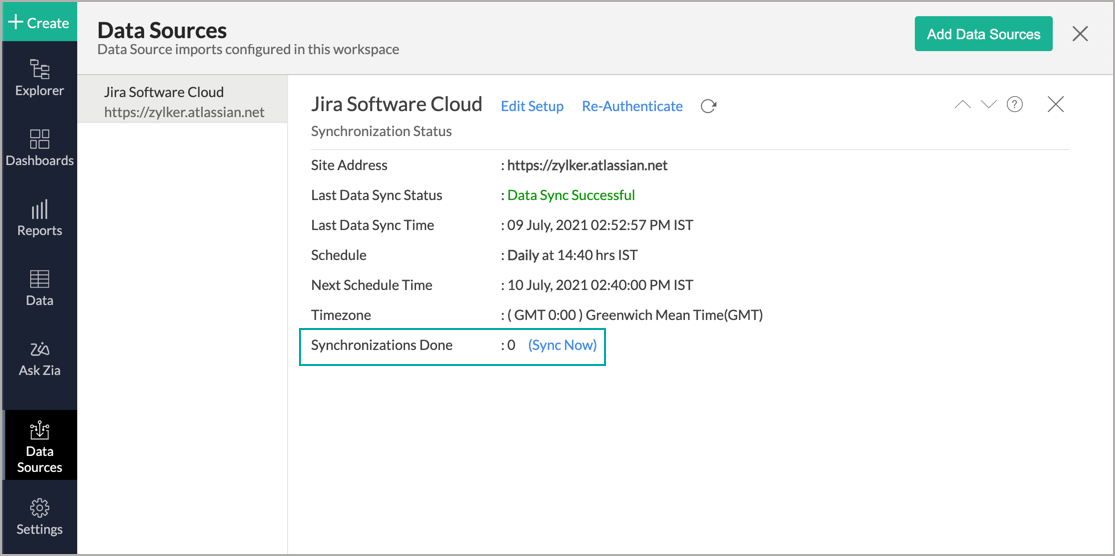
Note: This option can be used up to five times between the schedules.11. Can I setup the Jira Software Cloud Advanced Analytics in any other existing Workspace or in any other Advanced Analytics Workspace?
Yes, you can setup the Jira Software Cloud Online Advanced Analytics in any of the existing Workspace or in any of the Advanced Analytics Workspace to analyze data together. You can blend/combine data from Jira Software Cloud Advanced Analytics with the desired data. To know more about the same, refer to the Cross-Functional Analytics section.
12. Can I add/modify data in the Jira Software Cloud Analytics data tables within Zoho Analytics?
No, you cannot add/modify data in the Jira Software Cloud data tables. Data from the Jira Software Cloud application will automatically get synced into Zoho Analytics in the different tables. You cannot edit any of this data or add new data records from within Zoho Analytics.
However, you can add new tables and add/import data into that, to create reports combining it with the data from Jira Software Cloud.
13. Can I add new columns to the Jira Software Cloud data tables within Zoho Analytics?
No, you cannot add new columns. But, you can add Custom and Aggregate Formulas (i.e., calculated fields) to these tables to help you create powerful reports. Refer to Adding Formulas to know more about this.
14. Can I add new data tables in this Workspace to create reports & dashboards?
Yes, you can add new data tables. Click New > New Table to add a new table in the existing Jira Software Cloud Advanced Analytics Workspace.
With this feature, you can import data from other sources or add them manually into your Workspace to analyze and create reports combining this with your Jira Software Cloud data.
Refer:
- Import data from files
- Import data from Web feeds
- Import data from Cloud Storage
- Import data from local databases
- Import data from Cloud databases
- Import data from popular Business Applications
- Import data using Zoho Analytics API
15. How do I re-authenticate my Jira Software Cloud account in Zoho Analytics?
You can re-authenticate the setup by following the below steps.
- Open the corresponding Jira Software Cloud Advanced Analytics Workspace in Zoho Analytics.
- Click Data Sources on the left panel.
- Click Re-Authenticate.
- In the Re-Authenticate Jira Software Cloud dialog, click Authenticate Jira Software Cloud button.
- Provide the authentication credentials - Jira Admin Email Address and API Token, and click Authenticate Jira Software Cloud button.
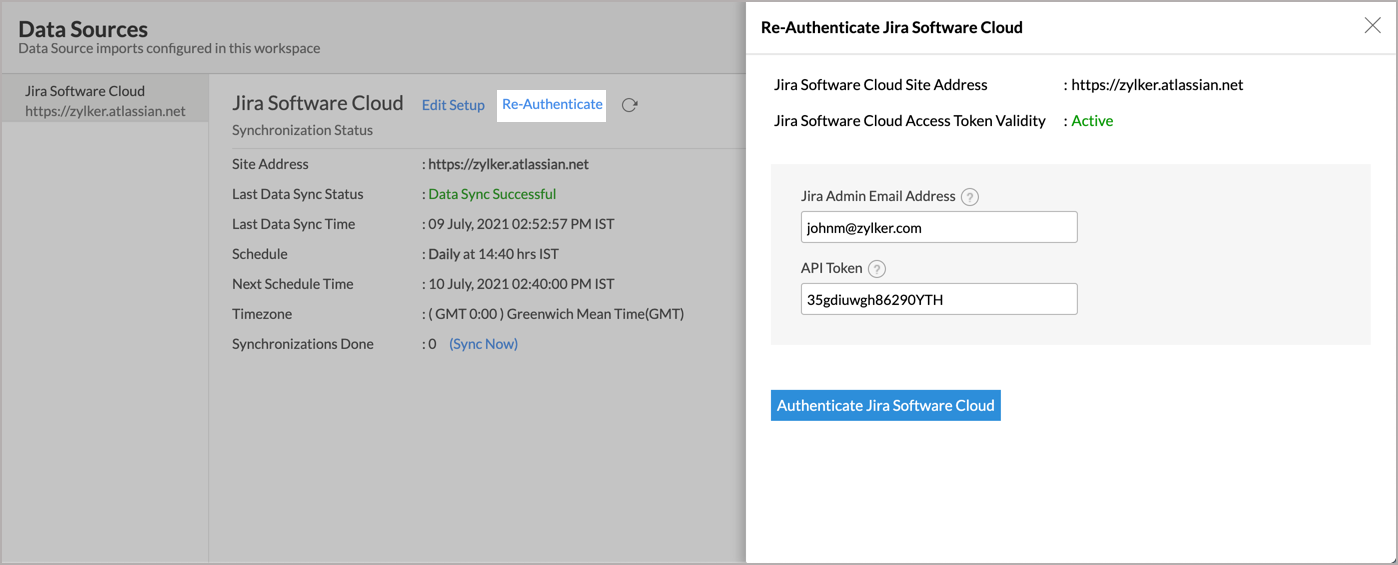
Your account will be successfully authenticated.
16. Can I transfer my Zoho Analytics connector to another admin account?
17. Can I track the action by all users in the connector workspace?
- Open the corresponding Zoho Campaigns Advanced Analytics Workspace in Zoho Analytics.
- Click Data Sources on the left panel.
- The Data Sources page will open. Click Audit History.
- A dialog with audit history for the last 180 days will open with the following information.
- Date & Time of the action
- Action done
- User who performed the action.
- User Actions
- Create - Connector setup created
- Edit Setup - Edit connector setup to do the following changes.
- Modules Added
- Modules Removed
- Fields Added
- Fields Removed
- Schedule Change and
- Entities (Campaigns, Org, Handles) Modified
- Delete - Remove integration
- Take Ownership - Transferred connector to other admin.
- Re-authenticate - Re-authenticate business app
- Sync Now - Sync data instantly
- Retry Now - Retry to import data after initial setup failure
- Connector Activated (when you upgrade from Basic plan to Standard plan)
- Connector Disabled (when you downgrade from Standard plan to Basic plan)
- Create - Connector setup created
- System Event - Any action done by Zoho Analytics
- The Connector is automatically deleted when you downgrade to free plan.
- The Connector is automatically restored when you upgrade from free plan to a higher plan.
- The Connector is automatically deactivated when you downgrade your plan.
- The Connector is automatically activated when you upgrade to a higher plan.
- The Connector is manually restored by the Zoho Analytics support.
- Data synchronization schedule automatically changed to interval supported to your new pricing plan.
18. How can I remove the Integration?
You can remove the connector from the Data Source page.
- Open the Jira Software Cloud Data Source page.
- Hover the mouse over the Data Source name in the left corner. A Settings icon will appear.
- Click the Settings icon.
- Select Remove Data Source .
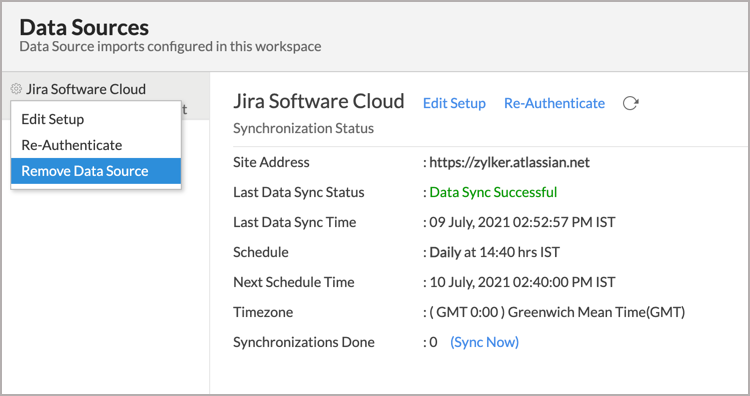
The data synchronization from Jira Software Cloud into this Workspace will be removed. However, you will still be able to access this Workspace with existing data.
Reporting Features
1. In which modules of Jira Software Cloud can I create reports?
Zoho Analytics will synchronize the data specified in this question into the Jira Software Cloud Analytics workspace. You can create reports using this data.
2. How do I create my own reports with this connector?
3. Can I create reports using the columns from different tables?
Yes, you can create reports using the columns from different tables. All the modules (tables) from Jira Software Cloud will be linked by default. You can create reports by simply dragging and dropping the required columns into the reports designer.
4. What are the report types supported by Zoho Analytics?
Zoho Analytics supports a wide variety of reports.
- Charts
- Pie
- Bubble
- Packed Bubble
- Bar
- Stacked bar
- Line
- Smooth Line
- Scatter
- Combination
- Map Chart
- Area
- Stacked Area
- Web
- Funnel
- Doughnut
- Table View
- Pivot tables (Matrix Views)
- Summary view
- Tabular view
- KPI Widgets
- Single Numeric Widget
- Dial Chart Widget
- Bullet Chart Widget
- Dashboards (multiple reports arranged in the same page)
5. What are the default reports & dashboards created by Zoho Analytics, on setting up this connector?
When you setup/configure the Jira Software Cloud Connector, 75+ default reports & dashboards are automatically created. These hand-picked reports will be pretty useful in analyzing your help data effectively.
6. What are Formulas in Zoho Analytics?
Formulas, as the name indicates, are calculations that help you derive key business metrics that can be used for reporting and analysis. Zoho Analytics provides a powerful formula engine to create any type of calculations required, to enable creating the required reports.
Refer to Adding Formulas in Zoho Analytics to know more.
7. What are the default formulas that gets added by Zoho Analytics on setting up this connector?
The default formulas added by Zoho Analytics are listed below. You can view these formulas by opening the corresponding table and selecting Add > Edit Formulas from the toolbar.
Note : The formulas provided is based on the general accounting standards.
The following are the formulas in the Sprints table.
| Formula Name | Formula Type | Formula | Description |
| Sprint Duration (Days) | Formula Column | Datediff ("End Date", "Start Date") | Displays the sprint duration. |
The following are the formulas in the Software Worklogs table.
| Formula Name | Formula Type | Formula | Description |
| Time Worked | Formula Column | Round (.000035*"Time Worked",3) | Displays the amount of time worked. |
The following are the formulas in the Software Versions table.
| Formula Name | Formula Type | Formula | Description |
| Release Deviation (in Days) | Formula Column | If ( dateandtimediff( day,"Release Date","User Release Date")=0, 'Released as per schedule', If (dateandtimediff(day,"Release Date","User Release Date")>0 and dateandtimediff (day,"Release Date","User Release Date")<=10, 'Delayed by 1-10 days', If (dateandtimediff(day,"Release Date","User Release Date")>10 and dateandtimediff (day,"Release Date","User Release Date")<=30, 'Delayed by 11-30 days', If ( dateandtimediff (day,"Release Date","User Release Date")>30, 'Delayed more than 30 days', If ( dateandtimediff (day,"Release Date","User Release Date")<0, 'Released ahead', 'NA'))))) | Displays the release deviated days range. |
The following are the formulas in the Software Issues table.
| Formula Name | Formula Type | Formula | Description |
| Time Logged (in Days) | Formula Column | ("Time Spent"*.000278/8) | Displays the log time. |
| Remaining Estimate (in Days) | Formula Column | if ("Remaining Estimate"=0,0,("Remaining Estimate"*.000278/8)) | Displays the remaining days available before reaching the estimate. |
| Original Estimate (in Days) | Formula Column | ("Original Estimate"*.000278/8) | Displays the original estimate value. |
| Time Left Until Due Date | Formula Column | if ( Isempty ("Due Date")=1 or "Status"='Done','NA', if ( dateandtimediff (DAY, currentdate() "Due Date")=0,'Due today', if ( dateandtimediff (DAY, currentdate() ,"Due Date")>0 and dateandtimediff (DAY, currentdate() ,"Due Date")<7,'Less than 7 days', if ( dateandtimediff ( DAY, currentdate() ,"Due Date")>=7 and dateandtimediff (DAY, currentdate() ,"Due Date")<14,'Less than 14 days', if ( dateandtimediff ( DAY, currentdate() ,"Due Date")>=14 and dateandtimediff (DAY, c currentdate() ,"Due Date")<21,'Less than 21 days', if ( dateandtimediff ( DAY, currentdate() ,"Due Date")>=21 and dateandtimediff (DAY, currentdate() ,"Due Date")<60,'Less than 60 days', if ( dateandtimediff (DAY, currentdate() ,"Due Date")>=60 and dateandtimediff (DAY, currentdate() ,"Due Date")<180,'Less than 180 days', if ( dateandtimediff (DAY, currentdate() ,"Due Date")>=180,'Due after 180 days', if ("Due Date"< currentdate() ,'Overdue','NA'))))))))) | Calculates the time range available before reaching the due date. |
| Working Days Left Until Due Date | Formula Column | if ("Due Date"< curdate() or "Status"='Done',0, ( floor (( Dayofweek (( subdate ("Due Date",2)))+( datediff ("Due Date", curdate() )))/7))+( floor (( Dayofweek (( subdate ("Due Date",3)))+( datediff ("Due Date", curdate() )))/7))+( floor (( Dayofweek (( subdate ("Due Date",4)))+( datediff ("Due Date",curdate())))/7))+( floor (( Dayofweek (( subdate ("Due Date",5)))+( datediff ("Due Date", curdate() )))/7))+( floor (( Dayofweek (( subdate ("Due Date",6)))+( datediff ("Due Date", curdate() )))/7))) | Displays the count of working days left until due date. |
| Days Since Last Update | Formula Column | Datediff ( curdate (), "Last Updated Time") | Displays the number of days since the last update. |
| Days Since Update - Age Tier | Formula Column | if ("Days Since Last Update">=0 and "Days Since Last Update"<=10,'0 - 10 Days', if ("Days Since Last Update">10 and "Days Since Last Update"<=30,'11 - 30 Days', if ("Days Since Last Update">30 and "Days Since Last Update"<=45,'31 - 45 Days', if ("Days Since Last Update">45 and "Days Since Last Update"<=60,'46 - 60 Days', if ("Days Since Last Update">60,'Over 60 Days','Over 60 Days'))))) | Displays the age tier since the last update. |
| Story Points Remaining | Formula Column | If ("Status"='Done',0,"Story Points") | Displays the remaining story points. |
| Story Points Completed | Formula Column | If ("Status"='Done',"Story Points",0) | Displays the story points completed. |
| Minutes Left to Breach Due Date | Formula Column | if ("Status"!='Done', dateandtimediff (MiNUTE, currentdate() , "Due Date"),NULL) | Displays the minutes left to breach due date. |
| Days Since Last View | Formula Column | Datediff ( curdate() ,"Last Viewed") | Displays the number of days since the last view. |
| Days Since Creation | Formula Column | Datediff ( curdate() ,"Created Date") | Displays the number of days since the creation. |
| Days Overdue | Formula Column | if ("Due Date"<now() and "Status"!='Done', Dateandtimediff (DAY, "Due Date", now() ),0) | Displays the number of days overdue. |
| Time Elapsed Percentage | Aggregate Formula | ( sum ("Software Issues"."Time Spent")/sum("Software Issues"."Original Estimate"))*100 | Displays the time elapsed percentage. |
| Issue Count | Aggregate Formula | Count ("Software Issues"."Issue ID") | DIsplays the total issue count. |
| Avg issue per day | Aggregate Formula | Count ("Software Issues"."Issue ID")/ distinctcount ( date ("Software Issues"."Created Date")) | Displays the average number of issues per day. |
| Resolved issues (by status) | Aggregate Formula | Countif ("Software Issues"."Status" = 'Done') | Displays the issues resolved based on status. |
| Resolved issues (by resolution) | Aggregate Formula | Countif ("Software Issues"."Resolution" = 'Done') | Displays the issues resolved based on resolution. |
| % of issues closed late | Aggregate Formula | 100*( Countif ("Software Issues"."Status" = 'Done' and "Software Issues"."Resolution Date" > "Software Issues"."Due Date")/ Countif ("Software Issues"."Status" = 'Done')) | Displays the percentage of issues closed late. |
| % of issues closed on time | Aggregate Formula | 100*( Countif ("Software Issues"."Status" = 'Done' and "Software Issues"."Resolution Date" < "Software Issues"."Due Date")/ Countif ("Software Issues"."Status" = 'Done')) | Displays the percentage of issues closed on time. |
| Issues completed on target | Aggregate Formula | Countif ( absmonth ("Software Issues"."Resolution Date") = absmonth("Software Issues"."Due Date")) | Displays the count of issues closed with respect to the target. |
| Percentage of Underestimated Issues | Aggregate Formula | 100*(( Countif ("Software Issues"."Work Ratio" > 100))/ Countif ( isnull ("Software Issues"."Original Estimate") = 0)) | Displays the percentage of underestimated issues. |
| Resolution percentage | Aggregate Formula | 100*( Countif ("Software Issues"."Status" = 'Done')/ Count ("Software Issues"."Issue ID")) | Displays the resolution pending. |
| Epic completion percentage | Aggregate Formula | 100*(( Countif ( Isnull ("Software Issues"."Epic Name") = 0 and "Software Issues"."Status" = 'Done'))/( Countif ( Isnull ("Software Issues"."Epic Name") = 0))) | Displays the epic completion percentage. |
| Estimation Accuracy | Aggregate Formula | 100*(( Countif ("Software Issues"."Work Ratio" <= 100))/ Countif (isnull("Software Issues"."Original Estimate") = 0)) | Displays the estimation accuracy. |
| Underestimated Issues | Aggregate Formula | Countif ("Software Issues"."Work Ratio" > 100) | Displays the underestimated issues. |
8. Can I create my own custom formulas in Zoho Analytics? If yes, how do I create?
Yes, you can create your own custom formulas in Zoho Analytics. To know how to create your own formulas, refer to the Adding Formulas in Zoho Analytics help page.
9. Can I combine/blend data from other sources with the data from Jira Software Cloud to create reports and dashboards?
Yes, you can combine data from your other sources with your Jira Software Cloud data for analysis.
To do this, you need to add/import a new data table into the Jira Software Cloud Advanced Analytics Workspace as explained in the previous question and then define a look-up to join it with the table from Jira Software Cloud.
To define a lookup relationship between two tables, it is essential that the tables have at least one column which is common between them. Follow the below steps to look up a column from Jira Software Cloud along with the data from any other source.
- Open the corresponding table, right-click the column header and select Change to Lookup Column .
- In the Change to Lookup Column dialog that opens, select the column to look up.
- Click OK.
10. Can I create reports using columns from multiple tables?
Yes, you can create reports using columns from multiple tables. Refer to Joining Tables in Zoho Analytics for detailed help on this.
11. What are Query Tables?
Zoho Analytics allows you to drive the data required by writing standard SQL SELECT Queries. This feature is called Query Tables. With Query Tables, you can also combine data from different tables and create reports from the same. Click here to know how to create Query Tables in Zoho Analytics.
Cross-Functional Analytics with Popular Business Applications/Other Data Sources
1. What are the popular business applications/other data sources that I can integrate this connector with?
You can integrate and perform cross-functional analytics with most business applications / other data sources that Zoho Analytics integrates with.
2. How can I analyze the data from the third party business applications/other data sources along with Jira Software Cloud?
To import data from business apps,
- Open the Workspace in which you have setup the connector.
- Click the Import Data button.
- In the Create New Table tab that opens, select the application or data source that you wish to import.
- Provide the necessary authentication.
- Select the necessary modules and fields.
- Select the schedule import option.
- Click Create . Data from the selected application will be imported into a new table in the Jira Software Cloud Advanced Analytics workspace.
3. Will a lookup relationship between the related modules from Jira Software Cloud and other third-party applications be created automatically?
The automatic lookup relation is not available for this connector. However, you can manually create lookup relationships.
To manually create a lookup relationship, refer to this help link - Click here .
Users, Sharing & Collaboration
1. How do I share the reports in Zoho Analytics with my colleagues?
You can easily share the reports that you create with the other users in your organization. Refer to Sharing and Collaboration help page for more details on this.
Once you privately share a report to your colleagues they will be able to access the reports as you do. Refer here to know how to access the reports.
2. What are the user roles available in Zoho Analytics?
Zoho Analytics offers four user roles - Account Administrator, Organization Administrator, Workspace Administrator, and User. Click to know more about the Zoho Analytics Organization Model and User Roles .
3. Why can't other users edit the reports that I have shared with them?
This is the expected behavior. Only when the users to whom the reports are being shared are set as a Workspace Administrator, they will be able to edit the reports. If a normal user wants to edit the report, he/she will have to save the report with a new name using the Save As option toolbar. The User can edit this report. To know more about user roles click here .
4. Can I share the same report created, to multiple users with different criteria associated so that they see different data?
Yes, you can. Refer to the topic Apply filter criteria.
5. Can I export a report/dashboard?
Yes, you can export the report/dashboard in various file formats such as CSV, EXCEL, PDF, HTML, and Image. Click to know more.
6. How can I print the reports & dashboards created in Zoho Analytics?
To print the report/dashboard, you first need to export it. You can export the report in various file formats such as CSV, EXCEL, PDF, HTML, and Image. Click to know more.
Note: If you are a user to whom a report has been shared and you want to take a print, ensure you have been provided the Export permission by the Administrator to the report, only then you will be able to print the report.7. How can I email reports & dashboards created in Zoho Analytics in a scheduled manner?
If you are the Administrator of the Zoho Analytics or a 'Workspace Administrator', you can schedule reports and dashboards to be emailed automatically. Refer to the email schedule section in this help documentation .
8. Can I embed/create permalink for reports & dashboards created in Zoho Analytics?
Yes, you can embed/create permalink for reports & dashboards. You can also create a slideshow of views. Refer to the Publishing Option section to learn how to do this.
Solutions
1. Does Zoho Analytics offer Embedded Analytics or rebranding?
Yes, Zoho Analytics supports various rebranding options such as Portal rebranding/white labeling and Logo Rebranding .
Read about the various pricing plans that we offer from the Pricing section.
Help & Support
1. How do I get technical support on Zoho Analytics?
We offer 24x5 technical support (Monday to Friday). In case if you need our assistance kindly do mail us your questions to support@zohoanalytics.com .
You can also reach out to us on our toll-free numbers.
United States: +1 (888) 900 9646
United Kingdom: +44 (20) 35647890
Australia: +61-2-80662898
India: +91-44-6965 6060
2. Can I have someone from Zoho do a demo for me?
Yes, certainly. Register for a demo in this page .