Anomaly detection
What is Anomaly Detection?
Anomaly detection, also known as outlier detection, is the process of identifying records or data points that significantly deviate from the expected pattern or behavior in a dataset. Detecting anomalies helps users identify potential data quality issues, unusual business trends, operational risks, or unexpected spikes and drops in performance.
Zoho DataPrep provides anomaly detection capabilities using statistical techniques such as IQR (Interquartile Range), Z-score, and Percentile-based methods to identify unusual values in the data. These methods can be applied based on the nature and distribution of the dataset, helping users clean, monitor, and analyze data more effectively before downstream processing and analytics.
To apply Anomaly detection
1. Right-click a column and select the Anomaly Detection option from the context menu.

Note: The Anomaly Detection transform supports all data types except Text, List, Map, Boolean, URL, and Email.
2. Select the Model that you want to use to detect outliers. The available models are grouped into two categories — Statistical models (IQR, Z-score, and Percentile) and Custom range.
Statistical models
IQR - The interquartile range (IQR) is a measure of statistical dispersion that describes the range within which the middle 50% of a data set falls. The Outliers are calculated based on this range. Learn more
ZScore - The Z-score determines how far a data point is from the mean of the dataset in terms of standard deviations. By default, a data point will be marked as an outlier if the Z-score is more than 3 standard deviations. Learn more
Percentile - A percentile is a statistical measure that represents the relative position of a particular value within a dataset. Percentiles divide the data into 100 equal parts, and the value at each percentile indicates the percentage of values that are equal to or below a given value. Outliers will be determined based on the percentile value. Learn more
Custom range
In this method, the upper bound and the lower bound are any particular values from the data. The outliers are calculated based on the thresholds. Learn more

Info: Range fields support a maximum numeric precision of 38 and scale of 15. Values exceeding this limit will automatically be set to null
3. Provide the required details and click Apply to detect the outliers.
If you choose the IQR model
What is IQR?
The interquartile range (IQR) is a measure of statistical dispersion that describes the range within which the middle 50% of a data set falls. The Outliers are calculated based on this range.
The IQR is calculated as the difference between the third quartile (Q3) and the first quartile (Q1). The default scale value of 1.5 is multiplied by the IQR to determine the upper and lower boundaries (thresholds). The threshold values can be adjusted based on the distribution of the data.
For data with a skewed distribution, the adjusted IQR method will be applied.
1. Under Threshold, enter the values for the Lower limit and Upper limit. The threshold defines the boundary beyond which a value is considered an outlier. The scale value is multiplied by the IQR to determine these boundaries.
Note: The allowed range is 0-2
2. Select the Apply adjusted IQR method when data is skewed check box to automatically apply the adjusted IQR method for skewed data. This checkbox is selected by default. Uncheck it if you want to apply the standard IQR method regardless of skewness.
3. Select the Flag anomaly check box if you want to flag records with anomalies in a new column. For records with anomalies, the Anomaly Flag column will be marked. For records with no anomalies, the column will remain empty. You can use this column to review or filter anomalous records before deciding what action to take.
4. Click Apply.
If you choose the Z-score model
What is Z-score model?
The Z-score determines how far a data point is from the mean of the dataset in terms of standard deviations. By default, a data point will be marked as an outlier if the Z-score is more than 3 standard deviations.
A Z-score of ±3 is often set as a threshold for detecting the outliers. This means that data points falling beyond 3 standard deviations from the mean in either direction (to the left or right) are considered outliers. The thresholds can be adjusted based on the distribution of the data.
For data with a skewed distribution, the modified Z-score method will be applied. The Z-score is calculated based on the Median Absolute Deviation method.
1. Under Number of standard deviations, enter the lower and upper limits. The default values are -3 and +3. Data points that fall beyond these limits will be marked as outliers.
2. Select the Apply modified Z-score method when data is skewed check box to automatically apply the modified Z-score method for skewed data. The modified Z-score is calculated from the median absolute deviation (MAD) multiplied by a constant value of 0.675. Uncheck this option if you want to ignore skewness.
3. Select the Flag anomaly check box if you want to flag records with anomalies in a new column. For records with anomalies, the Anomaly Flag column will be marked. For records with no anomalies, the column will remain empty. You can use this column to review or filter anomalous records before deciding what action to take.
4. Click Apply.
If you choose the Percentile model
What is Percentile model?
A percentile is a statistical measure that represents the relative position of a particular value within a dataset. Percentiles divide the data into 100 equal parts, and the value at each percentile indicates the percentage of values that are equal to or below a given value. Outliers will be determined based on the percentile value.
The 10th and 90th percentiles are set as the default values for the lower and upper limits respectively.
1. Enter the lower and upper percentile limits. Values below the lower limit and above the upper limit will be treated as outliers. For example, a lower limit of 10 means values below the 10th percentile are flagged, and an upper limit of 90 means values above the 90th percentile are flagged.
Note: The allowed values range is 1 to 99. The percentile cannot be decimal value.
2. Select the Flag anomaly check box if you want to flag records with anomalies in a new column. For records with anomalies, the Anomaly Flag column will be marked. For records with no anomalies, the column will remain empty. You can use this column to review or filter anomalous records before deciding what action to take.
3. Click Apply
If you choose the Custom range option
In this method, the upper bound and the lower bound are any particular values from the data. The outliers are calculated based on the thresholds.
Info: Range fields support a maximum numeric precision of 38 and scale of 15. Values exceeding this limit will automatically be set to null
1. Enter the lower and upper limit values for the custom range.
Note: Please enter absolute values for the lower and upper limits, and ensure the value provided for the lower limit is less than the one provided for the upper limit.
Info: For date columns, the lower and upper limit values displayed in the rule will appear as Unix timestamp values instead of the date format you entered.
2. Provide the required input and click Apply.
3. Select the Flag anomaly check box if you want to flag records with anomalies in a new column. For records with anomalies, the Anomaly Flag column will be marked. For records with no anomalies, the column will remain empty. You can use this column to review or filter anomalous records before deciding what action to take.
To apply filters
If you want to apply some filters along with this transform, you can use the filters functionality.
1. Click the Filters tab.
2. Click the  icon and add the required columns in the Filters section. You can also reorder the filters using the drag and drop method.
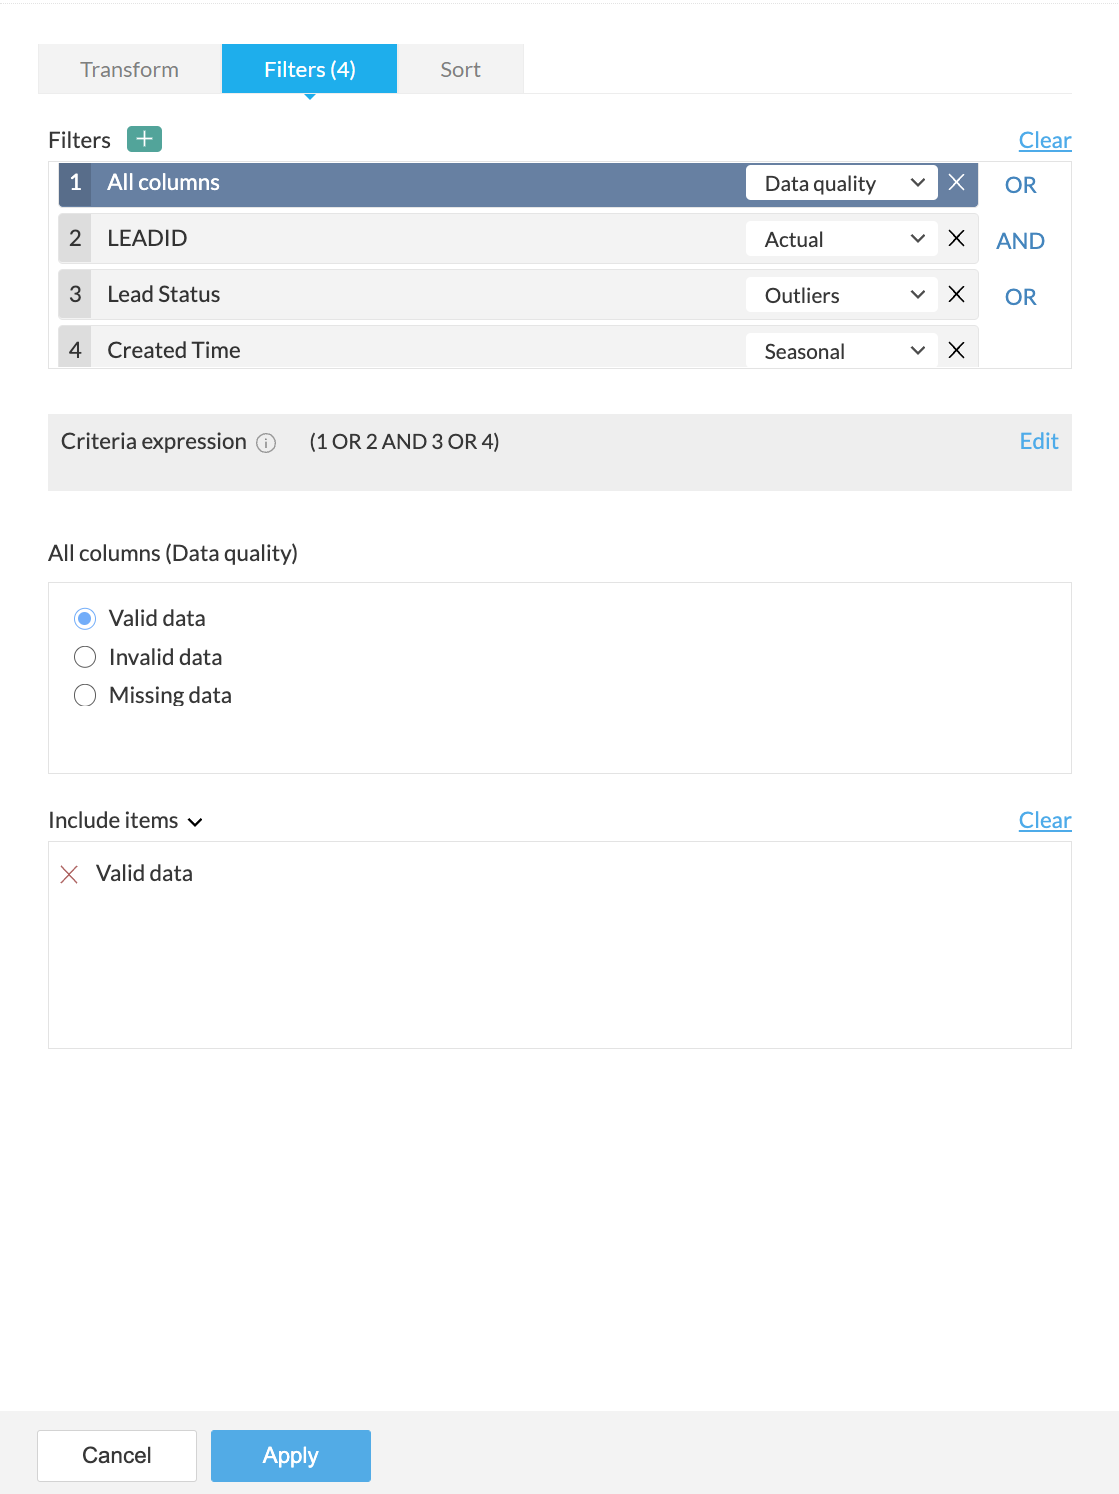
3. For every column added, you can select one of the following options from the drop-down:
- Actual: This option lets you filter rows based on the actual values in the column. Click here to know more.
- Data quality: This option lets you filter rows based on the quality of data in the column. Click here to know more.
- Patterns: This option helps you filter rows based on the data patterns in the selected column. Click here to know more.
- Seasonal: This option helps you filter rows based on the seasonal parameters such as quarter, month, week, etc. Click here to know more.
- Outliers: This option allows you to filter rows based on the outliers present in the data of the selected column. Click here to know more.

Note: The filter options are displayed based on the datatype of the column added for the filter.
4. When you add more than one filter to the Filters section, the logical operators, AND or OR appear next to the filters. You can click to toggle the logical operator between AND and OR.
- Using the logical operators, you can combine the conditions and apply logic to determine the rule of precedence. The final expression is displayed in the Criteria expression box. You can click Edit to alter the default expression using logical operators and parenthesis to specify the precedence or the sequential order as to which condition should be evaluated first. Click Save after making the required changes.
- For example, In the expression, ((1 OR 2) AND (3 OR 4)) , at first the condition ( 1 OR 2 ) will be executed and the condition ( 3 OR 4 ) will be executed next. Thirdly, since, the AND operator is used, the filter will be applied when both the conditions are true.
5. You can further drill down to choose specific values based on the filter option selected for each filter, in the next section.

For example, in the above screenshot, the Data quality option is selected for the All columns filter in the Filters section. Based on the selection, further options to filter specific values are displayed in the All columns (Data quality) section.
6. You can choose to include or exclude the selected items in the last section.
7. If you want to remove all the filters for some reason, you can use the Clear button.
8. A live preview of the filter transform is shown as you make changes.
9. Click the Apply button to apply the transform along with the filters.
To sort data
Under the Sort tab, you can sort data in the ascending or descending order based on any column. You can choose the column in the Sort by column drop down and choose the order to be sorted.
You can use this functionality only with the transform and not as a standalone function. However, you can use the Sort transform if you want only to sort data.
SEE ALSO