Survey Reports
Survey reports in Zoho People contains graphs and other important figures that can provide useful insights. Once the survey is completed, you can analyze the responses received from your employees through survey reports and use them to improve your workplace environment and employee satisfaction levels.
eNPS Survey Reports
- From home page, click Employee Engagement > eNPS tab.
- Click the drop down and select Completed from the list.
A list of completed survey displayed.

You can also view the report of an Ongoing survey to monitor participation levels.
- Click on the survey for which you need to view the report.
The survey summary are listed on the details tab. - Click Reports tab to view survey reports.
- Use the time range drop-down for surveys with a repeat schedule to view the reports of a specific time period.
- The overall eNPS score, average score, and response rate of each survey are given.
- The reports also show the eNPS distribution in terms of promoters, passives and detractors.
- Repeated surveys come with a quarterly, monthly, or annual trend report (based on the set frequency) which shows how many employees have responded across time.
- The rating distribution graph displays the number of responses against each score.
- The key highlights section gives a quick snapshot of the highest promoters and retractors of each entity.
- Distribution of scores based on various entities such as location, department, designation and role can be obtained. Use the drop-down in the top-right corner to select the required entity. Detailed contribution of each entity and their contribution towards the overall score can be viewed by clicking on the specific entity's response rate.
- Comments and scores provided by respondents in survey are displayed in the comments section to identify popular keywords to understand key indicators, helping to gauge overall sentiment and identify areas for improvement.
Engagement Survey Reports
To view Engagement Survey reports:
- From home page, click Employee Engagement > Engagement Survey tab.
- Click the drop down and select Completed from the list.
A list of completed survey displayed. - Click on the survey for which you need to view the report.
The survey summary are listed on the details tab. - Click Reports tab to view survey reports.
- The overall statistics section tells you the total number of employees this survey was rolled out for and how many among them completed it, are in-progress and have not yet taken the survey. The overall response rate to this survey, the average rating given through star rating questions (if any) and the average eNPS score given through eNPS type questions (if any) will also be shown here.
- The Questions Summary tab lists the details of each question and provides graphical representations and a tabular section with the distribution of responses as a count and percentage. The overall rating for that question is also given below each question. Click View Detailed Report to get report insights on each question.
- The Insights tab provides analysis based on metrics (if chosen), keywords and comments. Comments are classified under Type as either positive, neutral or negative using Zia AI powered sentiment analysis.
- The Participant Details tab provides details of each respondent, such as the device they used and the total time spent completing the survey. A complete list of their responses to each question is also given in this tab, you can choose the required respondent to view their report.
- The Non-respondent tab shows the list of employees who have not yet responded to the survey. Here, you can also send reminder mails to help them complete the survey on time.
Pulse Survey Reports
- Survey Participation: A color-coded donut chart that indicates the participation in the survey using 3 colors. Green: Completed | Yellow: In-progress | Grey: Not-taken. The corresponding percentage and values are also indicated.
- Overall Score: A color-coded horizontal representation that displays the engagement score and a color-wise depiction of the favorable, neutral, and unfavorable responses (differentiated by color and size).
- Good scoring metrics: Of all the metrics included in the survey, this displays the better-performing metrics, i.e., the metrics that received positive responses.
- Question Summary:
- Question-wise stats: A color-coded horizontal question-wise representation of responses ranging from favorable to unfavorable. A bar chart view is also available, and the sorting can also be customized.
- Heatmap: To understand how the heatmap works, let us look at how it is calculated and depicted: All the metric groups are listed. Then, the responses received in the survey for each question in a particular category will be equated to a score between 1 and 10. For example, 3 questions with scores of 7, 8 and 9 associated with one metric would be indicated with a green color, and the average value will be displayed as 8 (or 80%) which indicates that the overall response was positive. The value can be viewed in reference to Department, Location, and Designation (switchable using the drop-down).
- Respondent Details:
- View the respondents (survey participants) list along with their answers.
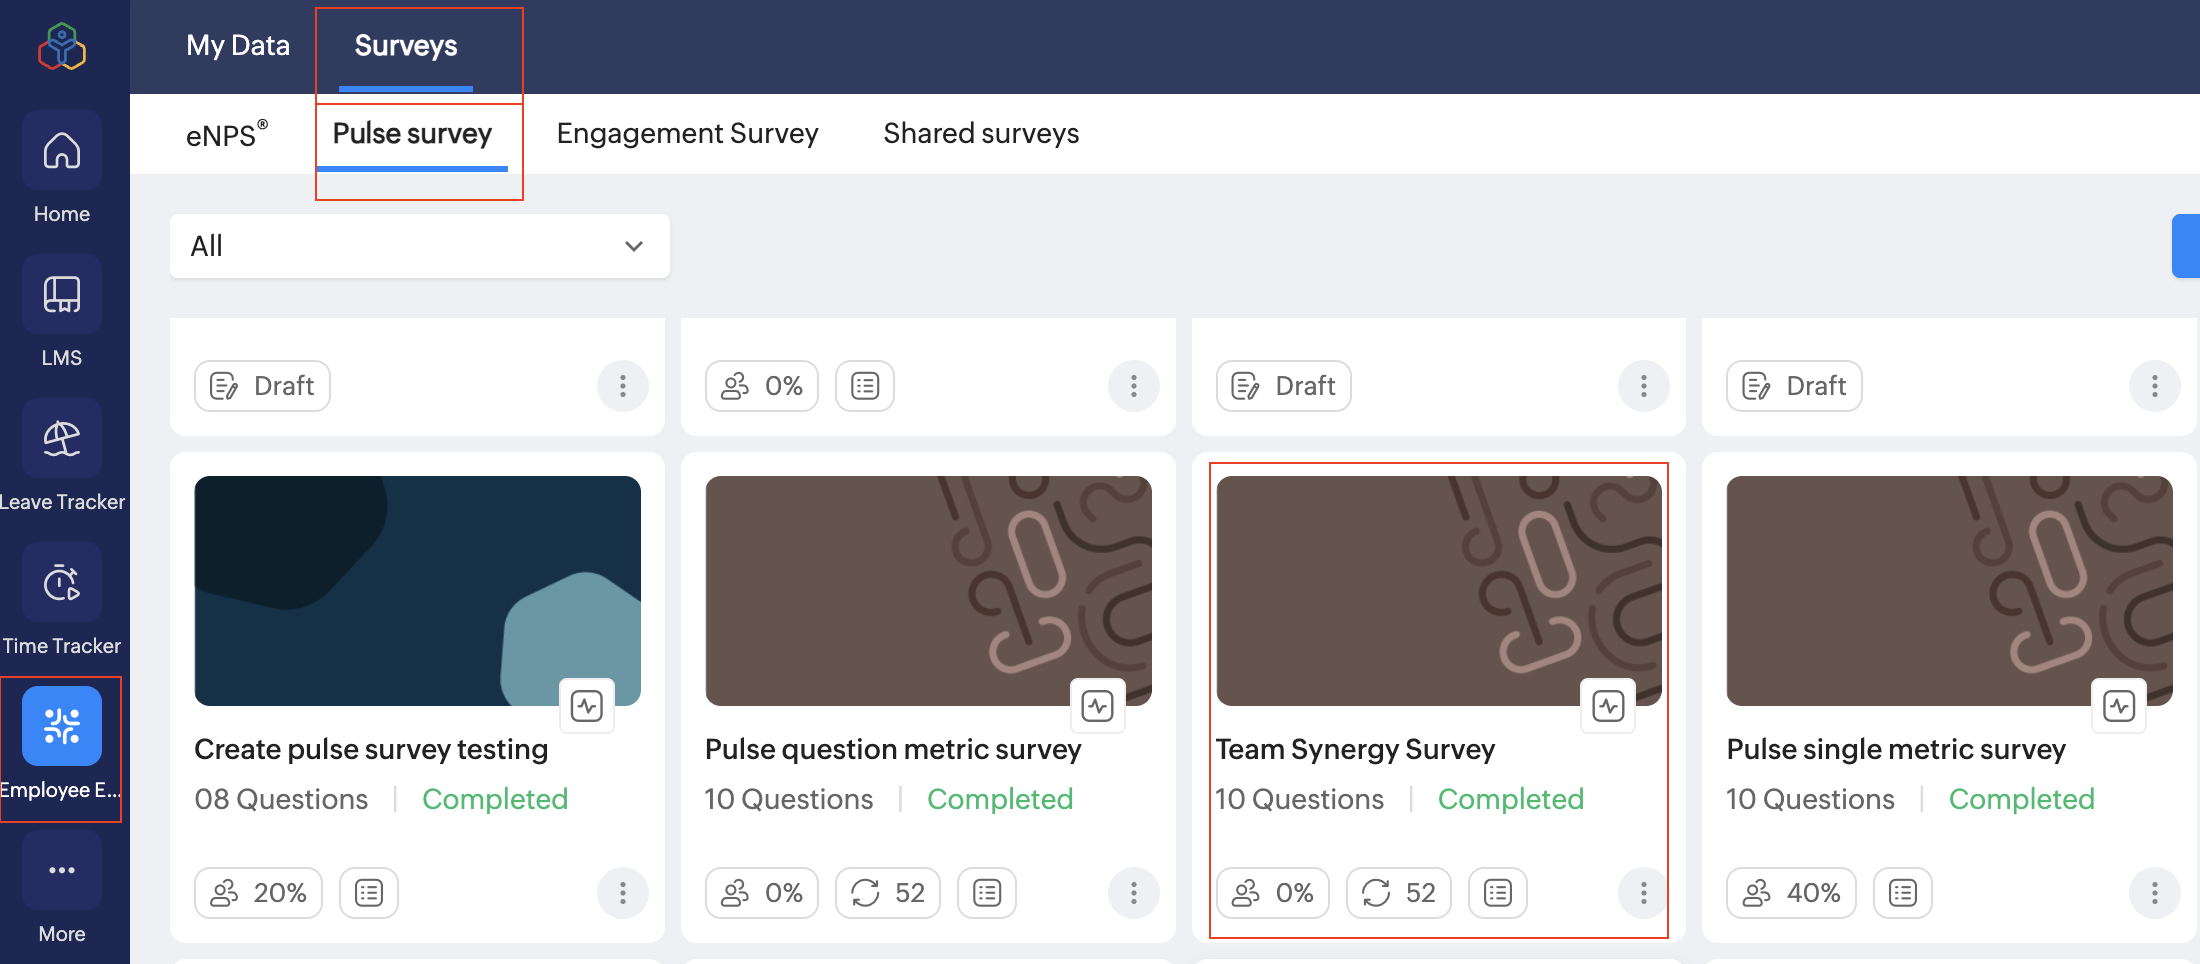
To follow up on a survey and to view reports, navigate to Employee Engagement > Surveys > Pulse Survey and select the corresponding survey.

In the survey card view, you can see details such as the number of questions in the survey, days remaining to complete the survey, response rate, current survey occurrence period, and survey details.
On selecting a survey, the survey updates page will be displayed.
INFO
If the survey ran for multiple instances, use the drop-down to switch to the required survey period.
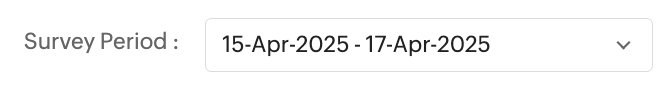
If the survey ran for multiple instances, use the drop-down to switch to the required survey period.
Here is a quick overview of what you can explore and perform in the Survey Updates page:
On scrolling below, you have two additional tabs, "Question Summary" and "Respondent Details." A heatmap is also available. Here is a quick overview of the mentioned sections:
Actions in Reports - Export | Share | Clone | Send Reminders
- Share Report: Use this option to share reports with other users.
- Clone: Create a clone of an existing survey (for example, with a few questions or applicability altered).
- Preview: Use this option to preview the survey from user perspective.
- Copy survey URL: View and copy the survey's direct access URL.
- Export: Export the survey in CSV, XLS, XLSX or PDF formats.
- Print: Print the survey report.
- Disable: Disable an active survey.
- Delete: Permanently removes the selected survey and all its associated data.
- Send Reminders: Send reminders from survey reports to notify employees who have not yet submitted their responses for completion.
Access to these features will be based on the configured permissions.
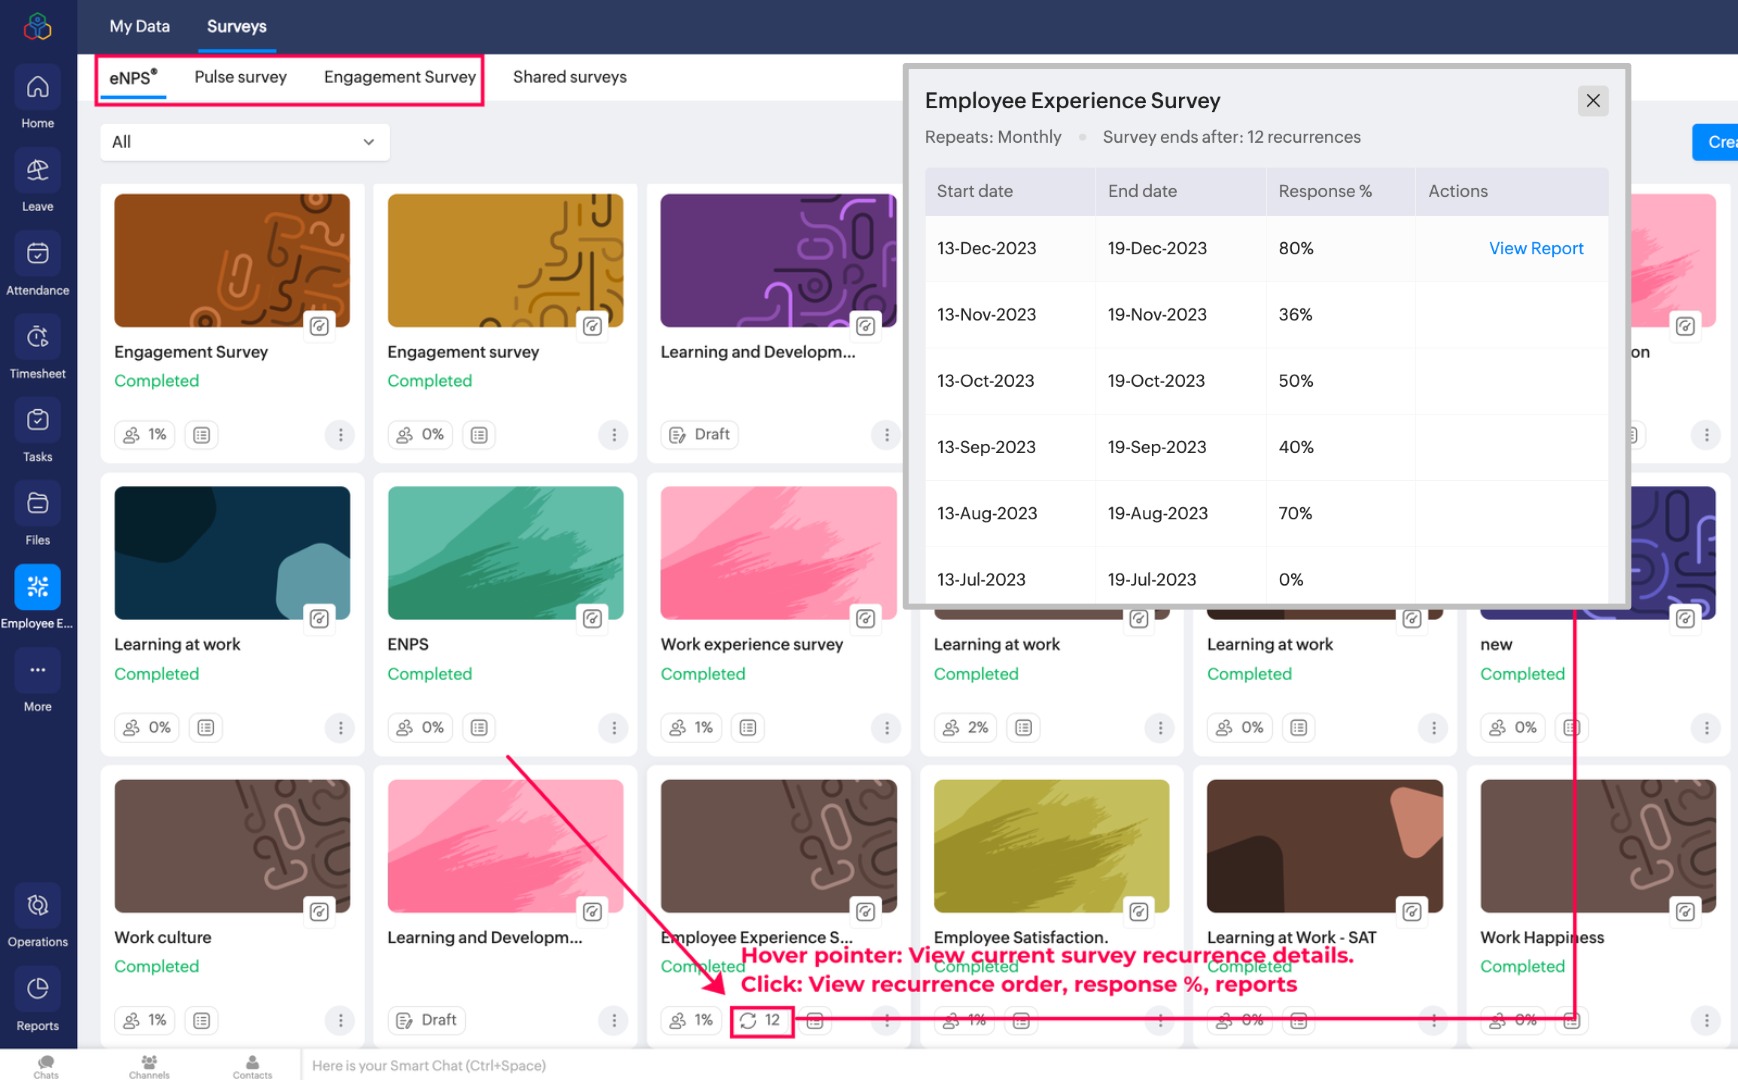
View Recurring Survey Time Line and Response Percentage
eNPS, Pulse, and Engagement surveys can be setup to run multiple times. You can view the recurrence order, response % and access corresponding reports directly, To view this option, click on the Recurrence icon ( ) .
) .
This option will be available for all recurring surveys and can be accessed from the Surveys tab in Employee Engagement service.
To access the recurring survey order, navigate to Employee Engagement > Surveys > eNPS / Pulse Survey / Engagement Survey tab.
View Recurrence Comparison Report for Survey Questions
This report is available only for Engagement and Pulse surveys with multiple recurrences.
The Recurrence Comparison Report helps compare response trends across different instances of recurring survey questions using a graphical chart. It allows users to analyze how response rates and average scores change over time for a selected question.
To view recurrence comparison for a question:
Navigate to Employee Engagement (left side tab) > Surveys, select Pulse or Engagement Survey.
Navigate to Employee Engagement (left side tab) > Surveys, select Pulse or Engagement Survey.
In the survey report, click the Question Summary tab and then click the Recurrence Comparison Report icon for the corresponding question to view the report.
The graph contains the following data series:
- Response Rate – Represents the percentage of responses received for each recurrence.
- Average Response Score – Represents the average score for the selected question across recurrences.