Visualize your data with a new set of charts: Treemap, Butterfly, Sankey, and Cluster charts in Zoho CRM
Dear customers,
When it comes to analytics, it's not just about the numbers; it's about understanding the story behind them.
With that philosophy in mind, we’re excited to introduce a line of representations to the existing array of chart types in Zoho CRM: Treemap, butterfly, sankey and cluster charts. Let's go!
Treemaps
Treemap charts are used to visually represent hierarchical datasets in a rectangular layout. It aligns its parent categories as larger tiles with their sub-categories nested within them. The size of each tile is proportional to its corresponding value, making it easy to compare different segments within the hierarchy.
This is how a treemap chart looks:

These structured data representations help you understand overall performance and contributions, as well as compare participating entities at a glance.
Unlike traditional bar charts or pie charts, treemaps can be used if your datasets are large and exhibit parent-child relationships.
Here are some examples to better understand their usage:
Comparing revenue distribution between functions
A company's revenue is distributed among its functions before it gets further disbursed to its employees. Treemap charts can be used to depict this distribution and compare it between functions. As you can see below, the hierarchy can be represented as a treemap to compare it directly with other functions:

The hierarchy at the top shows just the numbers and levels, but the treemap chart represents the numbers proportionally, allowing leaders to visualize the difference in distribution.
Interpretation: As you can easily see in the treemap, sales and marketing receive the same amount of revenue, while engineering is given significantly more than the other two.
Likewise, with treemap charts, you can:
- Compare popular lead sources with lead counts is the measure and lead source being the participating entity—a classic single-grouping configuration.
- View cost savings achieved across departments. With the departments as the grouping parameters and the cost saved as the measured amount, the chart lays out all the departments as tiles in proportion, based on money saved.
- Compare ad spends across channels, where channels are the parent grouping and ad spend is the measured unit.
Butterfly
Butterfly charts are used to compare two related datasets side-by-side, resulting in a representation that looks like a butterfly or tornado.
Now, how does it differ from bar charts?
The standard bar chart can compare two entities for a given measure. Say, you are comparing the performance of Mary and Charles. The two users' data is represented using bars, and the length will denote their performances. But, when it comes to comparing their performances over a period or their contribution across different stages, a bar chart is not sufficient.


With butterfly charts, you can:
- Compare revenue between two of your branches each month. With branches being compared for sum of sales revenue, grouped by closing date.
- Compare the performance of two reps in a given quarter. Compared between two users for average of amount of deals, grouped by closing date until today.
In addition to the user-based comparison above, butterfly charts are well-suited to visualizing other types of data comparisons, like:
- Picklist-based comparisons
- Duration-based comparisons
- Aggregate-based comparisons
Business scenario
Comparing the number of deals closed for each lead sources: Duration-based comparison
You can identify the productive lead source by comparing the number of deal closures for every lead source in your organization based on their closing week.

Analyzing effective sales methodology, inbound vs. outbound: Picklist-based comparison
Businesses use both inbound and outbound lead generation strategies, and each of these methods can reap different results based on the season and occasion. By comparing inbound versus outbound each month, you can identify which works best at what time.

Analyze the amount versus the expected revenue between accounts: Aggregate-based comparison
Expected revenue is a result of a deal's progression in the sales pipeline. Comparing the amount versus their expected revenue will not only help visualize the expected revenue of participating accounts but also indicate the accounts' stage in the sales pipeline.

Sankey
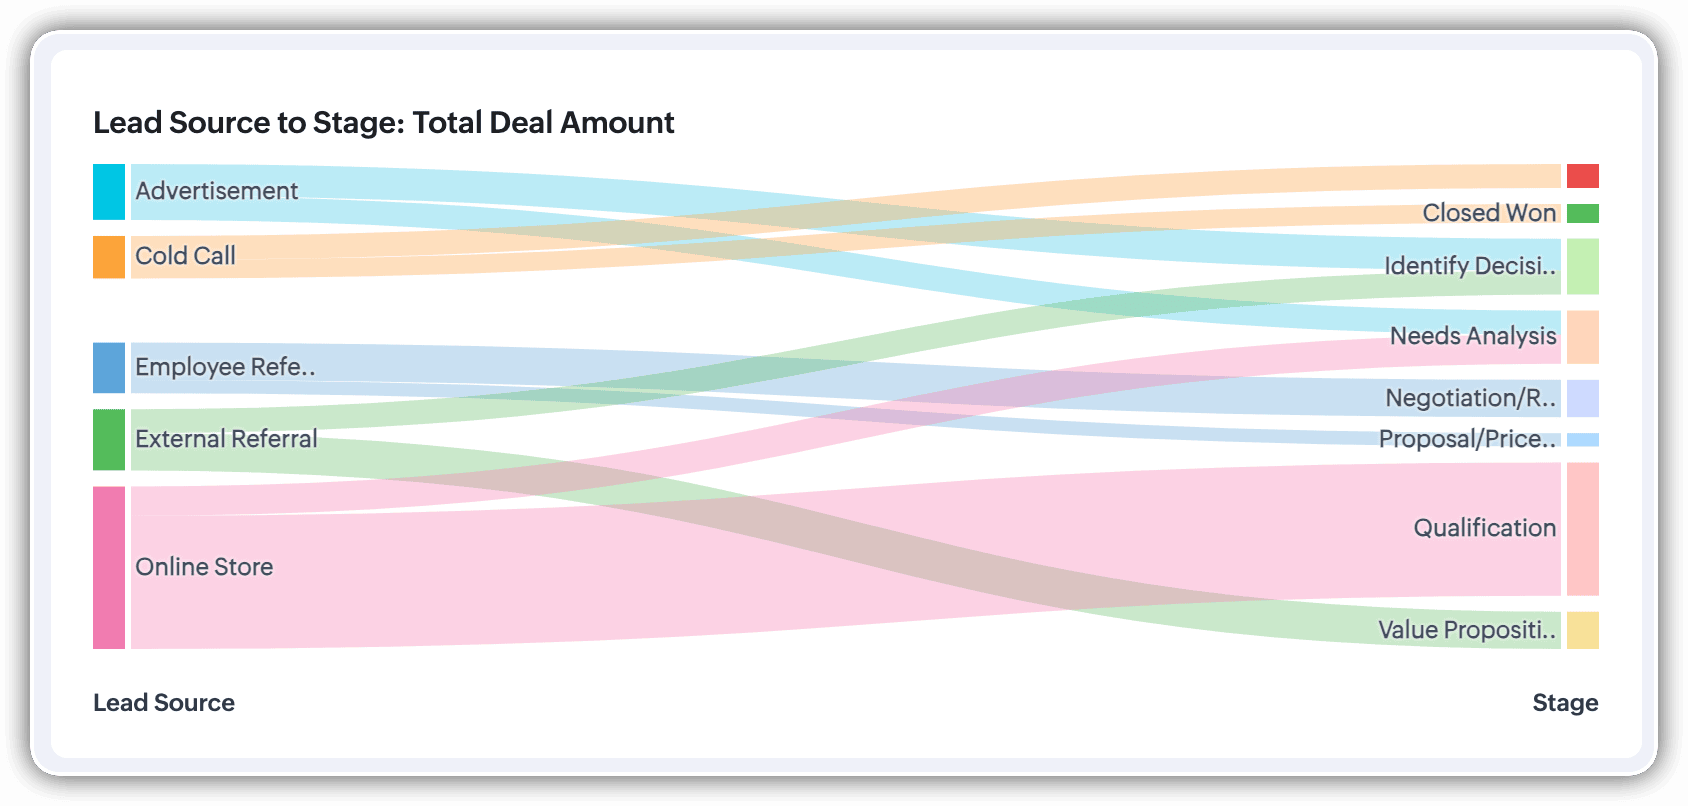
A Sankey Chart is designed to visualize the movement of data across different data groups. Unlike traditional charts—such as bar, column, pie, or donut—that mainly provide a static distribution of values, the Sankey Chart focuses on illustrating the flow between multiple segments or grouping fields. This makes it an ideal choice when you want to track how values (like lead counts, revenue, or deal statuses) move from one category to the next.

Key features
- Flow visualization: With the Sankey Chart, you can observe the movement of data between different groups.
- Multiple grouping fields: This chart works best when you have at least two grouping fields. You can go even further and add a third grouping to see an even more detailed mapping of your data flow.
- Simple configuration: The configuration for the Sankey Chart is as simple as any other chart type in Analytics.
Business scenarios:
Imagine you’re a sales manager trying to get a better handle on your team’s performance and your company’s pipeline. You want to understand not just how many deals are coming in, but also which sources are contributing the most value—and how those deals are progressing through different sales stages.
Let’s say you want to understand which lead sources are driving the most deal activity and how those deals progress through the pipeline. You can create a Sankey chart that maps the count of deals from Lead Source to Stage.

After analyzing the chart, you might notice that Online Store brings in a high volume of early-stage deals, while sources like External Referral contribute fewer deals that are more likely to reach advanced stages like Proposal or Negotiation.
This insight helps you prioritize nurturing the most profitable channels.
Sankey charts can also be helpful in other operational scenarios where understanding transitions across stages or teams is essential:
- Regional revenue distribution: Visualize how revenue flows across different regions, product categories, and their corresponding annual revenue. This helps you compare which regions contribute the most to each product line and where your high-value segments lie.
- Ticket handling flow: Visualize the flow of support tickets from their origin channel to internal departments and finally to resolution statuses. This can reveal workload imbalances or common points of delay in your support process.
Cluster
A cluster chart is similar to stacked column charts, but instead of stacking horizontally, the data is represented as vertical bars. As you create a column chart with multiple groupings, you can change the type of column chart to a cluster chart to achieve this representation.

In the above image, you can see the stacked column chart compares the number of lead conversions based on popular sources between countries. The stacks appearing on top of existing stacks ask you to calibrate the record count (y-axis) based on the previous stacks, which can lead to inaccurate interpretations. In this case, a cluster representation will paint a clearer picture of the analyses.
Other minor enhancements:
In addition to the three charts we mentioned above, we've also made the following minor changes:
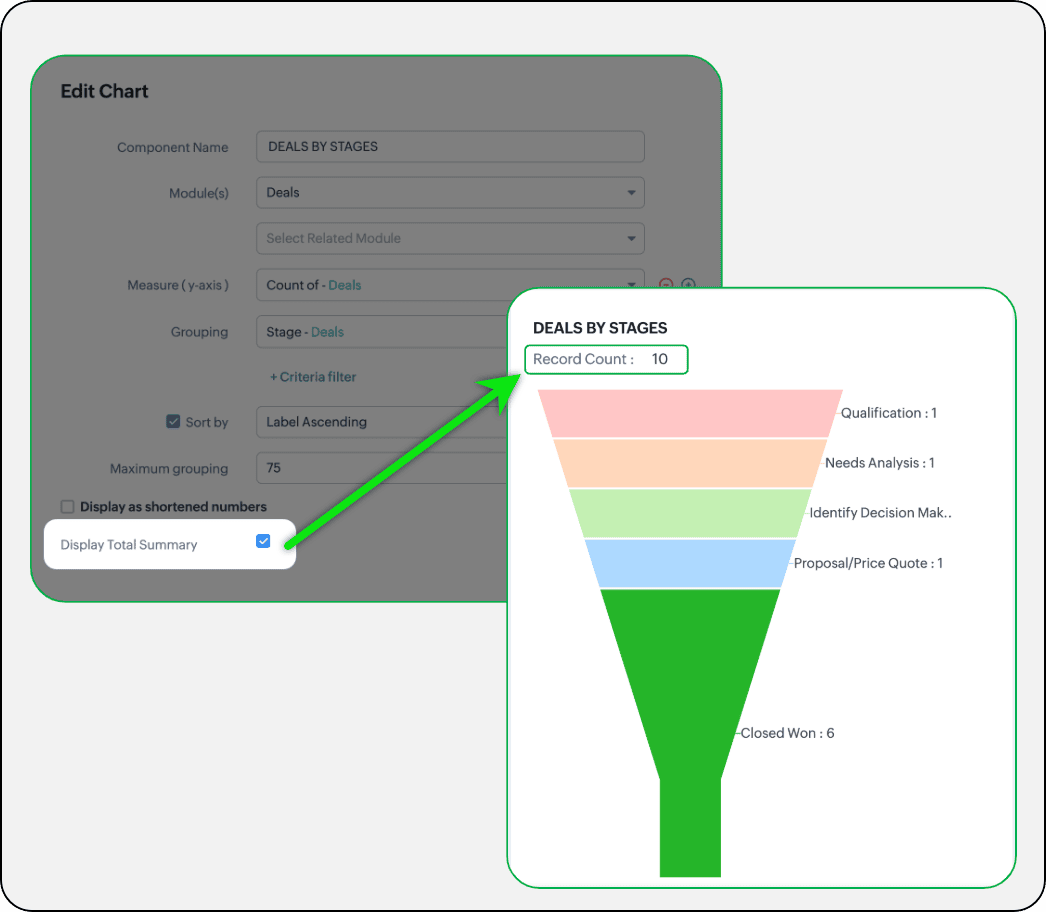
- Display total summary: Thus far, for all charts, each participating measure included labels. Now, to better understand overall contributions, a check box to display the total summary is provided under More options on the Chart Configuration page. Based on the configuration, the total revenue or the rolled-up quantities will be prominently displayed.
- Merge Y-axis: For charts that use two y-axis measurements, the intention is to view the progression of one entity against these two measures. Despite the scale, if the y-axis on the left is disproportionate to the values of the y-axis on the right, the plotted graph will result in a graphically and logically incorrect representation.
As you can see in the image below, the plot area of the sum of amount bar and the sum of expected revenue aligns close together, while, the difference between $700,000 and $40,500 is drastic, creating inaccurate interpretations.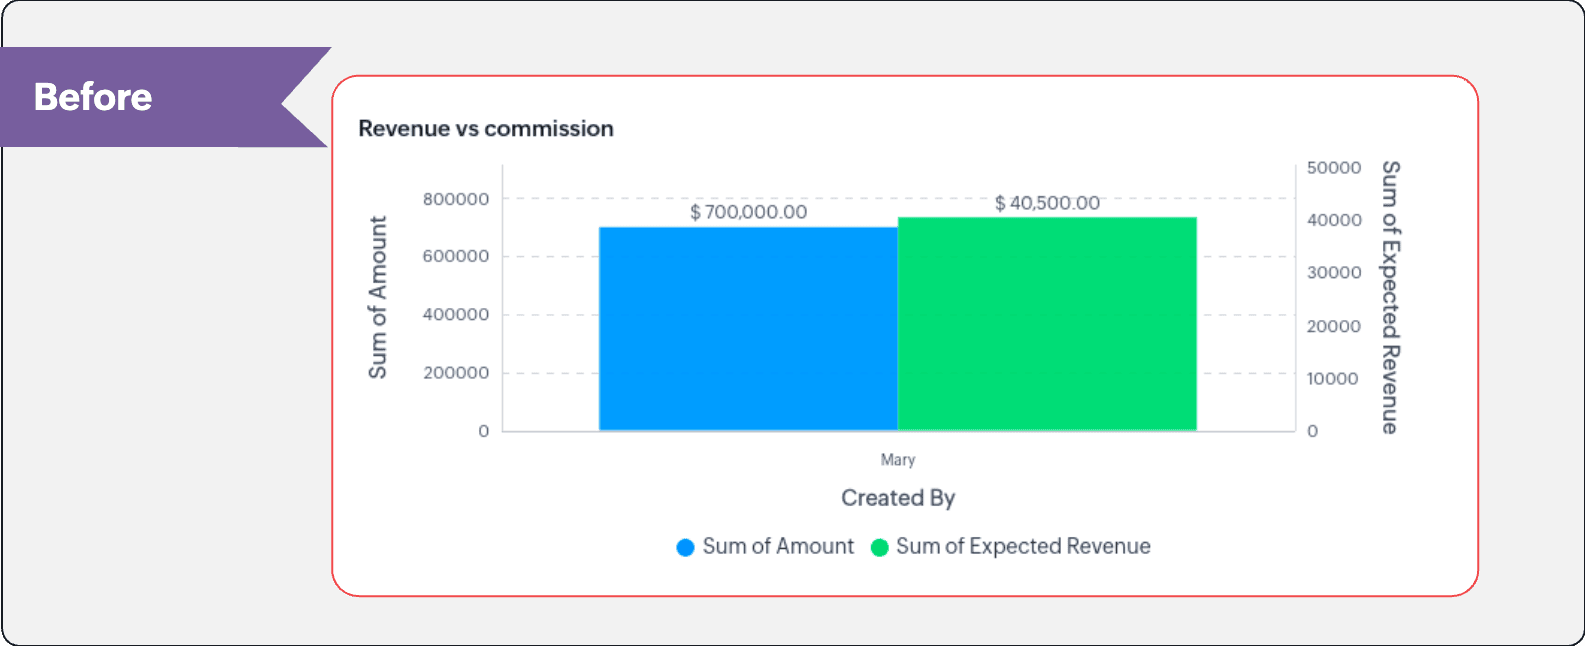
In this enhancement, we're allowing neighboring values of measures to merge so that the interpretation can be more visually accurate.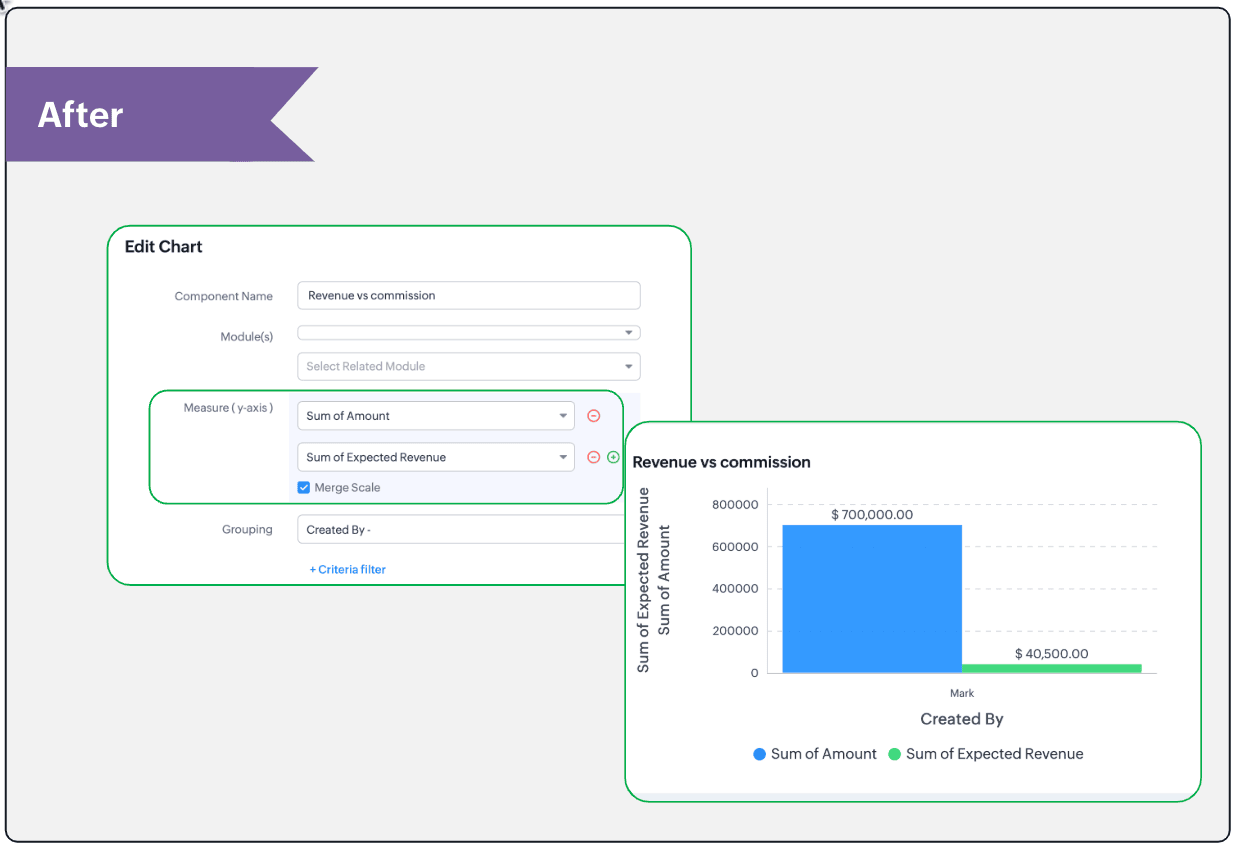
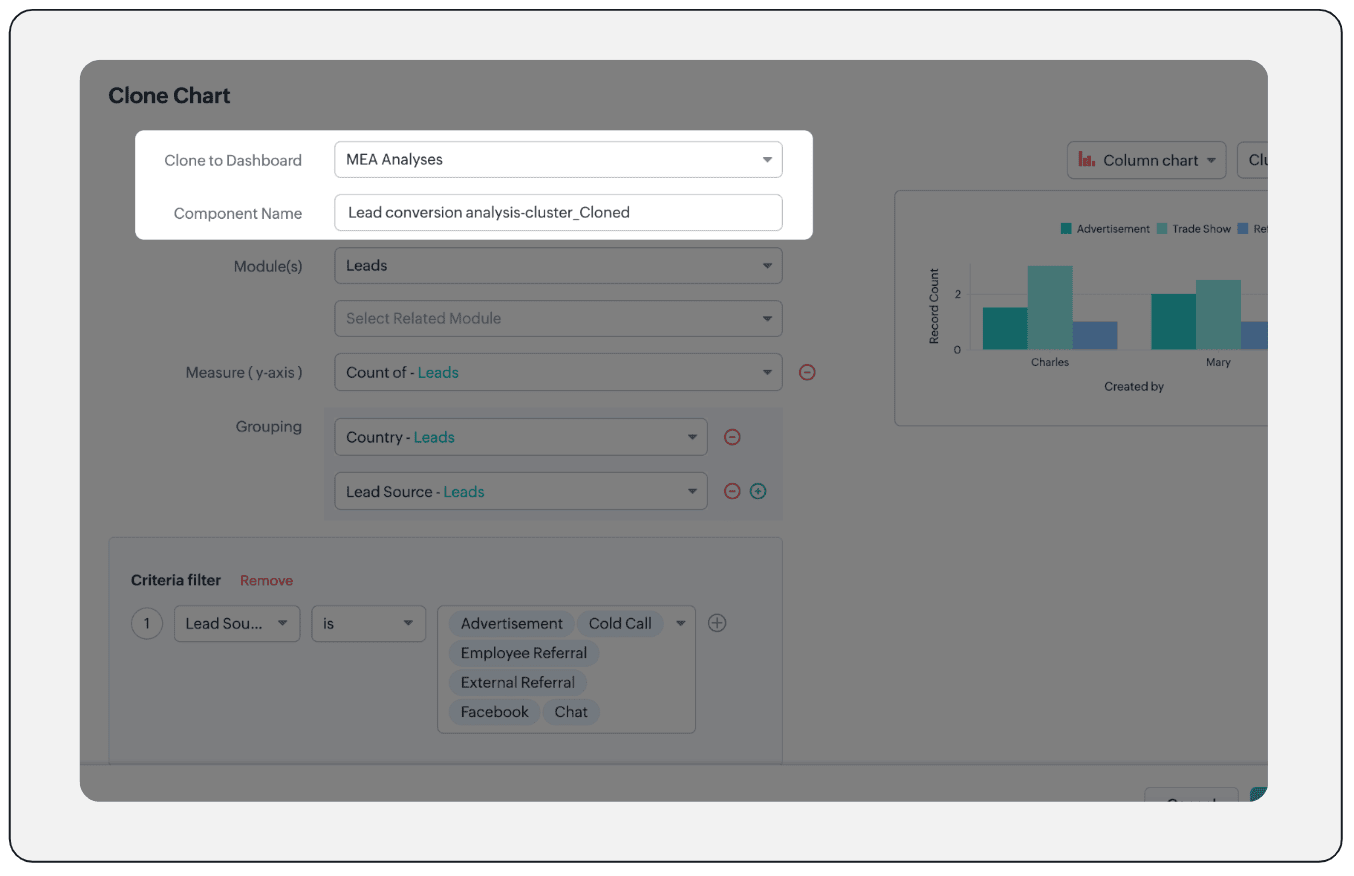
- Clone components to a different dashboard: Dashboards in Analytics serve in unique ways for various audiences—there can be separate dashboards for the sales team, marketing team, engineering team, and so on, and the chances of using the same measure for reference is common. Thus, when you clone a chart, you can now determine the target dashboard in which the cloned chart can be placed.
Resource: Help document
Thanks and have a good one!
Kind regards,
Saranya Balasubramanian
Saranya Balasubramanian
Topic Participants
Saranya Balasubramanian
Sticky Posts
Enhancements to the formula field in Zoho CRM: Auto-refresh formulas with the "Now" function, stop formula executions based on criteria, and include formulas within formulas
Dear Customers, We hope you're well! By their nature, modern businesses rely every day on computations, whether it's to calculate the price of a product, assess ROI, evaluate the lifetime value of a customer, or even determine the age of a record. WithElevate your CX delivery using CommandCenter 2.0: Simplified builder; seamless orchestration
Most businesses want to create memorable customer experiences—but they often find it hard to keep them smooth, especially as they grow. To achieve a state of flow across their processes, teams often stitch together a series of automations using WorkflowPresenting ABM for Zoho CRM: Expand and retain your customers with precision
Picture this scenario: You're a growing SaaS company ready to launch a powerful business suite, and are looking to gain traction and momentum. But as a business with a tight budget, you know acquiring new customers is slow, expensive, and often deliversNimble enhancements to WhatsApp for Business integration in Zoho CRM: Enjoy context and clarity in business messaging
Dear Customers, We hope you're well! WhatsApp for business is a renowned business messaging platform that takes your business closer to your customers; it gives your business the power of personalized outreach. Using the WhatsApp for Business integrationZoho CRM: Sales Rep Professional Certification Program on Coursera
We are happy to share that we have published the Zoho Sales Representative Professional Certificate in partnership with Coursera, a leading platform for online learning and career development that offers access to courses and degrees from leading universities
Recent Topics
mask Customer phone number and agents cant see customer phone number
Is there any way we can integrate Zoom Phone with Zoho CRM while ensuring that customer phone numbers remain masked? We need a solution where agents can make outbound calls but cannot see customer phone numbers. Please let us know if there is any solutionEmail Reminders on Shared Calendars
How do we turn off the setting that emails reminders to everyone who has accepted or declined a calendar invite? If 8 of us have been invited to the same meeting, we receive 8 notifications for every step of the process, from invitation to decision.WebDAV / FTP / SFTP protocols for syncing
I believe the Zoho for Desktop app is built using a proprietary protocol. For the growing number of people using services such as odrive to sync multiple accounts from various providers (Google, Dropbox, Box, OneDrive, etc.) it would be really helpful if you implemented standard protocols such as WebDAV / FTP / SFTP so that alternative inc clients can be used.What's New in Zoho Inventory | Q2 2025
Hello Customers, The second quarter have been exciting months for Zoho Inventory! We’ve introduced impactful new features and enhancements to help you manage inventory operations with even greater precision and control. While we have many more excitingHow to refresh a ticket view ?
I am doing a widget where I send a rest api call to make a new draft to the ticket I am viewing. The issue is sometimes it refresh a ticket view and I can see inserted draft right away, but sometimes I do not see it even if it is inserted correctly andUgh! - Text Box (Single Line) Not Enough - Text Box (Multi-line) Unavailable in PDF!
I provide services, I do not sell items. In each estimate I send I provide a customized job description. A two or three sentence summary of the job to be performed. I need to be able to include this job description on each estimate I send as it's a criticalMerge Items
Is there a work around for merging items? We currently have three names for one item, all have had a transaction associated so there is no deleting (just deactivating, which doesn't really help. It still appears so people are continuing to use it). I also can't assign inventory tracking to items used in past transactions, which I don't understand, this is an important feature moving forward.. It would be nice to merge into one item and be able to track inventory. Let me know if this is possible.Supervisor Rules - Zoho Desk
Hi, I have set up a Supervisor Rule in Zoho Desk to send an email alert when a ticket has been on hold for 48 hours. Is there a way to change it so that the alert only sends once and not on an hourly basis? Thank you LauraResponseCode 421, 4.7.0 [TSS04] Messages from 136.143.188.51 temporarily deferred due to user complaints
Had email bounce. Let me know if you can fix this. Thanks. MichaelAutomation #15: Automatically Adding Static Secondary Contacts
Rockel is a top-tier client of Zylker traders. Marcus handles communications with Rockel and would like to add Terence, the CTO of Zylker traders to the email conversations. In this case, the emails coming from user address rockel.com should have TerenceNew Zoho triggers Google Dangerous flag due toabnormal charcters
Just signed up and doing my first email test. I sent it to my google email account but it got flagged as Dangerous" due abnormal characters. My DNS setup looks ok. Page snips attached Help Please Thanks, Rick DC PowerWorldIs there a API to fetch tasks in a Board/Section
I am writing a scheduled function that retrieves all the tasks and send an reminder on cliq. I cannot seem to find a API to fetch tasks (by user / board / section) What are the way to fetch tasks?Having trouble fetching contents of Zoho Connect Feeds using the API, requesting alternative API documentation.
I'm trying to retrieve feed/post data from Zoho Connect using the API but facing challenges with the current documentation. What I've tried: OAuth authentication is working correctly (getting 200 OK responses) Tested multiple endpoints: /pulse/nativeapi/v2/feeds,Adding an Account Name to Tasks/Reminders
Does anyone know how to add the related account name to a task? When we look at the list of activities and when the reminders pop up, there is no way of quickly seeing who the account is.Triggering Zoho Flow on Workdrive File Label
Right now Im trying to have a zoho flow trigger on the labeling/classification of a file in a folder. Looking at the trigger options they arent great for something like this. File event occurred is probably the most applicable, but the events it has arentSendMail to multiple recipients
Hi, I'm trying to send an email to a list of recipients. Right now the "to" field is directed to a string variable. (List variables won't work here). In the string variable, how can I make it work? trying "user@app.com;user2@app.com" or "user@app.com; user2@app.com" just failed to send the emails. RavidPopulate drop down field from another form's subform
Hello, I found how to do that, but not in case of a subform. I have a Product form that has a subform for unit and prices. A product might have more than one unit. For example, the product "Brocoli" can be sold in unit at 3$ or in box of 10 at 25 $. BothUsar o Inventory ou módulo customizado no CRM para Gestão de Estoque ?
Minha maior dor hoje em usar o zoho é a gestão do meu estoque. Sou uma empresa de varejo e essa gestão é fundamental pra mim. Obviamente preciso que esse estoque seja visível no CRM, Inicialmente fiz através de módulos personalizados no próprio Zoho CRM,Signup forms behaviour : Same email & multiple submissions
My use case is that I have a signup form (FormA) that I use in several places on my website, with a hidden field so I can see where the contact has been made from. I also have a couple of other signup forms (FormB and FormC) that slight differences. Allgetting error in project users api
Hello, I'm getting a "Given URL is wrong" error when trying to use the Zoho Projects V3 API endpoint for adding users to a project. The URL I'm using is https://projectsapi.zoho.com/api/v3/portal/{portalid}/projects/{projectid}/projectusers/ and it'sChange total display format in weekly time logs
Hi! Would it be possible to display the total of the value entered in the weekly time log in the same format that the user input? This could be an option in the general settings -> display daily timesheet total in XX.XX format or XX:XX.Different Company Name for billing & shipping address
We are using Zoho Books & Inventory for our Logistics and started to realize soon, that Zoho is not offering a dedicated field for a shipping address company name .. when we are creating carrier shipping labels, the Billing Address company name gets alwaysHow to display historical ticket information of the total time spent in each status
Hi All, Hoping someone can help me, as I am new to Zoho Analytics, and I am a little stuck. I am looking to create a bar chart that looks back over tickets raised in the previous month and displays how much time was spent in each status (With Customer,Zoho Projects iOS app update: Global Web Tabs support
Hello everyone! In the latest version(v3.10.10) of the Zoho Projects app update, we have brought in support for Global Web Tabs. You can now access the web tabs across all the projects from the Home module of the app. Please update the app to the latestZoho Community Weekend Maintenance: 13–15 Sep 2025
Hi everyone, We wanted to give you a heads-up that Zoho Community will undergo scheduled maintenance this weekend. During this period, some community features will be temporarily unavailable, while others will be in read-only mode. Maintenance Window:Agent Performance Report
From data to decisions: A deep dive into ticketing system reports An agent performance report in a ticketing system provides a comprehensive view of how support agents manage customer tickets. It measures efficiency and quality by tracking key performanceShow both Vendor and Customers in contact statement
Dear Sir, some companies like us working with companies as Vendor and Customers too !!! it mean we send invoice and also receive bill from them , so we need our all amount in one place , but in contact statement , is separate it as Vendor and Customer,Pourquoi dans zohobooks version gratuite on ne peut ajouter notre stock d'ouverture??
Pourquoi dans zohobooks version gratuite on ne peut ajouter notre stock d'ouverture ??How can I adjust column width in Zoho Books?
One issue I keep running into is as I show or hide columns in reports, the column widths get weird. Some columns have text cut off while others can take a fourth of the page for just a few characters. I checked report layout guides and my settings, butInvalid value passed for file_name
System generated file name does not send file anymore - what is the problem?Custom Function for Estimates
Hey everyone, I was wondering if there was a way to automate the Subject of an estimate whenever one is created or edited: * the green box using following infos: * Customer Name and Estimate Date. My Goal is to change the Subject to have this format "<MyFirm>-EstimateThis domain is not allowed to add. Please contact support-as@zohocorp.com for further details
I am trying to setup the free version of Zoho Mail. When I tried to add my domain, theselfreunion.com I got the error message that is the subject of this Topic. I've read your other community forum topics, and this is NOT a free domain. So what is theSearch in module lists has detiorated
Every module has a problem with the search function :-/YouTube Live #1: AI-powered agreement management with Zia and Zoho Sign
Hi there! We're excited to announce Zoho Sign’s first YouTube live series, where you can catch the latest updates and interact with our Zoho Sign experts, pose questions, and discover lesser-known features. We're starting off by riding the AI wave inSearch in module lists has detiorated
Every module has a problem with the search function :-/Sales Receipts Duplicating when I run reports why and how do we rectify this and any other report if this happens
find attached extract of my reportAdd Zoho Forms to Zoho CRM Plus bundle
Great Zoho apps like CRM and Desk have very limited form builders when it comes to form and field rules, design, integration and deployment options. Many of my clients who use Zoho CRM Plus often hit limitations with the built in forms in CRM or Desk and are then disappointed to hear that they have to additionally pay for Zoho Forms to get all these great forms functionalities. Please consider adding Zoho Forms in the Zoho CRM Plus bundle. Best regards, Mladen Svraka Zoho Certified Consultant andBigin: filter Contacts by Company fields
Hello, I was wondering if there's a way to filter the contacts based on a field belonging to their company. I.e.: - filter contacts by Company Annual Revenue field - filter contacts by Company Employee No. field In case this is not possibile, what workaroundHas Zoho changed the way it searches Items?
Right now all of our searches have broken and we can no longer search using the SKU or alias. It was fine last night and we came in this morning to broken.....this is impacting our operations now.Refunds do not export from Shopify, Amazon and Esty to Zoho. And then do not go from Zoho inventory to Quickbooks.
I have a huge hole in my accounts from refunds and the lack of synchronisation between shopify , Amazon and Etsy to Zoho ( i.e when I process a refund on shopify/ Amazon or Etsy it does not come through to Zoho) and then if I process a manual credit note/Next Page