Visualize your data with a new set of charts: Treemap, Butterfly, Sankey, and Cluster charts in Zoho CRM
Dear customers,
When it comes to analytics, it's not just about the numbers; it's about understanding the story behind them.
With that philosophy in mind, we’re excited to introduce a line of representations to the existing array of chart types in Zoho CRM: Treemap, butterfly, sankey and cluster charts. Let's go!
Treemaps
Treemap charts are used to visually represent hierarchical datasets in a rectangular layout. It aligns its parent categories as larger tiles with their sub-categories nested within them. The size of each tile is proportional to its corresponding value, making it easy to compare different segments within the hierarchy.
This is how a treemap chart looks:

These structured data representations help you understand overall performance and contributions, as well as compare participating entities at a glance.
Unlike traditional bar charts or pie charts, treemaps can be used if your datasets are large and exhibit parent-child relationships.
Here are some examples to better understand their usage:
Comparing revenue distribution between functions
A company's revenue is distributed among its functions before it gets further disbursed to its employees. Treemap charts can be used to depict this distribution and compare it between functions. As you can see below, the hierarchy can be represented as a treemap to compare it directly with other functions:

The hierarchy at the top shows just the numbers and levels, but the treemap chart represents the numbers proportionally, allowing leaders to visualize the difference in distribution.
Interpretation: As you can easily see in the treemap, sales and marketing receive the same amount of revenue, while engineering is given significantly more than the other two.
Likewise, with treemap charts, you can:
- Compare popular lead sources with lead counts is the measure and lead source being the participating entity—a classic single-grouping configuration.
- View cost savings achieved across departments. With the departments as the grouping parameters and the cost saved as the measured amount, the chart lays out all the departments as tiles in proportion, based on money saved.
- Compare ad spends across channels, where channels are the parent grouping and ad spend is the measured unit.
Butterfly
Butterfly charts are used to compare two related datasets side-by-side, resulting in a representation that looks like a butterfly or tornado.
Now, how does it differ from bar charts?
The standard bar chart can compare two entities for a given measure. Say, you are comparing the performance of Mary and Charles. The two users' data is represented using bars, and the length will denote their performances. But, when it comes to comparing their performances over a period or their contribution across different stages, a bar chart is not sufficient.


With butterfly charts, you can:
- Compare revenue between two of your branches each month. With branches being compared for sum of sales revenue, grouped by closing date.
- Compare the performance of two reps in a given quarter. Compared between two users for average of amount of deals, grouped by closing date until today.
In addition to the user-based comparison above, butterfly charts are well-suited to visualizing other types of data comparisons, like:
- Picklist-based comparisons
- Duration-based comparisons
- Aggregate-based comparisons
Business scenario
Comparing the number of deals closed for each lead sources: Duration-based comparison
You can identify the productive lead source by comparing the number of deal closures for every lead source in your organization based on their closing week.

Analyzing effective sales methodology, inbound vs. outbound: Picklist-based comparison
Businesses use both inbound and outbound lead generation strategies, and each of these methods can reap different results based on the season and occasion. By comparing inbound versus outbound each month, you can identify which works best at what time.

Analyze the amount versus the expected revenue between accounts: Aggregate-based comparison
Expected revenue is a result of a deal's progression in the sales pipeline. Comparing the amount versus their expected revenue will not only help visualize the expected revenue of participating accounts but also indicate the accounts' stage in the sales pipeline.

Sankey
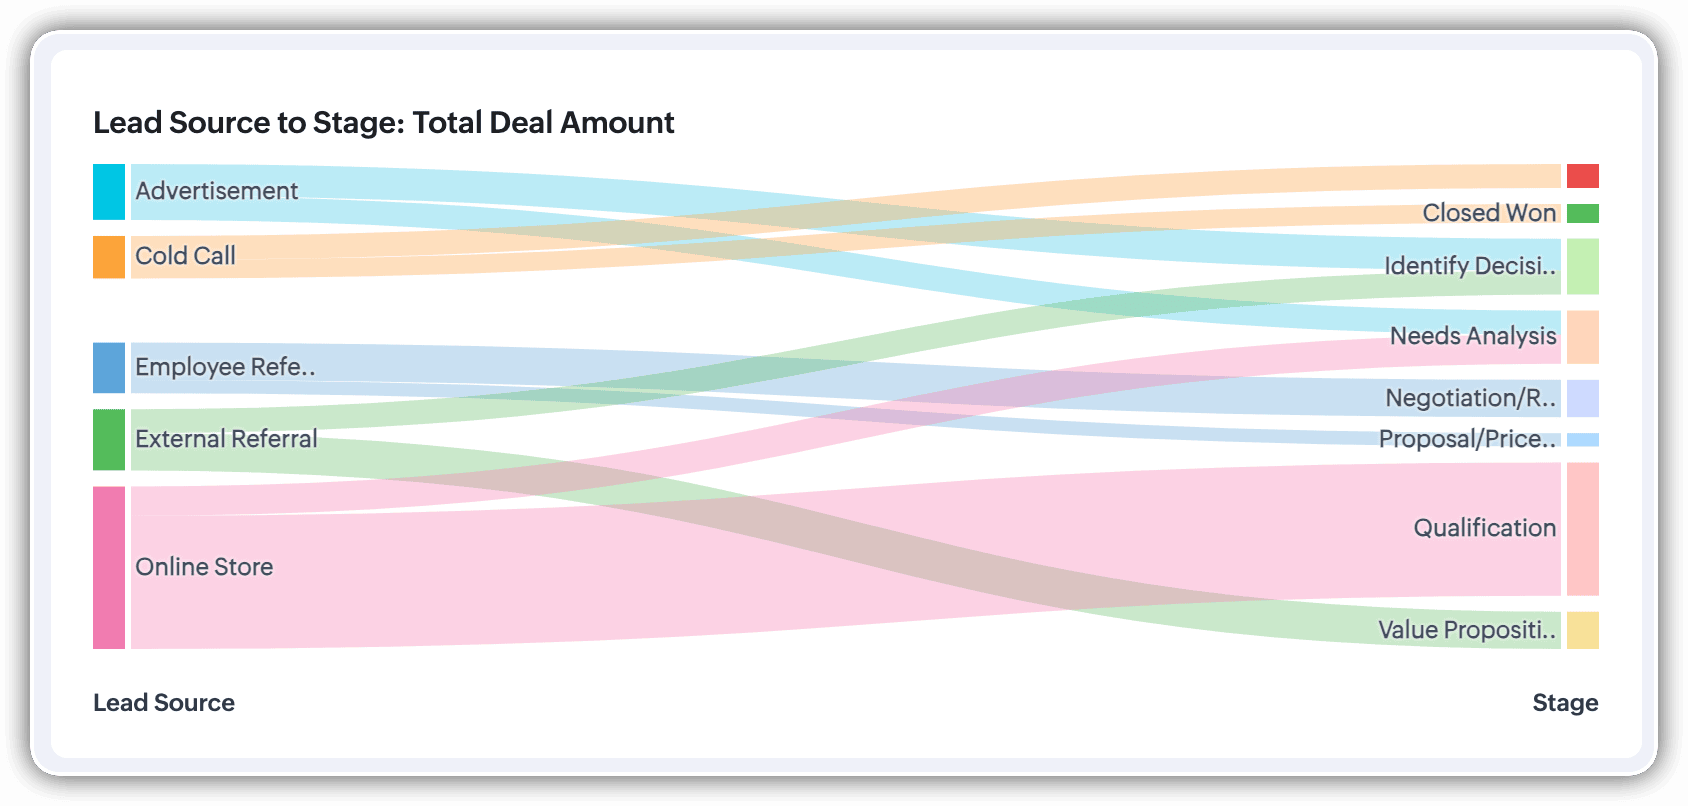
A Sankey Chart is designed to visualize the movement of data across different data groups. Unlike traditional charts—such as bar, column, pie, or donut—that mainly provide a static distribution of values, the Sankey Chart focuses on illustrating the flow between multiple segments or grouping fields. This makes it an ideal choice when you want to track how values (like lead counts, revenue, or deal statuses) move from one category to the next.

Key features
- Flow visualization: With the Sankey Chart, you can observe the movement of data between different groups.
- Multiple grouping fields: This chart works best when you have at least two grouping fields. You can go even further and add a third grouping to see an even more detailed mapping of your data flow.
- Simple configuration: The configuration for the Sankey Chart is as simple as any other chart type in Analytics.
Business scenarios:
Imagine you’re a sales manager trying to get a better handle on your team’s performance and your company’s pipeline. You want to understand not just how many deals are coming in, but also which sources are contributing the most value—and how those deals are progressing through different sales stages.
Let’s say you want to understand which lead sources are driving the most deal activity and how those deals progress through the pipeline. You can create a Sankey chart that maps the count of deals from Lead Source to Stage.

After analyzing the chart, you might notice that Online Store brings in a high volume of early-stage deals, while sources like External Referral contribute fewer deals that are more likely to reach advanced stages like Proposal or Negotiation.
This insight helps you prioritize nurturing the most profitable channels.
Sankey charts can also be helpful in other operational scenarios where understanding transitions across stages or teams is essential:
- Regional revenue distribution: Visualize how revenue flows across different regions, product categories, and their corresponding annual revenue. This helps you compare which regions contribute the most to each product line and where your high-value segments lie.
- Ticket handling flow: Visualize the flow of support tickets from their origin channel to internal departments and finally to resolution statuses. This can reveal workload imbalances or common points of delay in your support process.
Cluster
A cluster chart is similar to stacked column charts, but instead of stacking horizontally, the data is represented as vertical bars. As you create a column chart with multiple groupings, you can change the type of column chart to a cluster chart to achieve this representation.

In the above image, you can see the stacked column chart compares the number of lead conversions based on popular sources between countries. The stacks appearing on top of existing stacks ask you to calibrate the record count (y-axis) based on the previous stacks, which can lead to inaccurate interpretations. In this case, a cluster representation will paint a clearer picture of the analyses.
Other minor enhancements:
In addition to the three charts we mentioned above, we've also made the following minor changes:
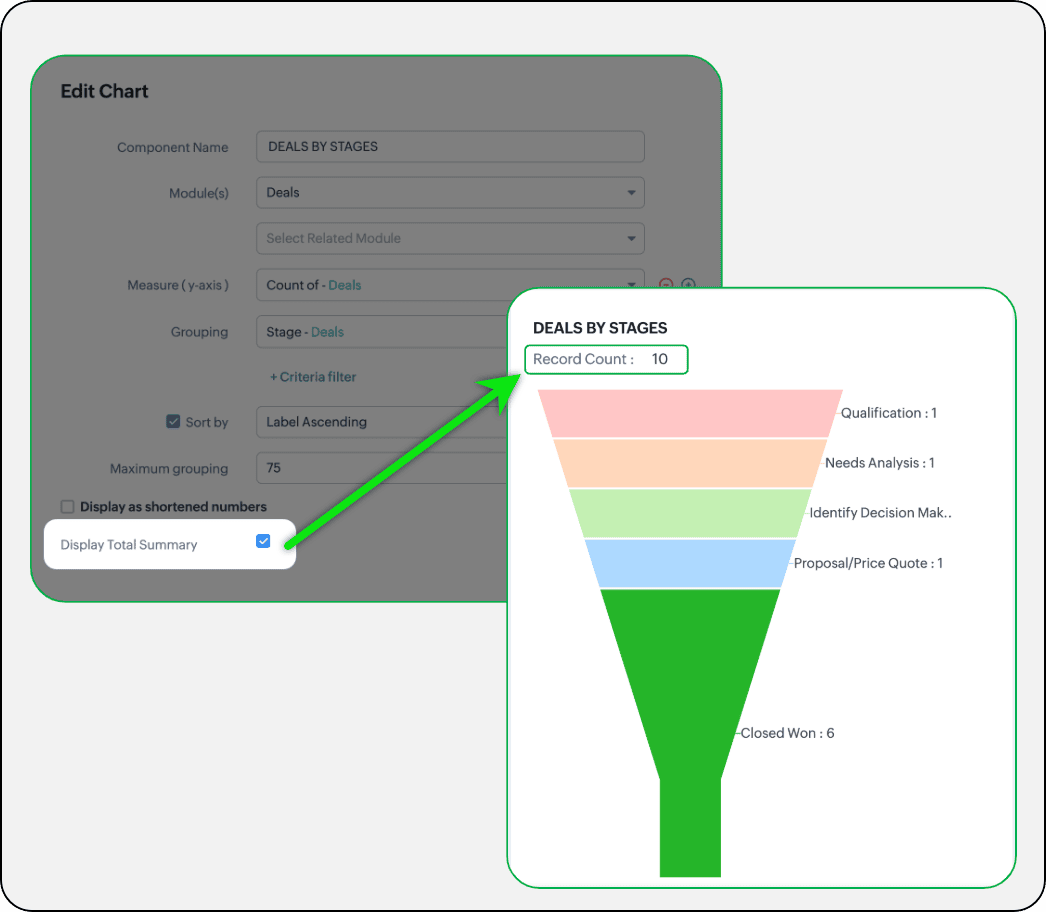
- Display total summary: Thus far, for all charts, each participating measure included labels. Now, to better understand overall contributions, a check box to display the total summary is provided under More options on the Chart Configuration page. Based on the configuration, the total revenue or the rolled-up quantities will be prominently displayed.
- Merge Y-axis: For charts that use two y-axis measurements, the intention is to view the progression of one entity against these two measures. Despite the scale, if the y-axis on the left is disproportionate to the values of the y-axis on the right, the plotted graph will result in a graphically and logically incorrect representation.
As you can see in the image below, the plot area of the sum of amount bar and the sum of expected revenue aligns close together, while, the difference between $700,000 and $40,500 is drastic, creating inaccurate interpretations.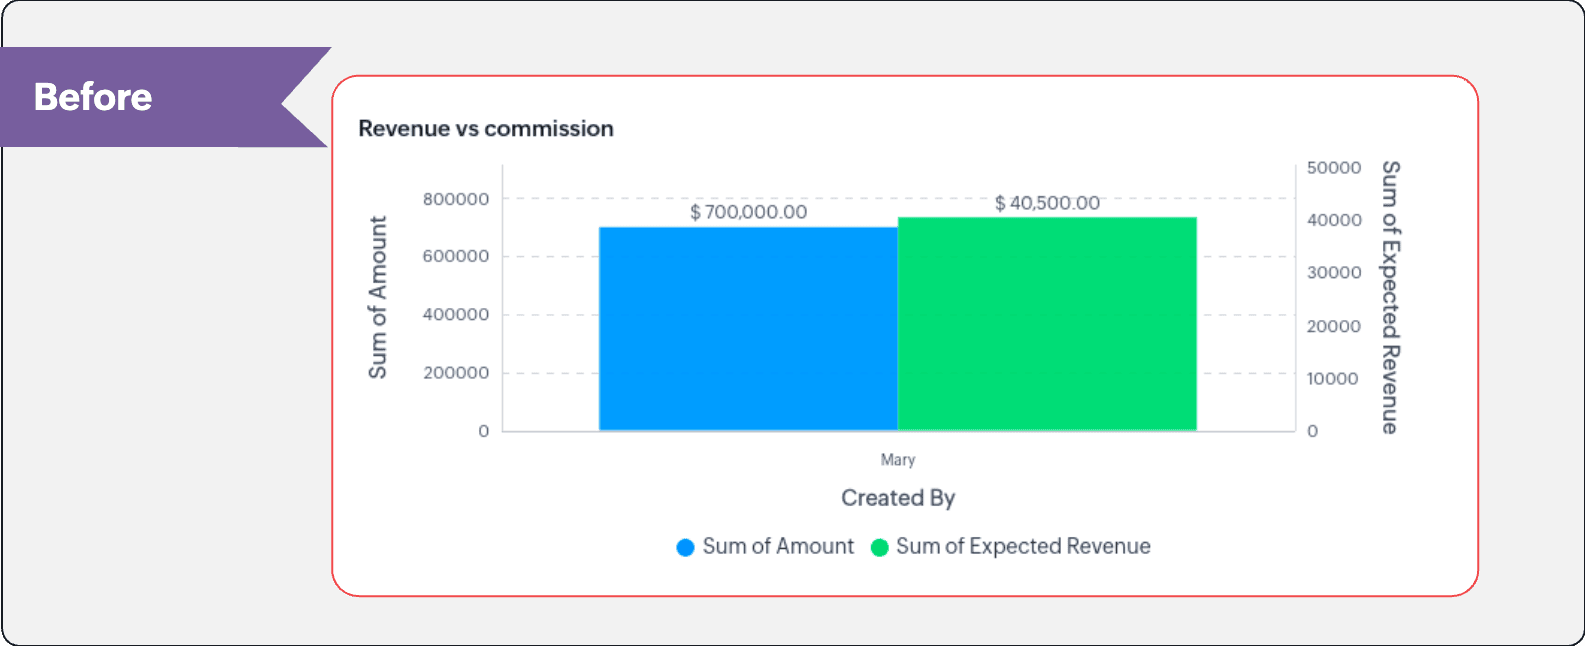
In this enhancement, we're allowing neighboring values of measures to merge so that the interpretation can be more visually accurate.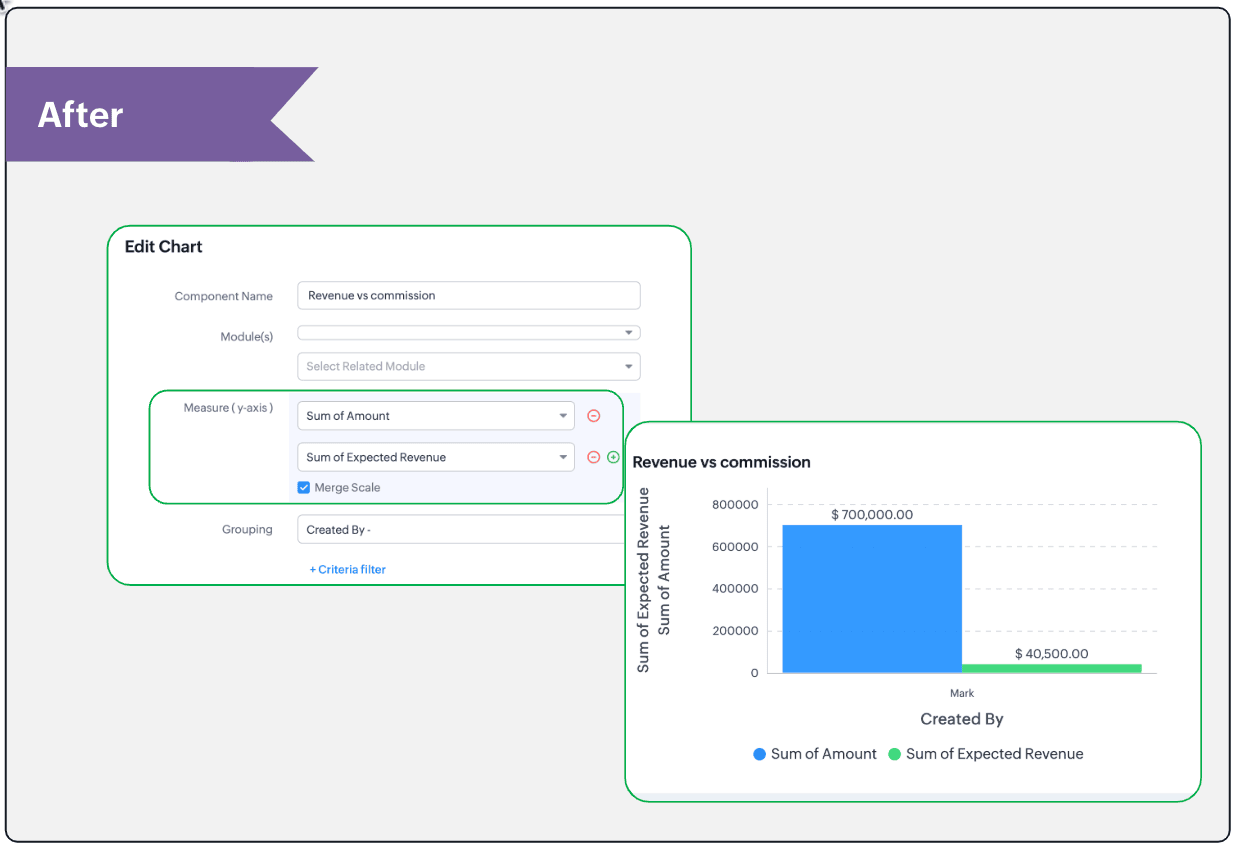
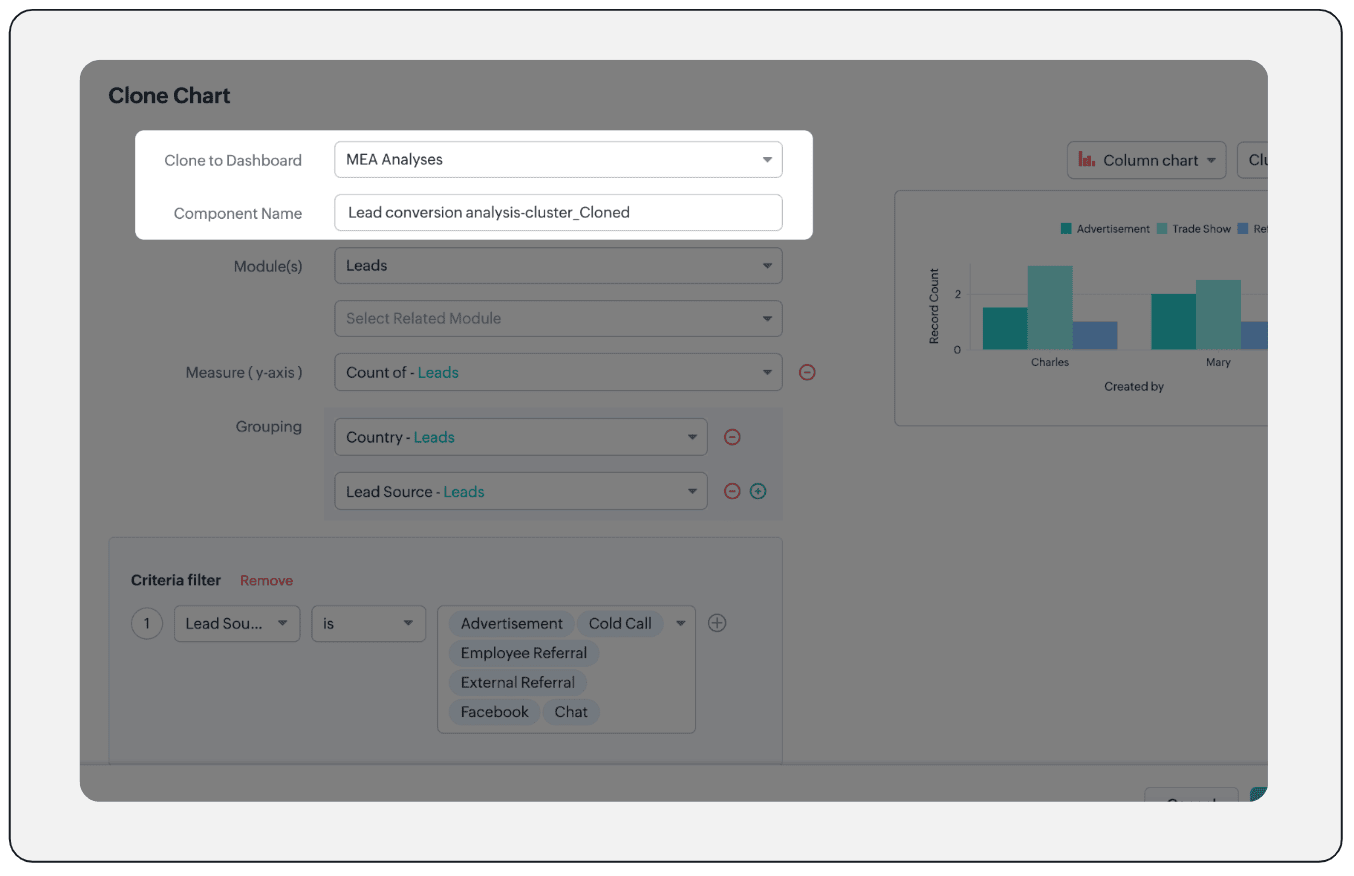
- Clone components to a different dashboard: Dashboards in Analytics serve in unique ways for various audiences—there can be separate dashboards for the sales team, marketing team, engineering team, and so on, and the chances of using the same measure for reference is common. Thus, when you clone a chart, you can now determine the target dashboard in which the cloned chart can be placed.
Resource: Help document
Thanks and have a good one!
Kind regards,
Saranya Balasubramanian
Saranya Balasubramanian
Topic Participants
Saranya Balasubramanian
Sticky Posts
Enhancements to the formula field in Zoho CRM: Auto-refresh formulas with the "Now" function, stop formula executions based on criteria, and include formulas within formulas
Dear Customers, We hope you're well! By their nature, modern businesses rely every day on computations, whether it's to calculate the price of a product, assess ROI, evaluate the lifetime value of a customer, or even determine the age of a record. WithElevate your CX delivery using CommandCenter 2.0: Simplified builder; seamless orchestration
Most businesses want to create memorable customer experiences—but they often find it hard to keep them smooth, especially as they grow. To achieve a state of flow across their processes, teams often stitch together a series of automations using WorkflowPresenting ABM for Zoho CRM: Expand and retain your customers with precision
Picture this scenario: You're a growing SaaS company ready to launch a powerful business suite, and are looking to gain traction and momentum. But as a business with a tight budget, you know acquiring new customers is slow, expensive, and often deliversNimble enhancements to WhatsApp for Business integration in Zoho CRM: Enjoy context and clarity in business messaging
Dear Customers, We hope you're well! WhatsApp for business is a renowned business messaging platform that takes your business closer to your customers; it gives your business the power of personalized outreach. Using the WhatsApp for Business integrationZoho CRM: Sales Rep Professional Certification Program on Coursera
We are happy to share that we have published the Zoho Sales Representative Professional Certificate in partnership with Coursera, a leading platform for online learning and career development that offers access to courses and degrees from leading universities
Recent Topics
Search in module lists has detiorated
Every module has a problem with the search function :-/Sales Receipts Duplicating when I run reports why and how do we rectify this and any other report if this happens
find attached extract of my reportAdd Zoho Forms to Zoho CRM Plus bundle
Great Zoho apps like CRM and Desk have very limited form builders when it comes to form and field rules, design, integration and deployment options. Many of my clients who use Zoho CRM Plus often hit limitations with the built in forms in CRM or Desk and are then disappointed to hear that they have to additionally pay for Zoho Forms to get all these great forms functionalities. Please consider adding Zoho Forms in the Zoho CRM Plus bundle. Best regards, Mladen Svraka Zoho Certified Consultant andBigin: filter Contacts by Company fields
Hello, I was wondering if there's a way to filter the contacts based on a field belonging to their company. I.e.: - filter contacts by Company Annual Revenue field - filter contacts by Company Employee No. field In case this is not possibile, what workaroundHas Zoho changed the way it searches Items?
Right now all of our searches have broken and we can no longer search using the SKU or alias. It was fine last night and we came in this morning to broken.....this is impacting our operations now.Refunds do not export from Shopify, Amazon and Esty to Zoho. And then do not go from Zoho inventory to Quickbooks.
I have a huge hole in my accounts from refunds and the lack of synchronisation between shopify , Amazon and Etsy to Zoho ( i.e when I process a refund on shopify/ Amazon or Etsy it does not come through to Zoho) and then if I process a manual credit note/CRM->INVENTORY, sync products as composite items
We have a product team working in the CRM, as it’s more convenient than using Books or Inventory—especially with features like Blueprints being available. Once a product reaches a certain stage, it needs to become visible in Inventory. To achieve this,Zoho Calendar not working since a few days
Hey there, first off a minor thing, since I just tried to enable the Calendar after reading this in another topic (there was no setting for this though) : For some reason my current session is showing me based in New York - I'm in Germany, not using aMonthly timesheet, consolidation of time by project
I have time logs for various jobs for project. Is it possible to consolidate the time spent for each job, when I am generating a timesheet for a month? I am getting the entries of jobs done on each day when I generate a timesheet for a month For exampleBuilding a Strong Online Identity with G-Tech Solutions
In today’s fast-moving world, having a strong online identity is essential for every business. https://gtechsol.com.au helps businesses establish a digital presence that reflects their vision and values. By focusing on innovation and quality, they createSending emails from an outlook account
Hi, I need to know if it's possible to send automatic emails from an Outlook account configured in Zoho CRM and, if so, how I can accomplish that. To give you some context, I set up a domain and created a function that generates PDF files to be sent laterStruggling with stock management in Zoho CRM – is Zoho Inventory the solution?
My biggest pain point today with Zoho is inventory management. I run a retail business and reliable stock management is absolutely critical. Obviously, I need this inventory to be visible inside the CRM. At first, I tried handling it through custom modulesNimble enhancements to WhatsApp for Business integration in Zoho CRM: Enjoy context and clarity in business messaging
Dear Customers, We hope you're well! WhatsApp for business is a renowned business messaging platform that takes your business closer to your customers; it gives your business the power of personalized outreach. Using the WhatsApp for Business integrationcan't login Kiosk URGENT
already try, can't login pls help to support. thanks.【Zoho CRM】CRM for Everyoneに関するアップデート:関連データ機能
ユーザーの皆さま、こんにちは。コミュニティチームの中野です。 今回は「Zoho CRM アップデート情報」の中から、CRM for Everyoneの新機能「関連データ機能」をご紹介します。 関連データ機能は、あるタブのデータを別のタブに柔軟に関連付け、異なるタブで管理されている情報を1か所にまとめて表示できます。 たとえば、組織タブとチームタブのデータを関連付けることで、必要な情報に効率よくアクセスでき、顧客理解を深めながら他チームとの連携もスムーズに行えます。 目次 1. 関連データの設定方法Zoho Books
How do I manually insert opening balance?Profit / margins on Sales orders / Invoices / Estimates
When we select an SKU or item name in any of these documents, much info such as invoice.line_items.rate is pulled from the item & filled into the document being worked on. If we had another lineItem DB field (hidden) auto filled at the same time: invoice.line_items.purchase_rateInventory to Xero Invocie Sync Issues
Has anyone had an issue with Invoices not syncing to Xero. It seems to be an issue when there is VAT on a shipping cost, but I cannot be 100% as the error is vague: "Unable to export Invoice 'INV-000053' as the account mapped with some items does notHow to activate RFQ? What if a price list has ladder price for items?
Where can I find the option to activate request for quotation? How does it work? If the item has ladder price, does it gets calculated depending on how many items are in the cart?Mailk got blocked / Inquiry About Email Sending Limits and Upgrade Options
Dear Zoho Support Team, My name is Kamr Elsayed I created this account to use for applying for vocational training in Germany. As part of this process, I send multiple emails to different companies. However, after sending only 8 emails today, I receivedCan't join canal Developers Zoho User
Hello, I received an invitation to join this channel, but I get an error when I try to join it, and I get the same error when I go to the Zoho Cliq interface > Search for a channel. Is this because I don't have a license linked to this email address?Desk Email reply - set default font / use custom font
Hello, in our e-mails, which we send to our customers, a certain font must be used (Corporate Design): Segoe UI https://en.wikipedia.org/wiki/Segoe#Segoe_UI How can this be included? How can this be set as the default font to ensure that this font isPDF Templates - Checkbox Borders
Is there a way to remove the border of a radio/checkbox on a PDF? I'd like to use the function of checkbox but if there's no easy way to remove the border (the PDF form already has a rectangle so it gets cluttered), then I'm forced to create a singleSettings Icon No Longer in ZOHO Desk?
In ZOHO desk, there has been a gear icon for settings. as of yesterday, it is no longer there. I showed up briefly this morning but is gone again. Anybody else experiecing this?Introducing the all-new email parser!
Greetings, We are pleased to introduce to you, a brand-new, upgraded version of the Zoho CRM Email Parser, which is packed with fresh features and has been completely redesigned to meet latest customers needs and their business requirements. On that note,Tip #43 - Track, Review, and Analyze Your Assist Sessions with Reports-'Insider Insights'
Did you know you can generate detailed reports for both remote support sessions and unattended access sessions in Zoho Assist? This makes it easy to monitor technician activity, measure efficiency, and review customer interactions. Let us now take a closerFunction #20: Custom calculation in item table of invoices
When you create an invoice in Zoho Books, the 'Amount' of a line item is typically calculated as the product of the "Quantity" and the "Rate" of the item. For instance, if an item has a sales rate of $50 and a quantity of 5 is sold, then the amount wouldCBSA - GST CHARGES on imports
Hi there, We have a questions about landed cost categorization. We received a shipment from overseas. CBSA invoiced us for the GST on the items. Now we entered the CBSA-GST as a separate bill and attached it as landed cost to the main invoice based onSimplified Call Logging
Our organization would like to start logging calls in our CRM; however, with 13 fields that can't be removed, our team is finding it extremely cumbersome. For our use case, we only need to record that a call happened theirfor would only need the followingSub form doesn't as formula field
Is it possible to get formula field in sub form in futures?Week date range in pivot table
Hello, I need to create a report that breakouts the data by week. I am using the pivot table report, and breaking out the date by week, however the date is displayed as 'Week 1 2014' format. Is there anyway to get the actual dates in there? ex. 1/6/2014-1/12/2014 Thanks,How do I get Status History data of my Projects?
I want to build a table in Zoho Analytics that Groups by Date, when Projects entered a certain status. I cannot find Status History or any such useful data available in the Setup of my Data Source sync. Please advise how I can achieve this?Is it possible to hide fields in a Subform?
Since layout rules cannot be used with Subforms, is there another way, or is it even possible, to hide fields in a subform based on a picklist fields within said subform? For example, if the Service Provided is Internet, then I do not want to see theWeekly Tips :Instantly find what you need with Attachment Viewer
Your inbox must be packed with project emails, shared notes, and scattered attachments. You are looking for one specific file—a presentation slide or maybe a media clip from a team update—but don’t want to dig through endless email threads or switch betweenPutting Watermark on Zoho Sheet
Can this be done?Missing Zoho Desk integration option for form workflows
According to the help page "Configure Zoho Desk integration in form workflows" we should be able to select Zoho Desk as an integration target but when I open the integrations list then Zoho Desk is not being listed in it. We are on the Premium plan which should already support Zoho Desk integrations.Gantt for 2 or more projects
Hello, I'm trying the free version of your produtc. It is veryyy good!!!! I don't know if in the Standard plan, I can overview a Gantt Graph for 2 or more Projects Milestone. This would be very helpfull for managing teams and taking decisions about who I will assign a task to. In the paid plan Do I have this possibility? Thank you.Integrating a Zoho Project Gantt Chart into Reports
Is is possible to integrate a Zoho Project Gantt Chart into a Zoho Report Dashboard. I am in the process of creating Project Status Dashboards for the projects that we track in Zoho Projects and I would like to incorporate the gantt chart within Reports. Please let me know! ThanksZOHO BOOKS - EXCESSIVELY SLOW TODAY
Dear Zoho Books This is not the first time but it seems to be 3 times per week now that the system is extremely slow. I work on Zoho Books 95% of my day so this is very frustrating. Zoho you need to do something about this. I have had my IT guy checkGantt Chart - Zoho Analytics
Are there any plans to add Gantt Charts capabilities to Zoho Analytics?Next Page