Visualize Charts Using Groupby and Aggregate functions
Hello!
Have you been using tables to present data in mail merged documents? If so, it maybe time to try a more interesting alternative. Charts help you present data in an exciting way, and make it easy to highlight specific aspects of your data.
With Writer, adding charts to mail merged documents is simple. Easily create and edit charts to meet your needs using different chart types, built-in aggregation functions, and chart customization options.
Aggregation in charts / Aggregate functions in charts
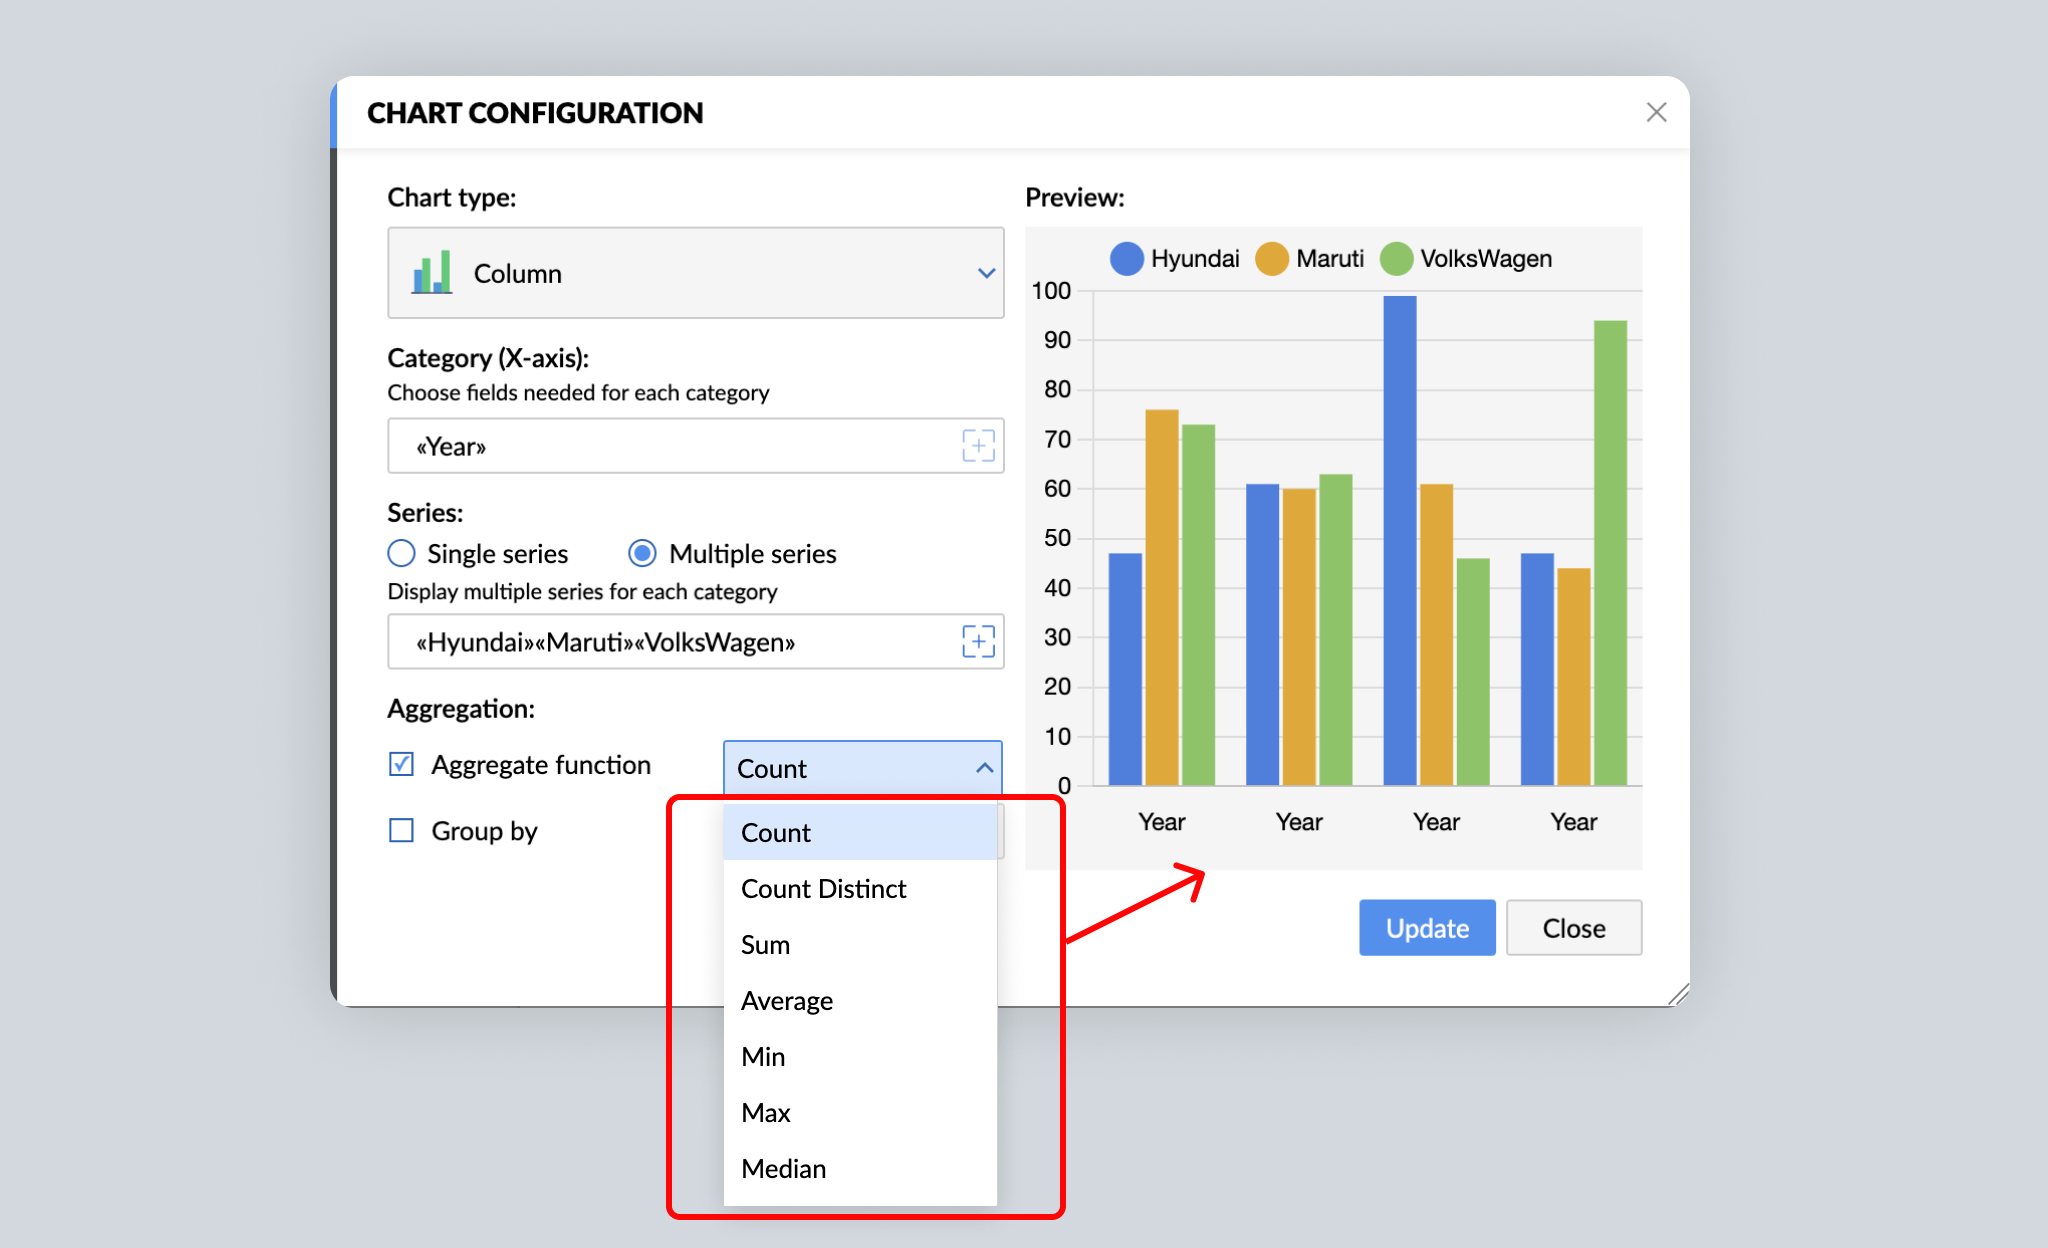
Pull data from your data source and choose an aggregate function to present it within your document. Writer offers Count, Count Distinct, Sum, Average, Min, Max, and Median functions to process your data however you need.
1. Numerical data aggregation
Data comprised entirely of numbers (such as the number of cars sold by a company) is numerical data. Compared with raw or individual data (like a list of all cars sold), aggregated data (such as the number of a specific type of car sold every month) is more useful. Writer helps you instantly aggregate data with built-in chart functions.

Writer's charts support the following aggregate functions: Count, Count Distinct, Sum, Average, Min, Max, and Median. For example, you can apply the Count function to the monthly sales data to get the number of cars sold per month. Similarly, the Average function will show the average number of sales per month. Click here to learn what each aggregation function does.
Aggregated data helps reveal patterns, and charts make the patterns easy to understand. In the case of our example, a chart provides an overview of the car company's monthly sales performance.
2. Non-numerical data aggregation
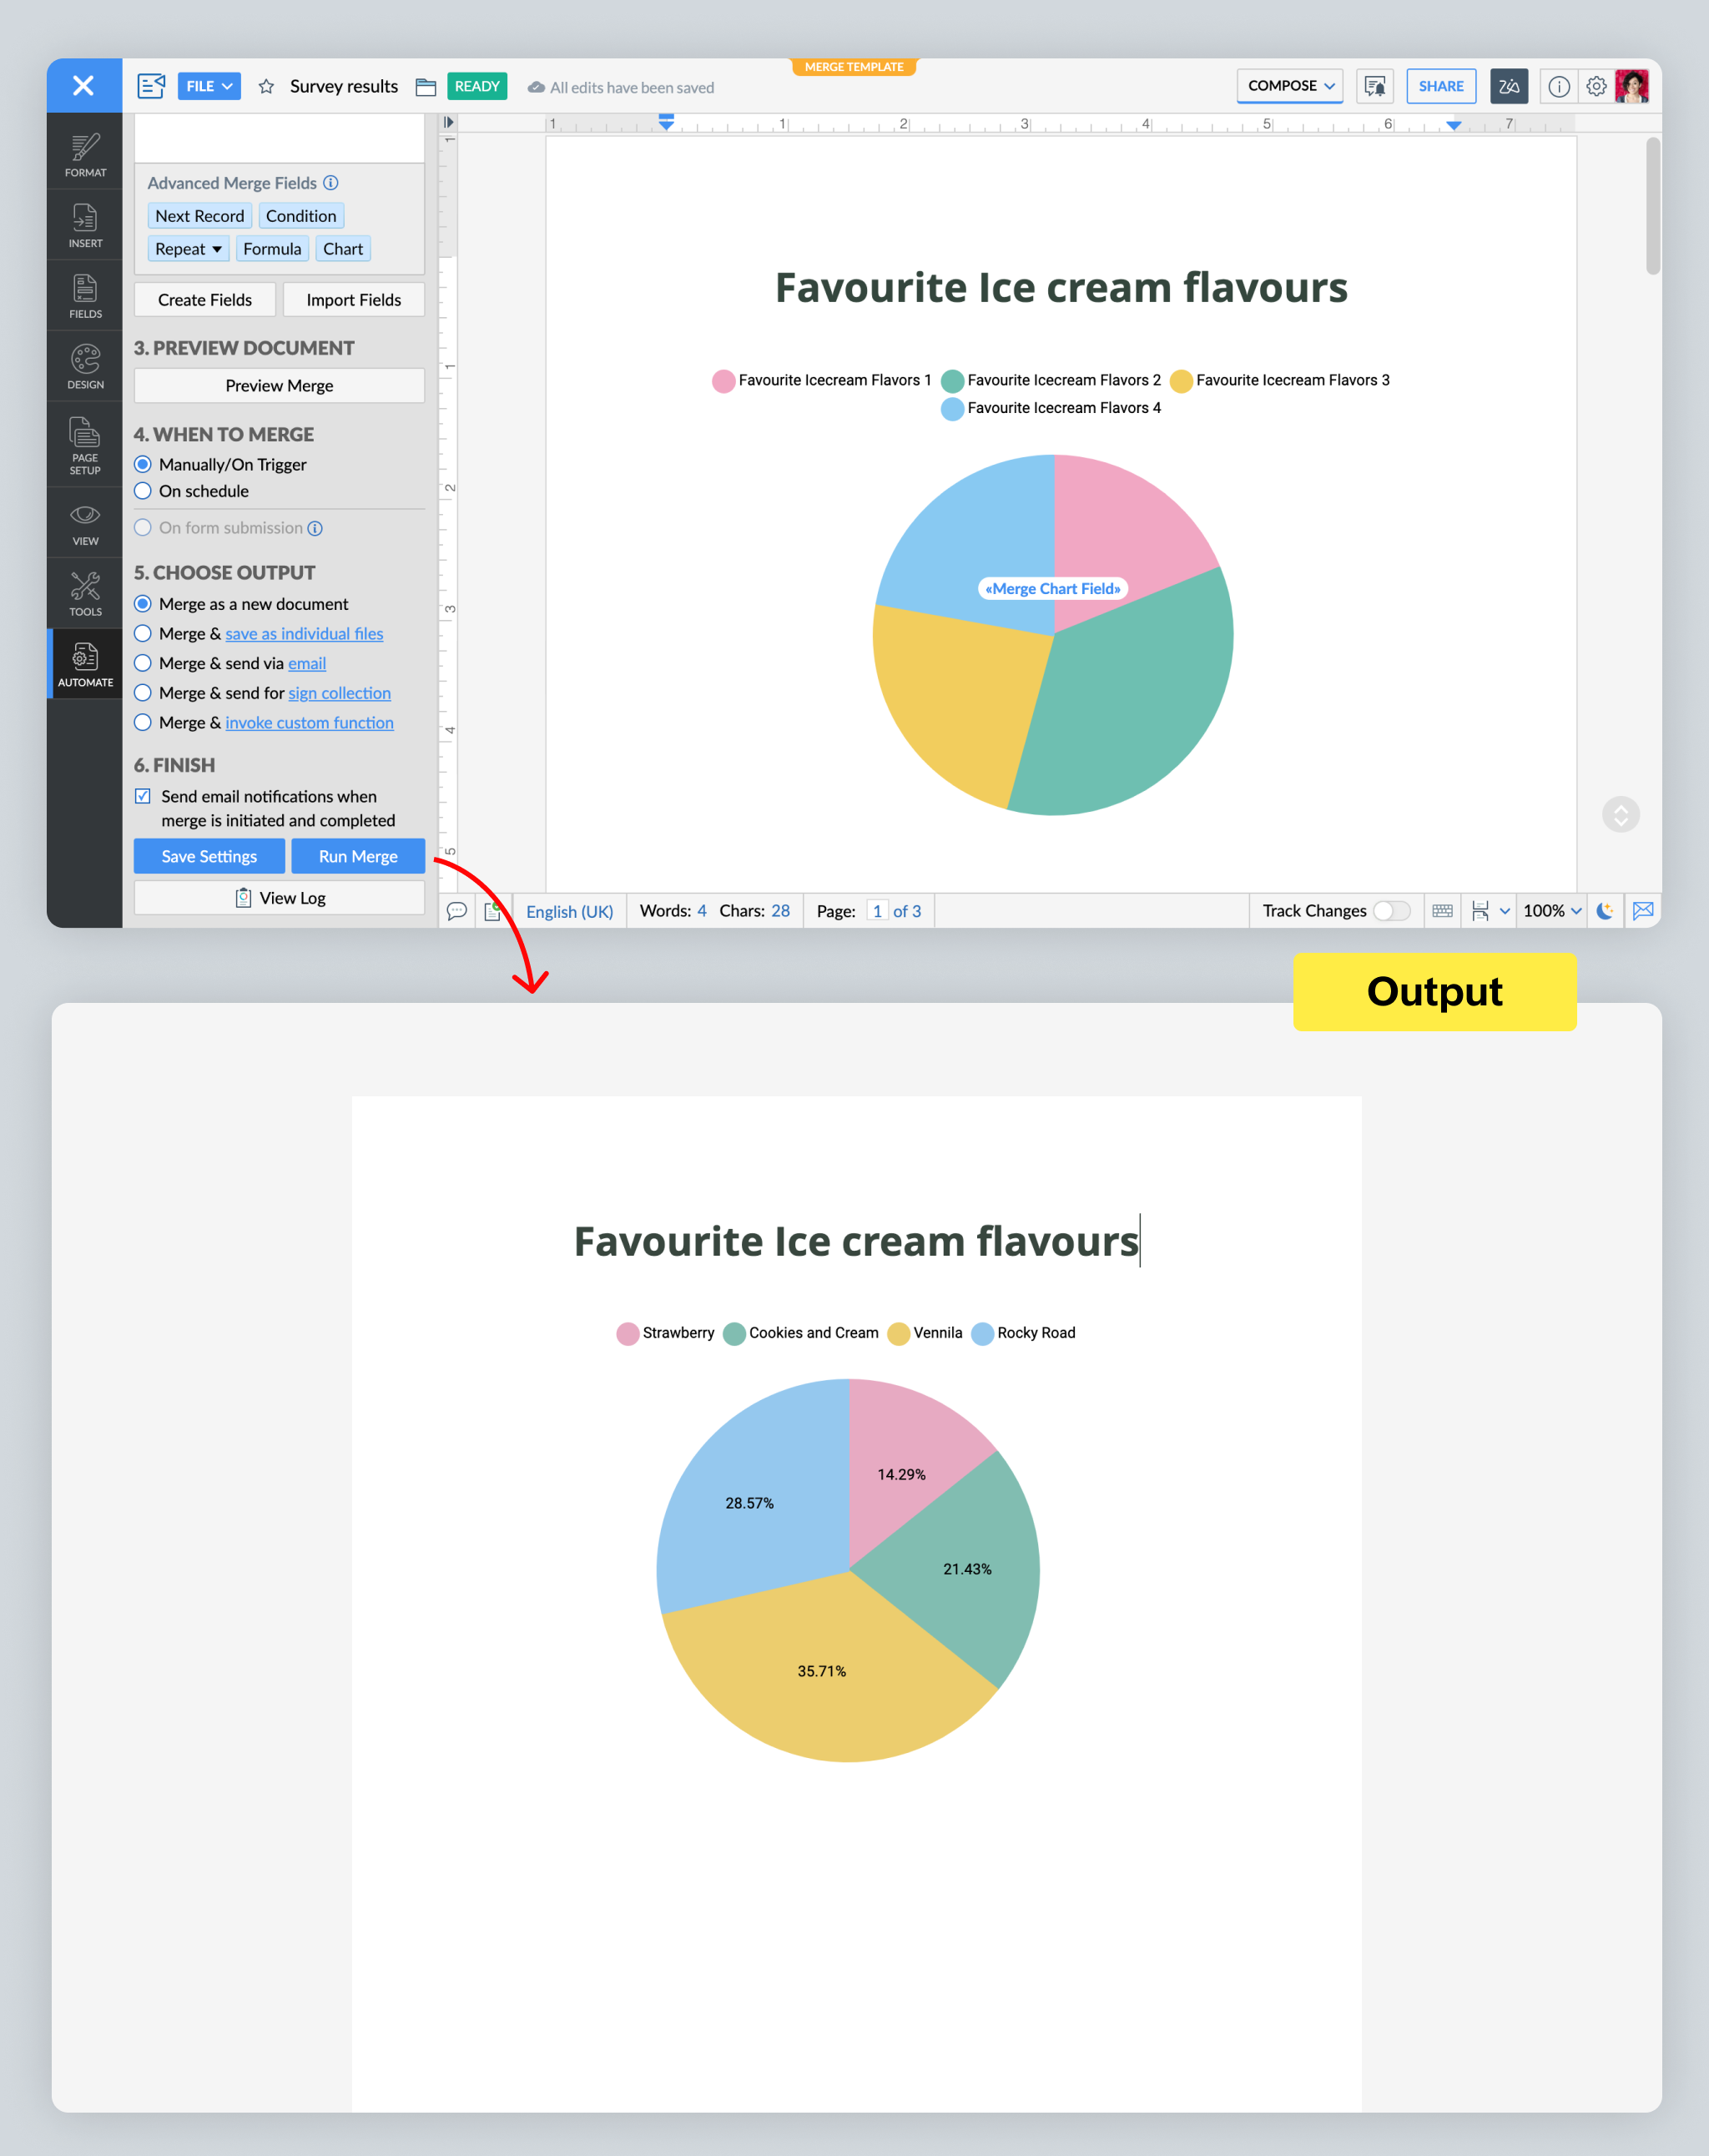
Any data without numbers (such as yes/no answers, or answers to open-ended questions) is non-numerical data. Let's say a fast food restaurant wants to add ice cream to its menu. It can run a survey among its customers asking for their favorite ice cream flavors. From there, it can use Writer to aggregate the responses, and present them in the form of a pie chart to easily understand customers' preferences.

3. Group By and Aggregate
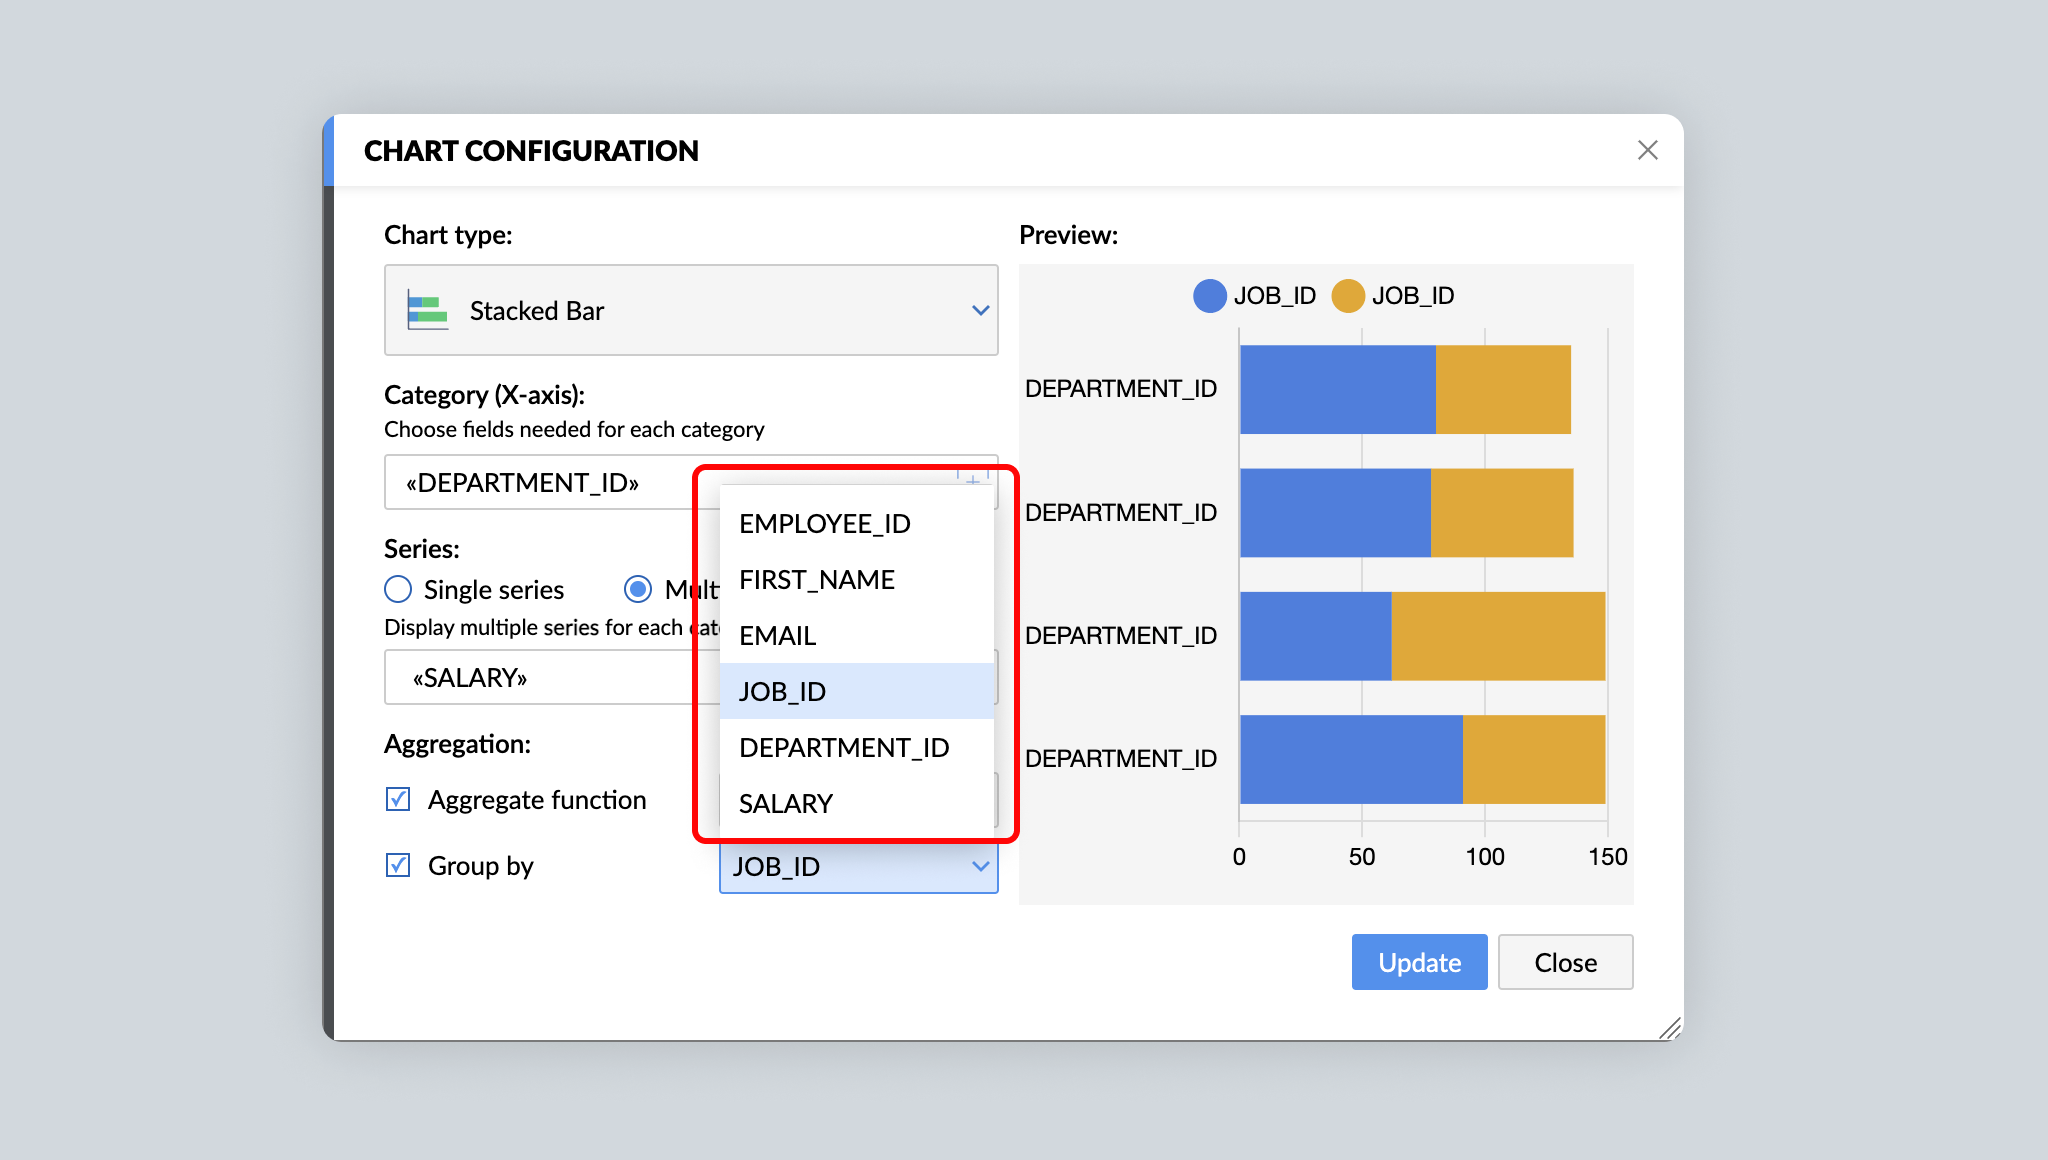
For detailed analysis and insights, you may choose to split data into separate groups before aggregating them. For example, in addition to the total number of cars sold in a month, you might also want to know the number of hatchbacks, sedans, and coupes sold in a month. With Writer's Group By function in charts, segregating raw data into different groups and then aggregating them becomes simpler.

Advanced chart tools
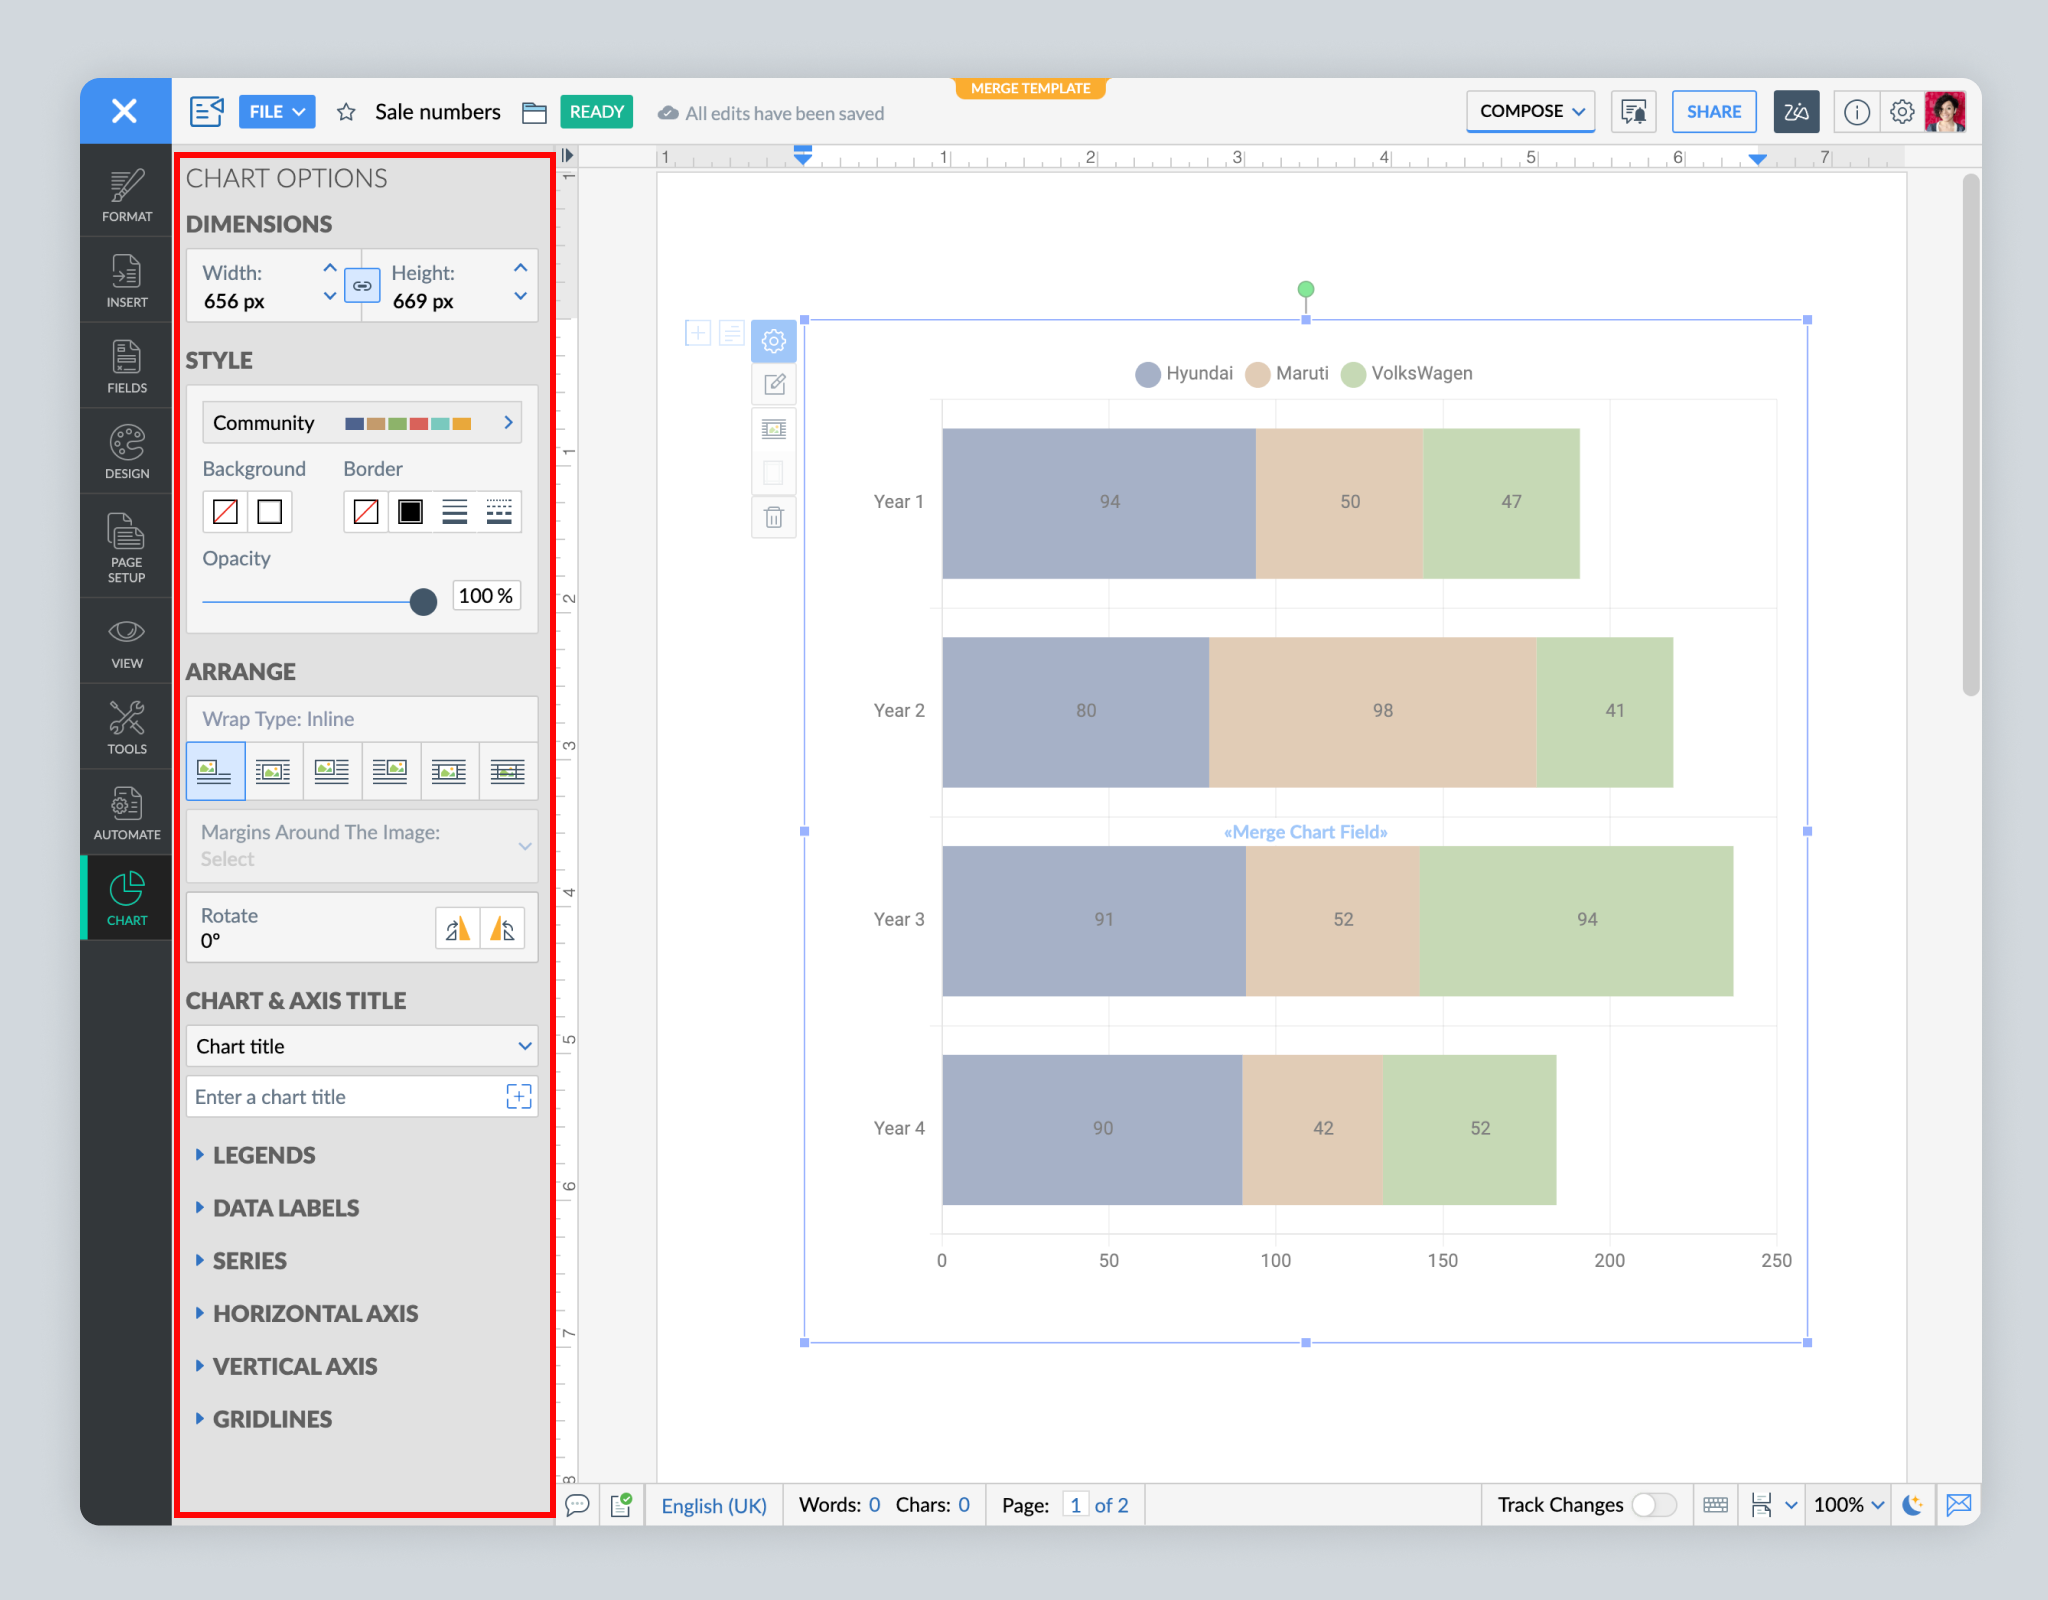
Make your data visually appealing and easy to understand. After choosing a chart type, use various customization options, such as colors, wrap style, margins, position of legends and data labels, and font sizes.

That's all for now! Tryout Writer's charts, advanced chart tools, and aggregate functions in mail merge, and let us know what you think.
Need any help working with charts? Write to us at support@zohowriter.com or simply leave a comment.
Happy writing!
Topic Participants
Shri Rakkshaa Gk
Sticky Posts
Easily perform calculations using dates with the new DATEDIF function
Hey Zoho Writer users! We've enhanced Zoho Writer's formula capabilities with the new DATEDIF function. This allows you to calculate the difference between dates in days, months, and years. Function syntax: =DATEDIF(start_date, end_date, unit) Inputs:Zoho Writer's WordPress extensions
Hey Zoho Writer users! Say goodbye to all your WordPress content publishing woes with Zoho Writer's WordPress extensions. Publish content with all your formatting and images, republish content when you update a document, and more—from a single windowDate-based conditions and filters
Configure conditions with date Hi everyone! We are excited to announce that you can now compare and filter data with date-based conditions. This update lets you compare date fields in a document to a reference date and display a text or value if theIntroducing group by, aggregation, and repeating regions in mail merge templates
Display data exactly the way you want and highlight key insights with Zoho Writer's enhanced merge templates. We've supercharged Zoho Writer's merge templates with the capability to dynamically group, aggregate, and repeat data as blocks. You can nowSay hello to an improved way to merge documents!
Automating all your documents from start to finish is now easier than ever with Writer's new merge tools. If you haven't seen it yet, you can read the main announcement here. Here is the full list of the features we've rolled out: 1. Dynamic Table Headers
Recent Topics
Crossbeam
Does anyone use Crossbeam with their Zoho CRM? I'm looking for a way to import Crossbeam partner leads into Zoho CRM. If so: - What's your experience been like? - Are you able to automatically import Crossbeam leads > Zoho CRM? How? - What doesn't workGlobal Search placement in the new UI
Having a hard time with the global search placement in the UI redesign. Surely I can't be the only one. Previously global search placement was perfect. A bar at the top/center of the page. Exactly where you would expect it to be. Since the new UI hasChange Last Name to not required in Leads
I would like to upload 500 target companies as leads but I don't yet have contact people for them. Can you enable the option for me to turn this requirement off to need a Second Name? Moderation update (10-Jun-23): As we explore potential solutions forAccess forms within a form
I have multiple forms that I would like to create access to for users within one form. Example: I have forms A, B, C, D. I would like to create a form with the links to forms A, B, C, & D. That way we can send one link and then the user can select theWorkDrive issues with Windows Explorer Not Responding
We are using WorkDrive to collaborate on editing video content. We have a lot of files and quite a few are a few gigs. Recently anytime I try and work with the files Explorer freezes for a couple minutes whether it's dragging the files into Premiere orMultiple Cover Letters
We are using the staffing firm edition of Recruit and we have noticed that candidates cannot add more than one cover letter. This is a problem as they might be applying for multiple jobs on our career site and when we submit their application to a client,Issues with Actions By Zoho Flow
Hi, I have a workflow that fires when a deal reaches a stage. This then sends out a contract for the client to sign. I have connected this up through Actions by Zoho Flow. Unfortunately this fails to send out. I have tracked it down to the date fields.WhatsApp IM in Zoho Desk always routes to Admin instead of assigned agent
Hello Zoho Experts, I connected WhatsApp IM to my Zoho Desk account. I only assigned my Customer Service (CS) agent to the WhatsApp channel, and I did NOT include Admin in this channel. However, every new WhatsApp conversation automatically gets assignedFill Mail Merge document up with subform fields of an Inventory module record being in the Related List
Hi, I try to insert subform fields from an inventory module record being on the Related List of another inventory module record into a Mail Merge template without success. For example: we use ratecards in licensing and this ratecard items are availableEnhancements for Currencies in Zoho CRM: Automatic exchange rate updates, options to update record exchange rates, and more
The multi-currency feature helps you track currencies region-wise. This can apply to Sales, CTC, or any other currency-related data. You can record amounts in a customer’s local currency, while the CRM automatically converts them to your home currencyIntroducing Record Category in CRM: Group options to see record status at a glance.
Release update: Currently available for CN, JP, and AU DCs (all paid editions). It will be made available to other DCs by mid-March. Hello everyone, We are pleased to introduce Record Category in Zoho CRM - a new capability where the user can get an overviewCRM x WorkDrive: File storage for new CRM signups is now powered by WorkDrive
Availability Editions: All DCs: All Release plan: Released for new signups in all DCs. It will be enabled for existing users in a phased manner in the upcoming months. Help documentation: Documents in Zoho CRM Manage folders in Documents tab Manage filesSender Email Configuration Error.
Hello Team, Hope you are all doing well. We are in the process of creating the Zoho FSM environment in the UAE. When we try to add the sender email address “techsupportuae@stryker.com”, we receive the error message: “Error occurred while sending mailBetter use of contacts
Zoho inventory has the ability to add multiple contacts to customers. However Zoho inventory doesn't currently provide a way to link a contact to objects like sales orders. This means that while you can tell what company has placed a sales order you can'tHow can we add products using a Wizard?
We want to create a Wizard to add products. Why is there no possibility to use the products module when creating a wizard?Orphan email alias blocking user creation – backend cleanup required
Hello Zoho Mail Support, I´m unable to assign or create the address xx@iezzimatica.ar in my organization. Current situation: Alias cannot be assigned to any user (system says it is already in use) New user with this address cannot be created Address doesDirect Access and Better Search for Zoho Quartz Recordings
Hi Zoho Team, We would like to request a few enhancements to improve how Zoho Quartz recordings are accessed and managed after being submitted to Zoho Support. Current Limitation: After submitting a Quartz recording, the related Zoho Support ticket displaysEnsure Consistent Service Delivery with Comprehensive Job Sheets
We are elated to announce that one of the most requested features is now live: Job Sheets. They are customizable, reusable forms that serve as a checklist for the services that technicians need to carry out and as a tool for data collection. While onSomething wrong with client script??
Someone have the same feeling? Client script behavior become very strange..Polish signer experience to compete with docusign
I would like to suggest that someone spend the little bit of time to polish the signer experience, and the email templates to more of a modern professional feel. They are currently very early 2000s and with some simple changes could vastly improve thehow to change the page signers see after signing a document in zoho sign
Hello, How can I please change the page a signer sees after signing a document in Zoho Sign? I cannot seem to find it. As it is now, it shows a default landing page "return to Zoho Sign Home". Thanks!Digest Janvier - Un résumé de ce qui s'est passé le mois dernier sur Community
Bonjour chers utilisateurs, Le premier mois de l’année est déjà derrière nous ! Découvrons ensemble comment s'est passé janvier pour Zoho Community France. Nous avons démarré le mois avec une nouvelle intégration entre Zoho Desk et Zoho Contracts. CetteCRM gets location smart with the all new Map View: visualize records, locate records within any radius, and more
Hello all, We've introduced a new way to work with location data in Zoho CRM: the Map View. Instead of scrolling through endless lists, your records now appear as pins on a map. Built on top of the all-new address field and powered by Mappls (MapMyIndia),Closing off tasks automatically based on project status
Is there a way to close off all open tasks when a project is set as Cancelled?Customize Calendar view in Teamspaces Settings
Right now every customization that happens inside of the calendar view inside of CRM is only visible for the specific user. We want to be able to set up calendar views as an admin for specific roles. I would suggest to do that inside of the settings ofPower up your Kiosk Studio with Real-Time Data Capture, Client Scripts & More!
Hello Everyone, We’re thrilled to announce a powerful set of enhancements to Kiosk Studio in Zoho CRM. These new updates give you more flexibility, faster record handling, and real-time data capture, making your Kiosk flows smarter and more efficientCan we fetch Deal owner and Deal owner email with COQL?
While fetching deal deatils with coql api and while fetching deal owner name and email it is just giving owner id not ginving name and email https://www.zohoapis.in/crm/v2/coqlZoho Social - Cliq Integration / Bot
Dear community / zoho, I am looking for a way to create a bot within Zoho Cliq to update my colleagues about our Zoho Social activities. For example, if a new post is published, it would be great if this post automatically would be shared in our socialZoho CRM for Everyone's NextGen UI Gets an Upgrade
Hello Everyone We've made improvements to Zoho CRM for Everyone's Nextgen UI. These changes are the result of valuable feedback from you where we’ve focused on improving usability, providing wider screen space, and making navigation smoother so everythingComment to DM Automation
Comment to DM automation feature in Zoho Marketing Automation, similar to what tools like ManyChat offer. Use case: When a user comments on a social media post (Instagram / Facebook), the system should automatically: Send a private DM to the user CaptureSend / Send & Close keyboard shortcuts
Hello! My team is so close to using Zoho Desk with just the keyboard. Keyboard shortcuts really help us to be more efficient -- saving a second or two over thousands of tickets adds up quickly. It seems like the keyboard shortcuts in Desk are only forMetadata API Access to Functions
I think it would be incredibly helpful to have api access to every function's code. Our team primarily uses deluge functions to update fields across modules according to business logic. I would like to create a visual dependancy model for our CRM, butHandling Agent Transfer from Marketing Automation Journey to SalesIQ WhatsApp
We are currently using Marketing Automation for WhatsApp marketing, and the features are great so far We have a scenario where, during a campaign or journey, we give customers an option to chat with our sales team. For this, we are using SalesIQ WhatsAppCliq iOS can't see shared screen
Hello, I had this morning a video call with a colleague. She is using Cliq Desktop MacOS and wanted to share her screen with me. I'm on iPad. I noticed, while she shared her screen, I could only see her video, but not the shared screen... Does Cliq iOS is able to display shared screen, or is it somewhere else to be found ? RegardsWebinar - Getting Started with Zoho LandingPage
Want to launch landing pages that support real marketing goals? This webinar is designed to help you understand the role landing pages play in your overall campaigns and how they contribute to lead generation and conversions. During this session, you’llIncrease Round Robin Scheduler Frequency in Zoho Desk
Dear Zoho Desk Team, We hope this message finds you well. We would like to request an enhancement to the Round Robin Scheduler in Zoho Desk to better address ticket assignment efficiency. Current Behavior At present, the Round Robin Scheduler operatesSeparate Items & Services
Hi, please separate items and services into different categories. Thank youZoho mail to contacts and leads, but not to accounts?
We use the accounts tab a lot for our business because they can be linked to the sales orders. Now we want to use the mail add on to link communication of our emails to our accounts. However this is only possible for contacts and leads? It would be convenientZoho CRM Layouts
I have customised all our modules, Leads, Contacts and deals, and within them, I have created lots of different layouts depending on the type of Lead or contact, for example. Since the new Zoho UI came out, they have all disappeared. I have gone intoZoho CRM || Unable to Bulk Assignment of Territories for Contacts
Dear Zoho CRM Support Team, I hope this email finds you well. We recently performed a bulk upload of Contacts into Zoho CRM using the official sample Excel template downloaded from the CRM. The upload itself was completed successfully; however, we encounteredNext Page