Report of Week - Customer Preferred Brands over Finance Data
People tend to choose a few brands over the other. The popularity of the brand or the quality attached to it makes consumers gravitate toward the brand names. Understanding the customers' purchase behavior and measuring their brand preference is vital for your retail strategy.
This week, let's learn how to track the most and the least preferred brands among your customers and invest in what brings profit. This solution is based on Zoho Finance data. You can customize the solution to suit your finance data structure.
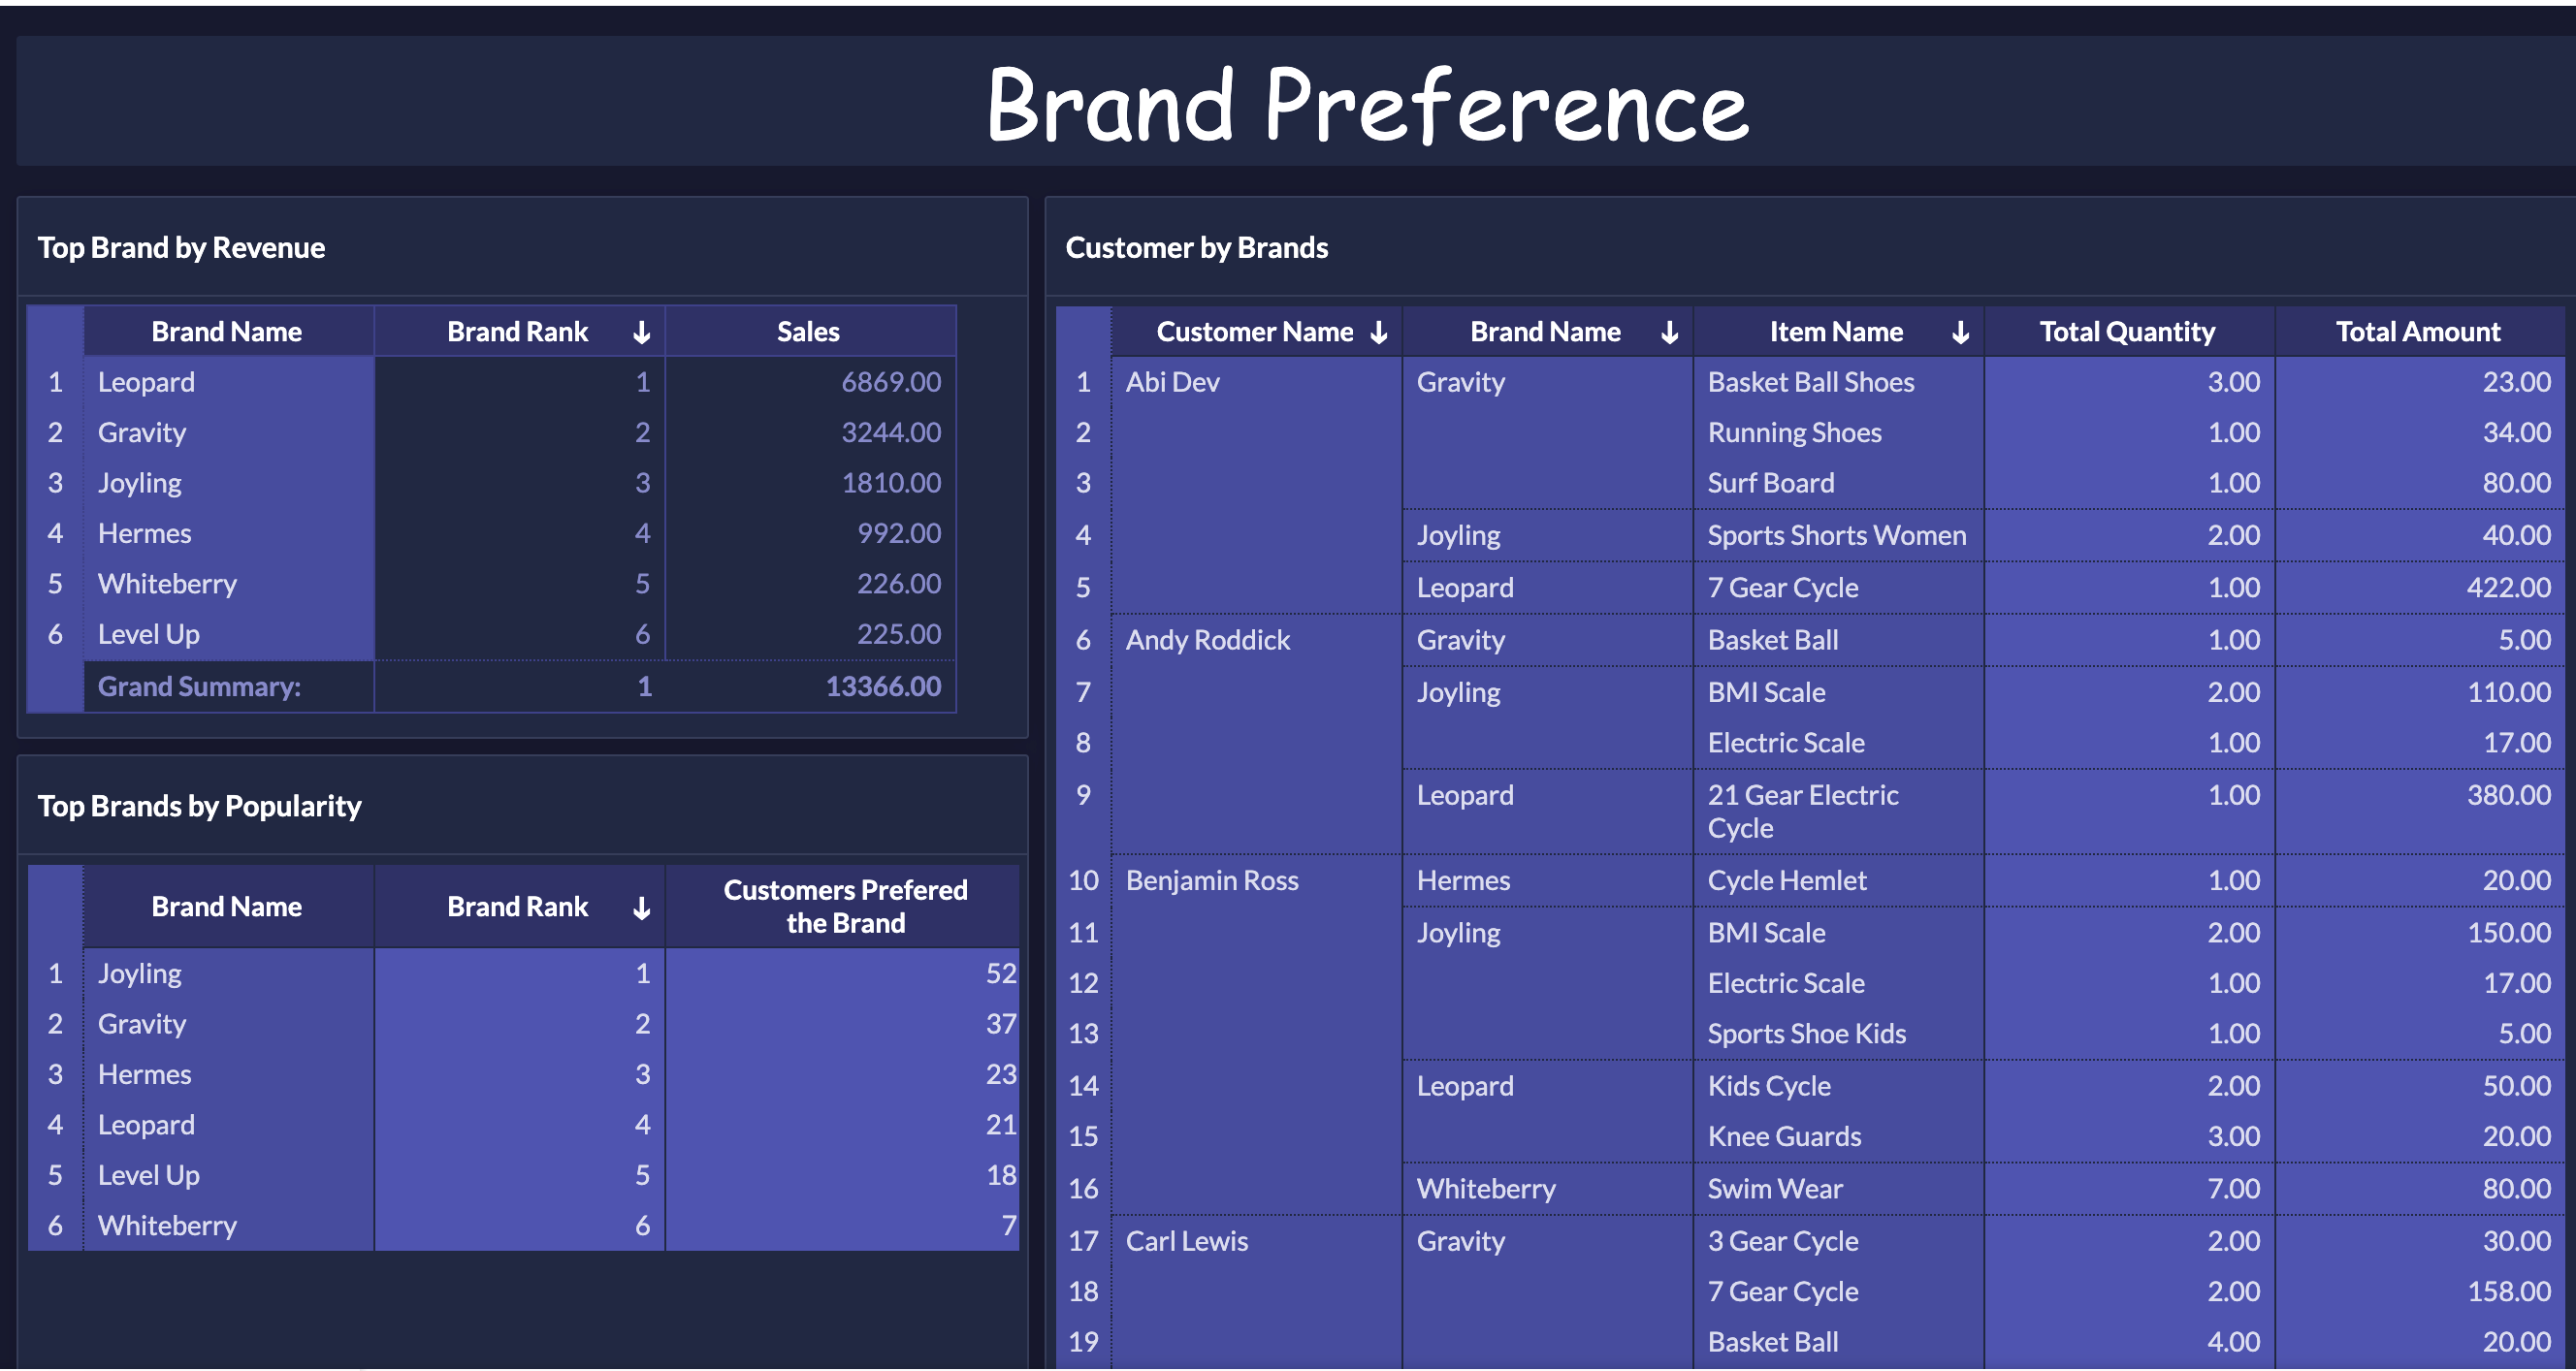
- Join Invoice and Credit Notes data (Query Table)
- Rank the Brands using Formulas
- Brand Rank by sales
- Brand Rank by number of customers who picked it
- Create Reports
- Top Brands by Revenue
- Top Brands by Popularity
- Customer by Brands
Join Invoices and Credit Notes data (Query Table)
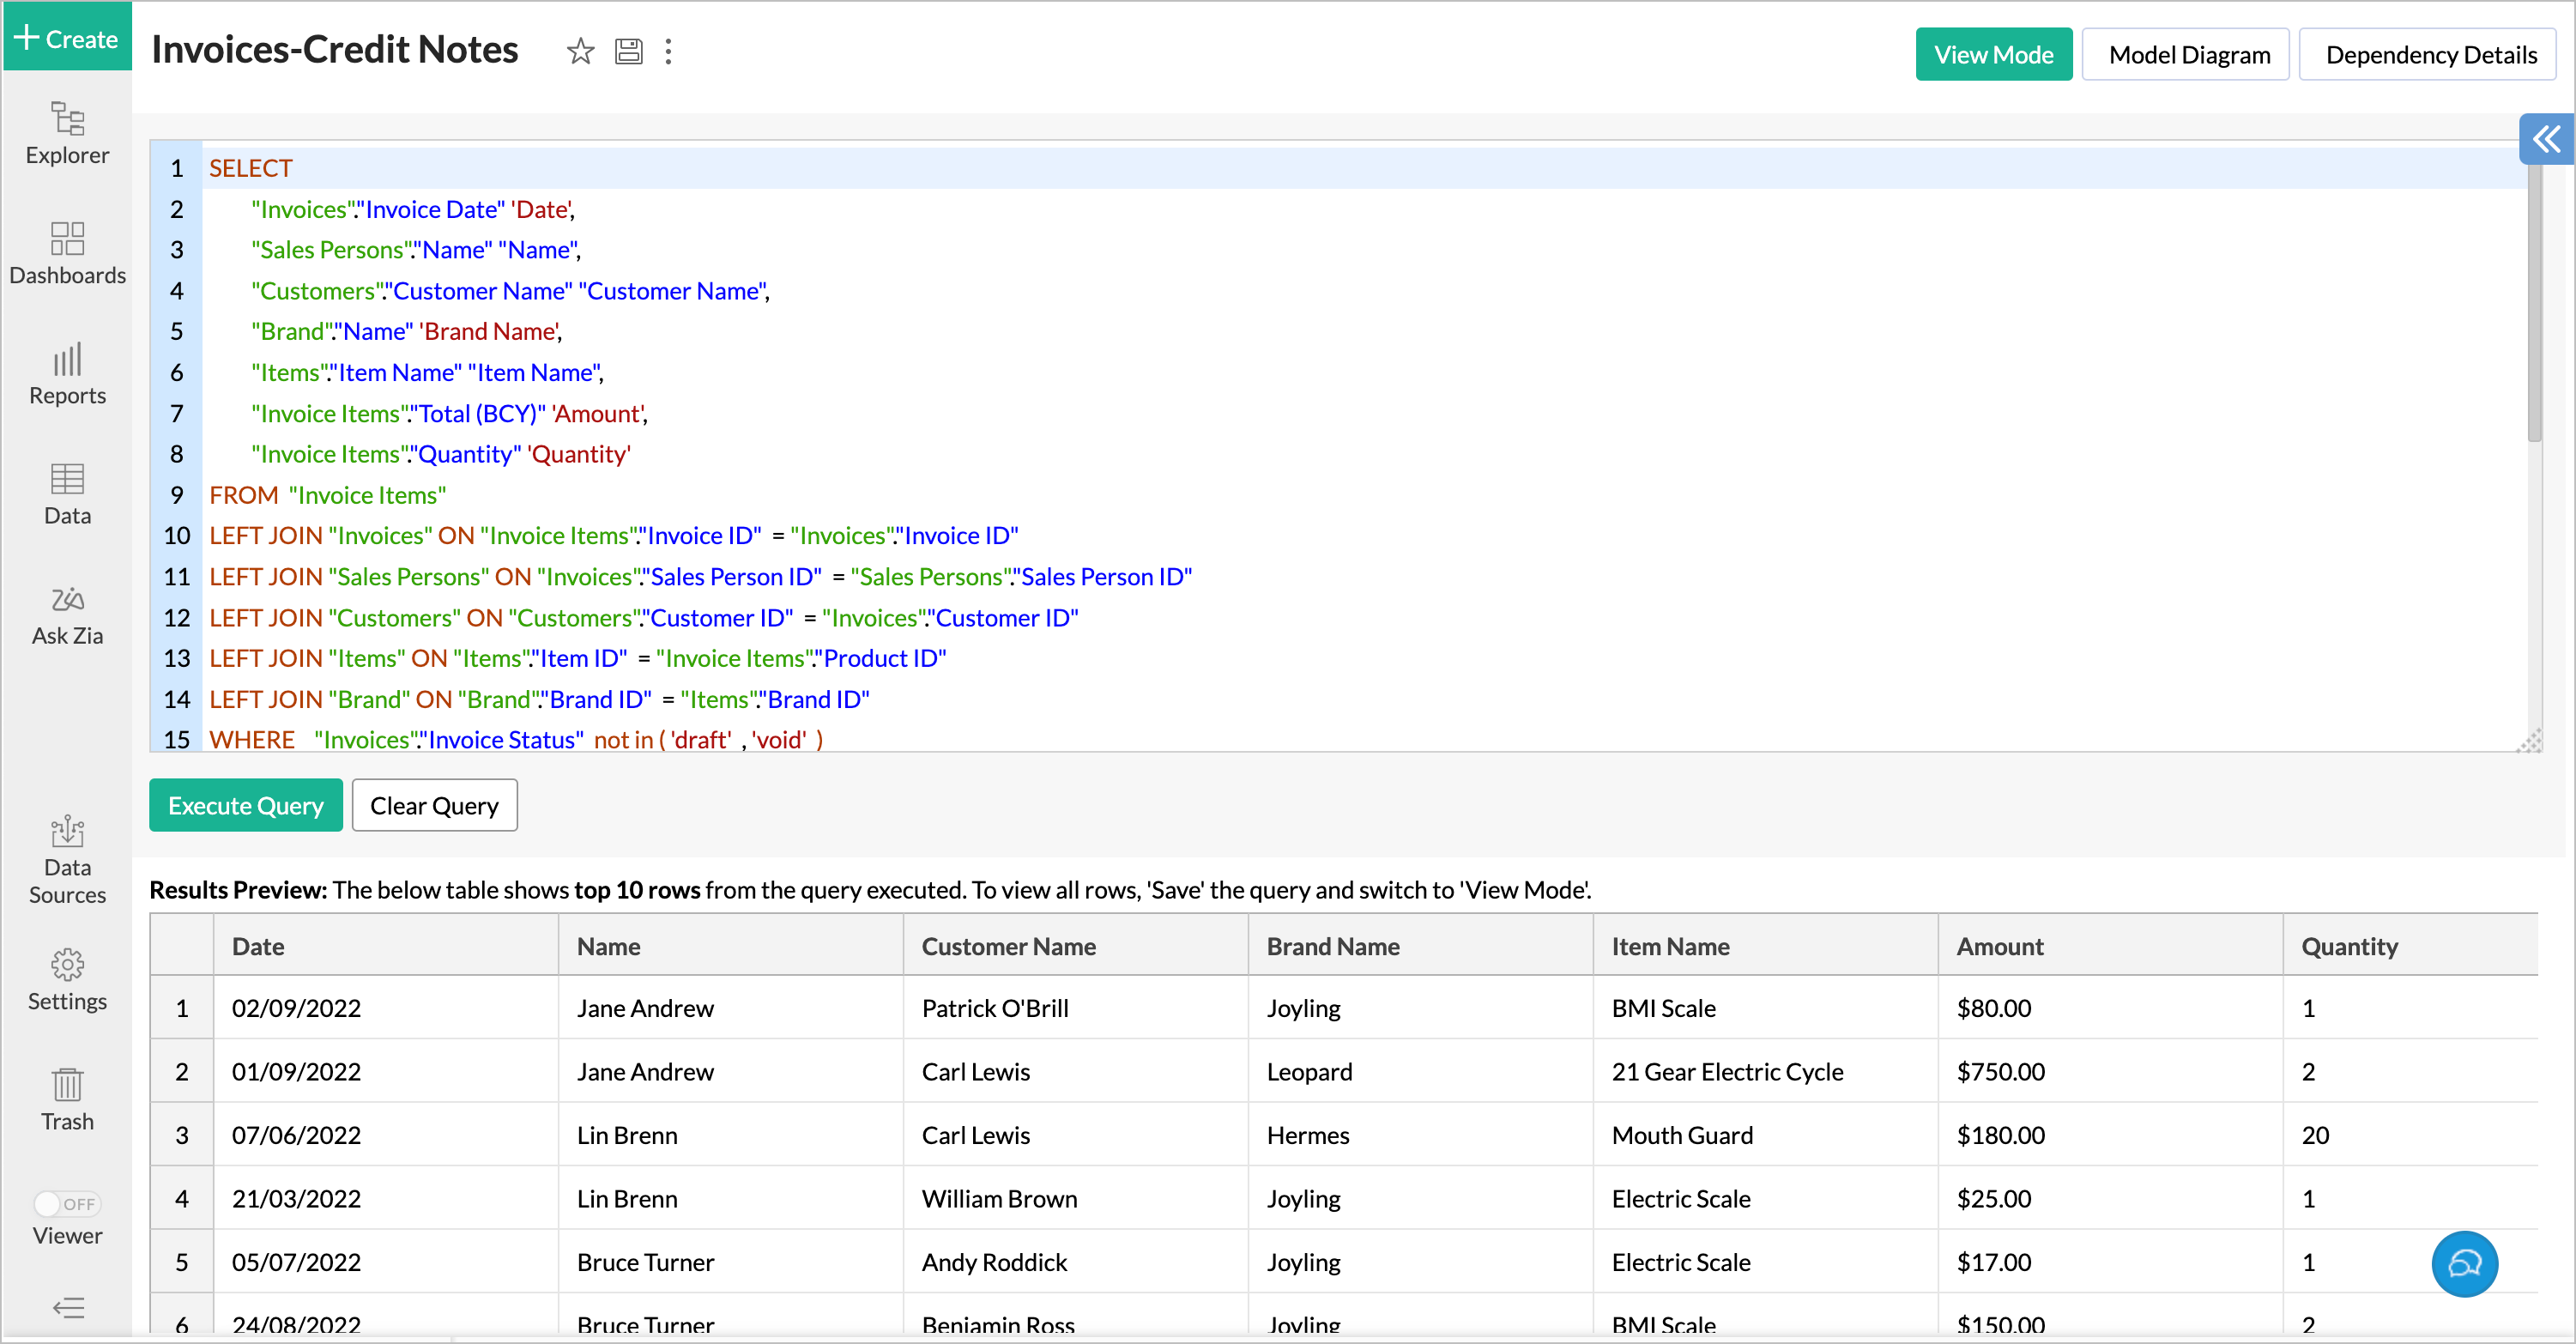
Join the Invoices and Credit Notes data to get the complete list of customer purchase items along with the brand. The following query allows you to do this.
|
SELECT
"Invoices". "Invoice Date" 'Date', "Sales Persons" . "Name" "Name", "Customers" . "Customer Name" "Customer Name" , "Brand" . "Name" 'Brand Name', "Items" . "Item Name" "Item Name", "Invoice Items" . "Total (BCY) " 'Amount', "Invoice Items" ."Quantity" 'Quantity' FROM "Invoice Items" LEFT JOIN "Invoices" ON "Invoice Items" . "Invoice ID" = "Invoices" . "Invoice ID" LEFT JOIN "Sales Persons" ON "Invoices" . "Sales Person ID" = "Sales Persons" . "Sales Person ID" LEFT JOIN "Customers" ON "Customers" . "Customer ID" = "Invoices" . "Customer ID" LEFT JOIN "Items" ON "Items" . "Item ID" = "Invoice Items" . "Product ID" LEFT JOIN "Brand" ON "Brand" . "Brand ID" = "Items". "Brand ID" WHERE "Invoices" . "Invoice Status" not in ( 'draft' , 'void' ) UNION ALL SELECT "Credit Notes". "Credit Note Date", "Sales Persons" . "Name" "Name", "Customers" . "Customer Name" "Customer Name", "Brand" . "Name" 'Brand Name', "Items". "Item Name" "Item Name", "Credit Note Items" . "Total", "Credit Note Items" ."Quantity" FROM "Credit Note Items" LEFT JOIN "Credit Notes" ON "Credit Note Items" . "CreditNotes ID" = " Credit Notes". "CreditNotes ID" LEFT JOIN "Sales Persons" ON "Credit Notes" . "Sales Person ID" = "Sales Persons" . "Sales Person ID" LEFT JOIN "Customers" ON "Customers" . "Customer ID" = "Credit Notes" . "Customer ID" LEFT JOIN "Items" ON "Items" . "Item ID" = "Credit Note Items" . "Product ID" LEFT JOIN "Brand" ON "Brand" . "Brand ID" = "Items" . "Brand ID" WHERE "Credit Notes" ."Credit Note Status" not in ( 'draft' , 'Void' ) |
Rank the Brands using Formulas
Create aggregate formulas over the above said query table to rank the brands. Here, we have ranked it based on brand popularity among customers and by sales amount
Rank the Brands using Formulas
Create aggregate formulas over the above said query table to rank the brands. Here, we have ranked it based on brand popularity among customers and by sales amount.
Rank Brand by Revenue
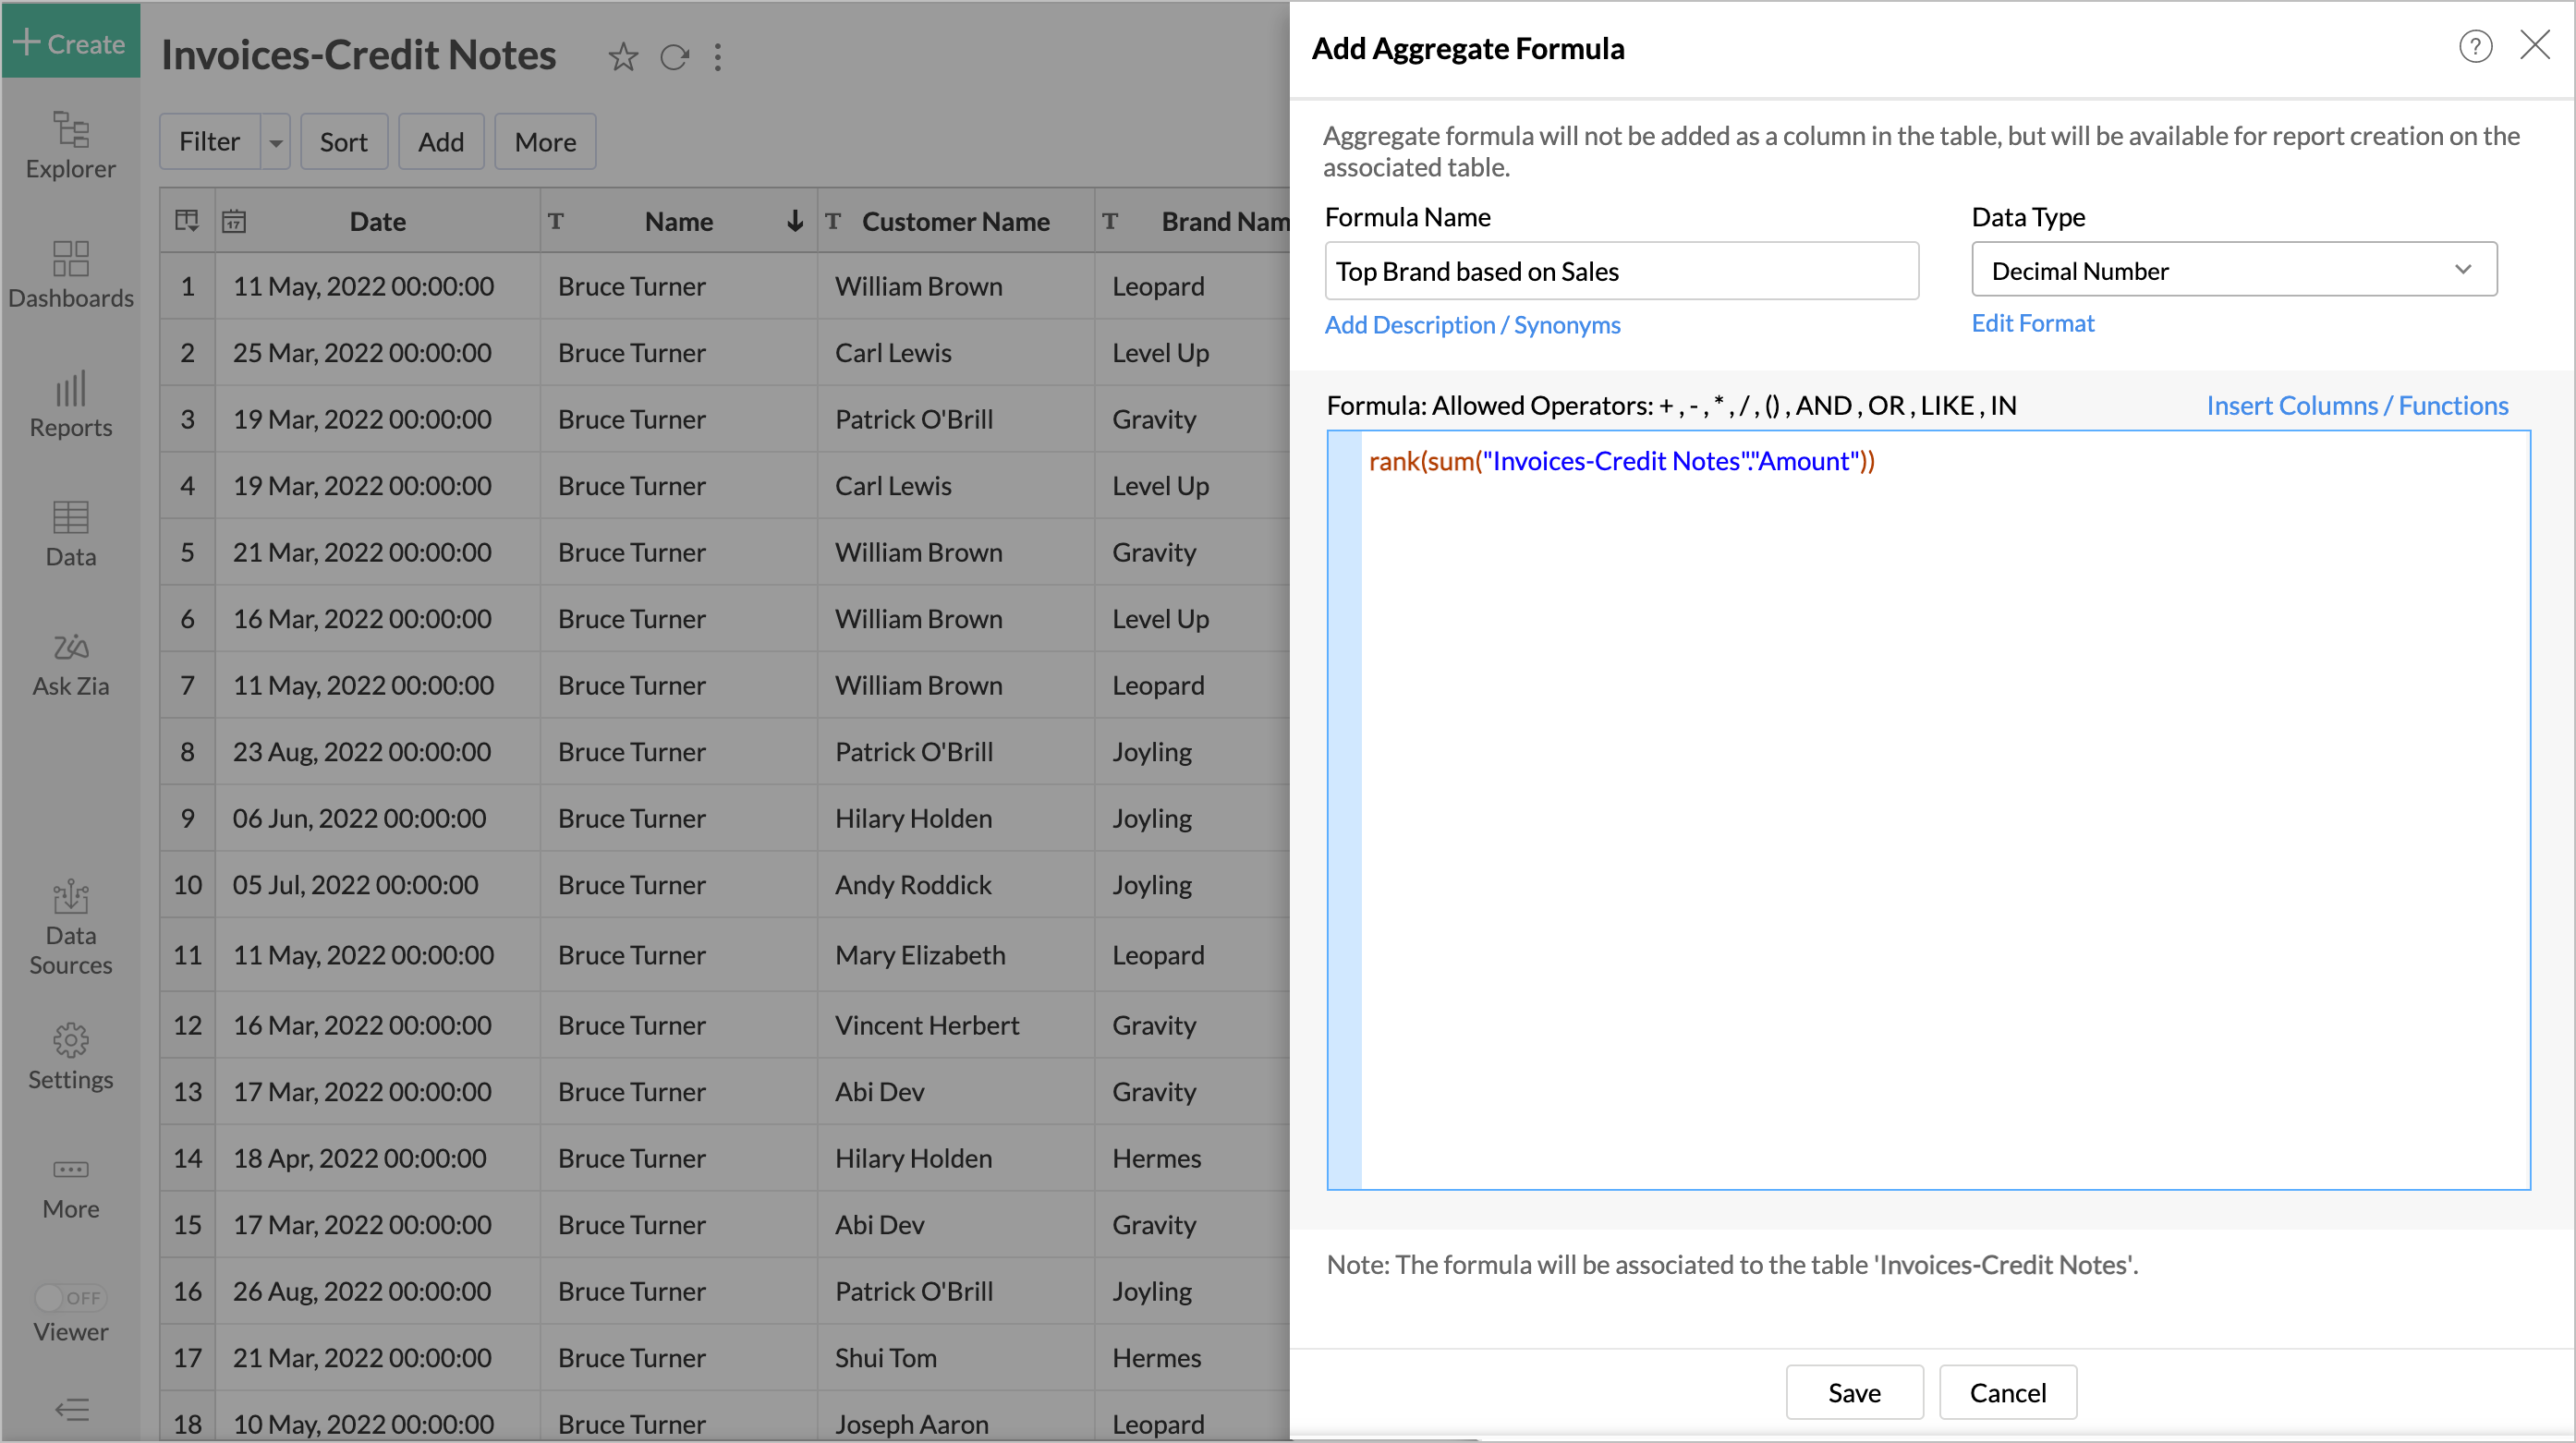
The following formula will rank the brand by the amount of your sales.
|
rank(sum ( "Invoices-Credit Notes"."Amount" )) |
Rank Brand by Popularity
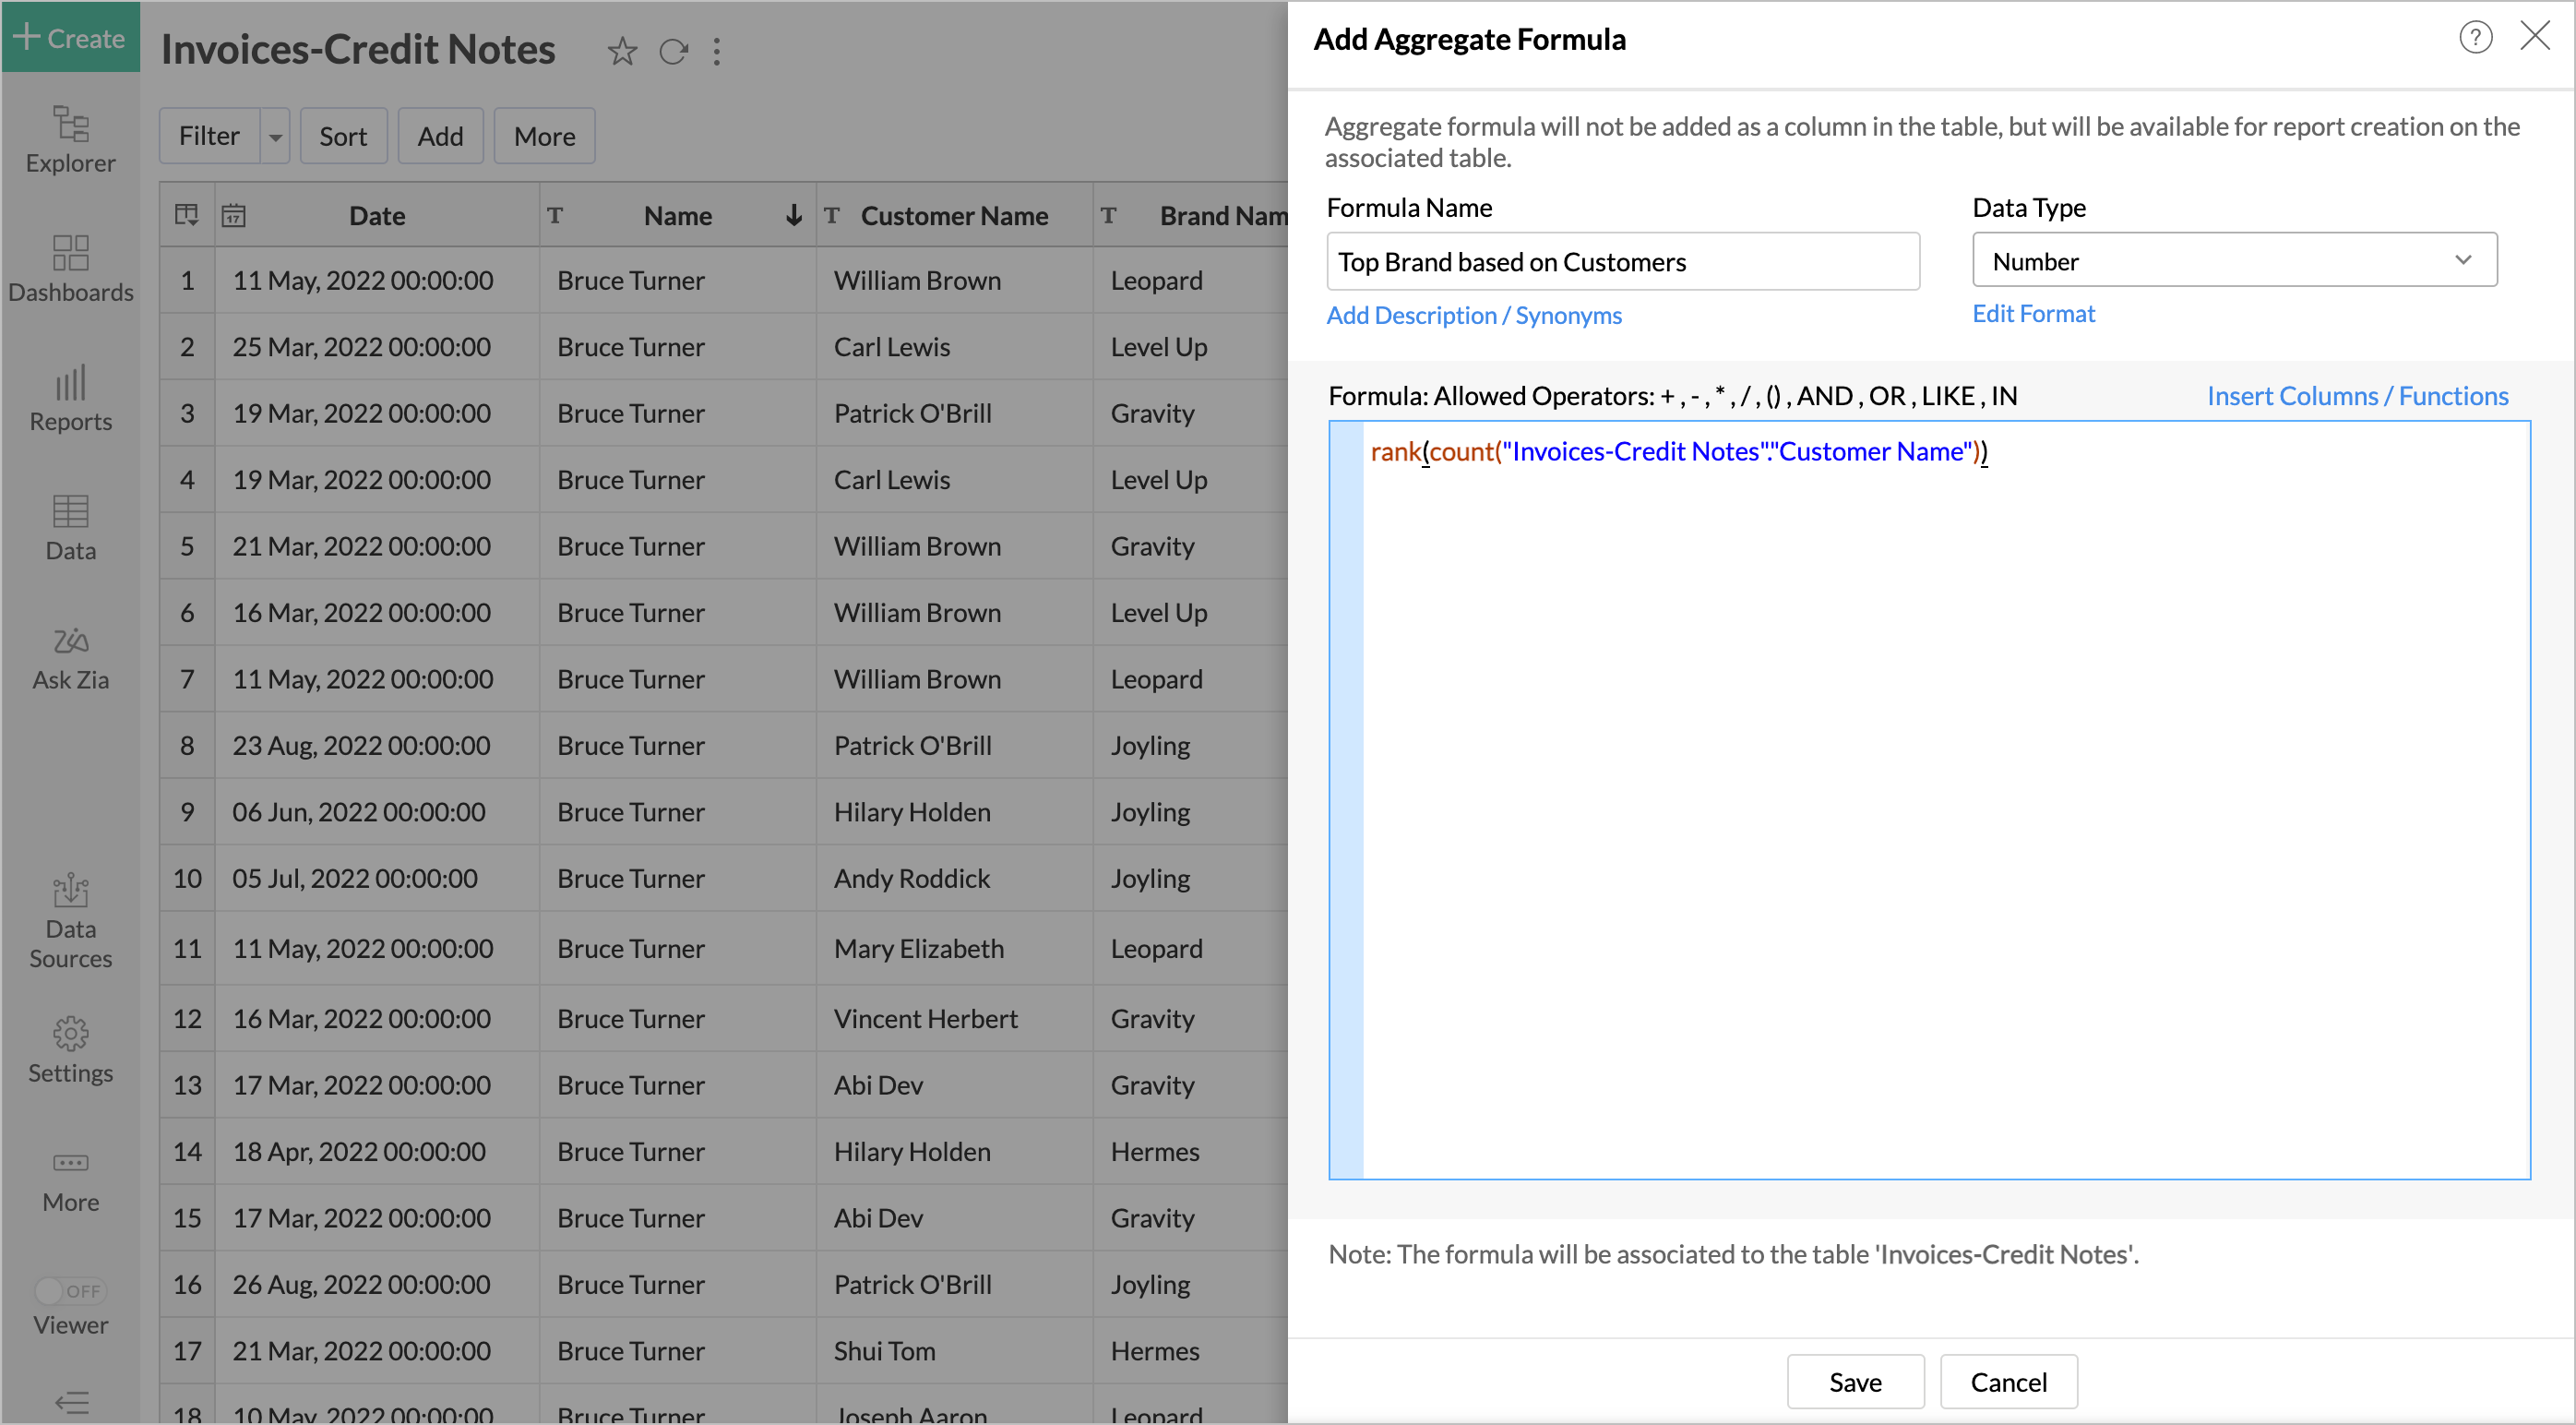
The following formula will rank the brand by the number of customers who picked it.
|
rank(count ( "Invoices-Credit Notes"."Customer Name" )) |
Creating Reports
Now you can create the customer preference reports over the query table we have created.
Top Brands by Revenue
This report gives the list of top brands by the revenue each brand has generated.
Follow the below steps to create the report.
- Open the query table we have created.
- Click Create > Pivot View . The Pivot Designer will open.
-
Add columns from the query table as follows.
- Row - Brand Name with Actual
-
Data
-
Top Brand based on Sales
with
Actual
and
Amount
with
Sum
.
-
Click the Click here to Generate Pivot.
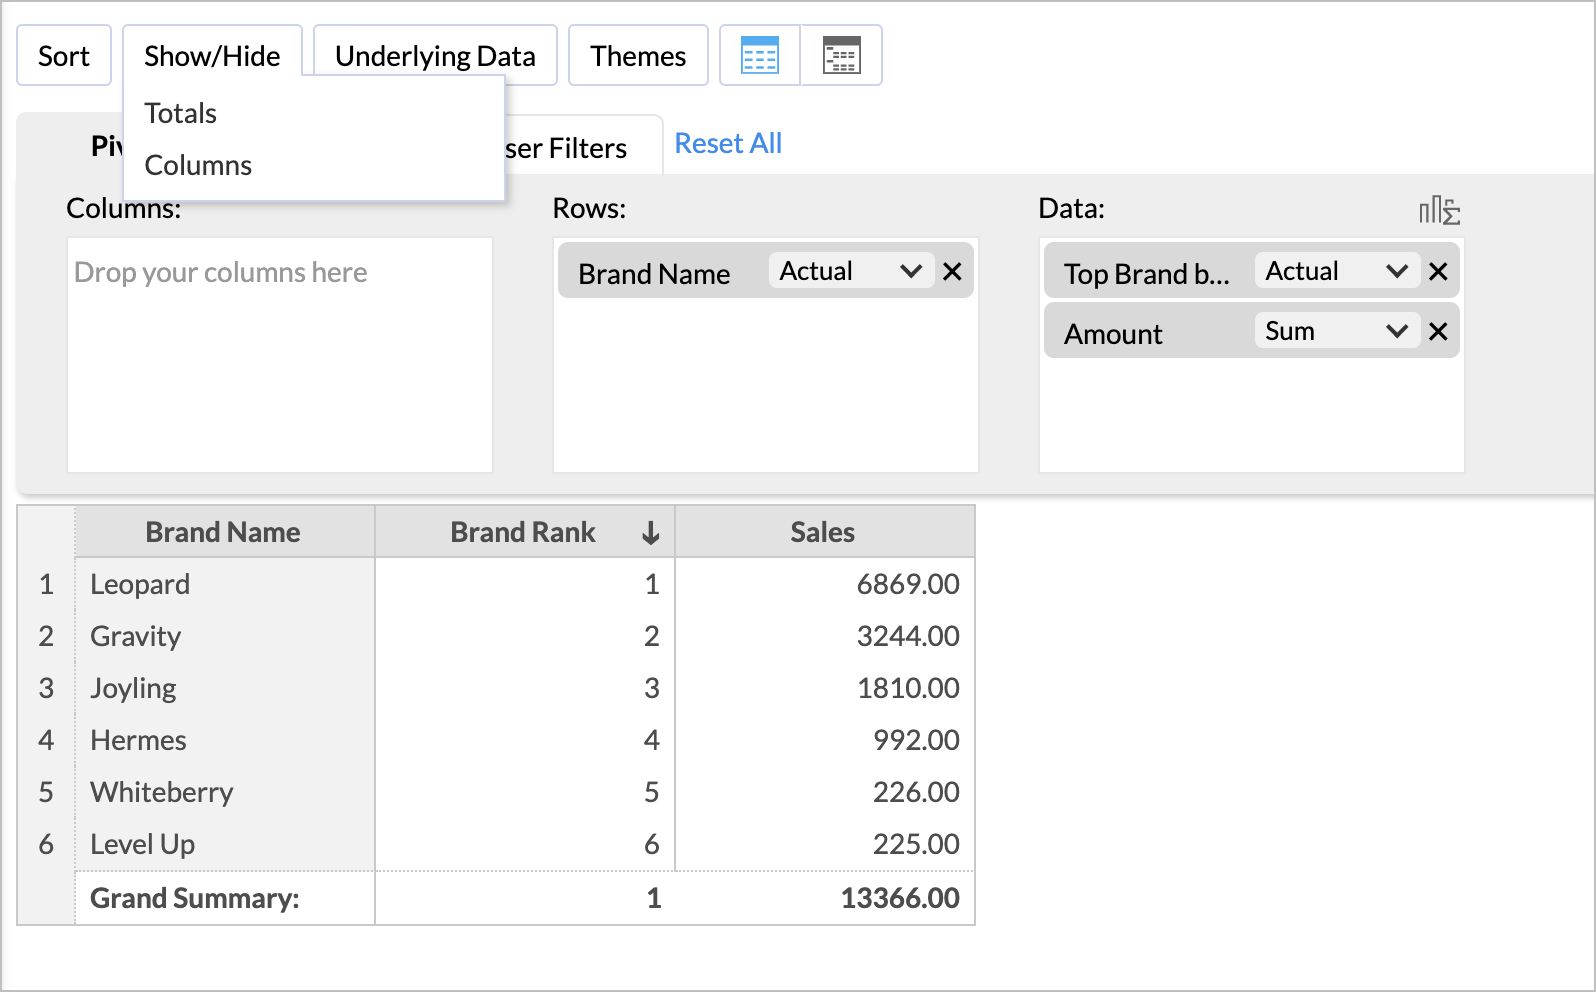
- Click the Show/Hide button and select Totals .
- Hide the Totals. The report will be generated.
Top Brands by Popularity
- Open the query table we have created.
- Click Create > Pivot View . The Pivot Designer will open.
-
Add columns from the query table as follows.
- Row - Brand Name with Actual
-
Data
-
Top Brand based on Customers
with
Actual and
-
Click the Click here to Generate Pivot.
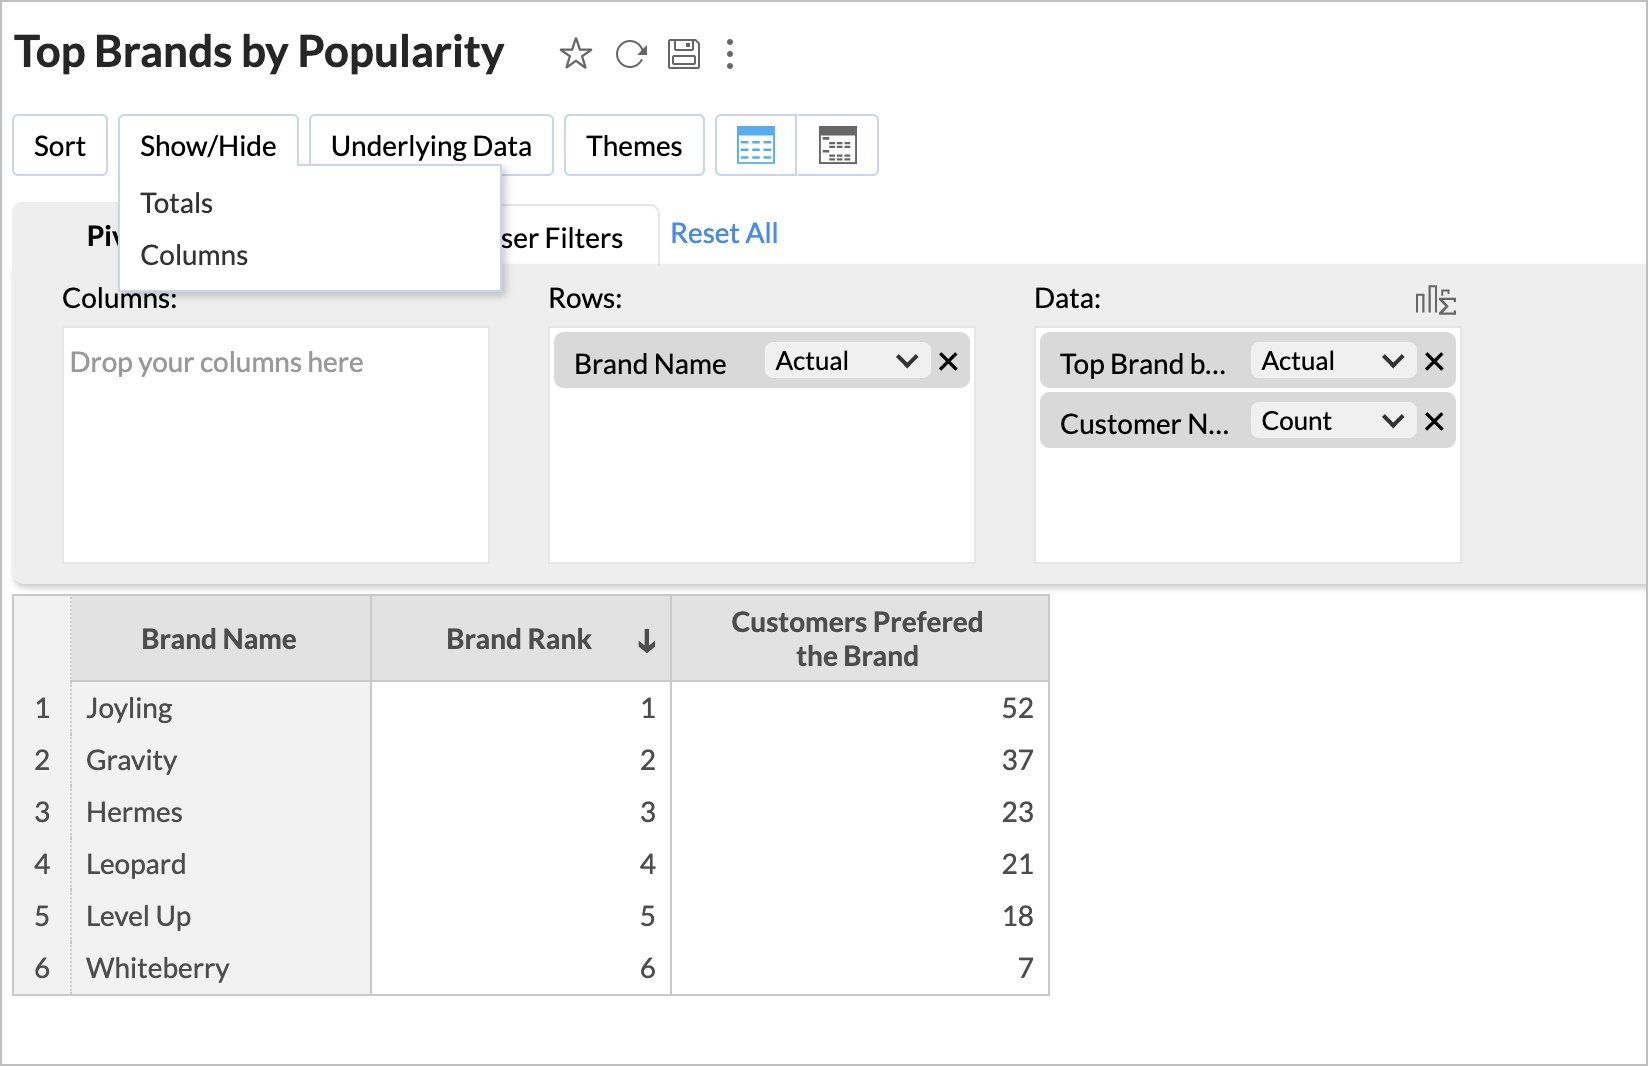
- Click the Show/Hide button and select Totals.
- Hide the Totals. The report will be generated.
Customer by Brands
- Open the query table we have created.
- Click Create > Pivot View . The Pivot Designer will open.
-
Add columns from the query table as follows.
- Row - Customer Name, Brand Name , and Item Name with Actual .
-
Data
-
Quantity
and
Amount
with
Sum
.
-
Click the
Click here to Generate Pivot
. Report will be generated.
Copy the sample workspace from the below url to learn more on this.
https://analytics.zoho.com/workspace/19601000018579001