Tip of the Week - Create KPI Widgets with Dynamic Images
Images are the favored medium and a powerful tool for communication as it is easy to process visual information far more efficiently than raw numbers and lengthy descriptions. With KPIs being the prime source to gauge progress and understand the health of any business, you can create widgets with dynamic images in Zoho Analytics. This week's tip discusses how to create KPI widgets with dynamic images.
A few scenarios where images could be used in KPI widgets:
-
E-commerce platforms can tangibly benefit from having images alongside data, as it makes product identification easier and helps spot differences in the wide product assortments.
-
In professional sports, players are the face of a team or a franchise, and including images on the dashboard can create an immersive experience and improve fans engagement.
Now, let's see how to use images as part of KPI widgets, using sample sales data. The data includes information about total sales in each city and the total quantity of products sold, along with city and product images.
To create reports and widgets with images,
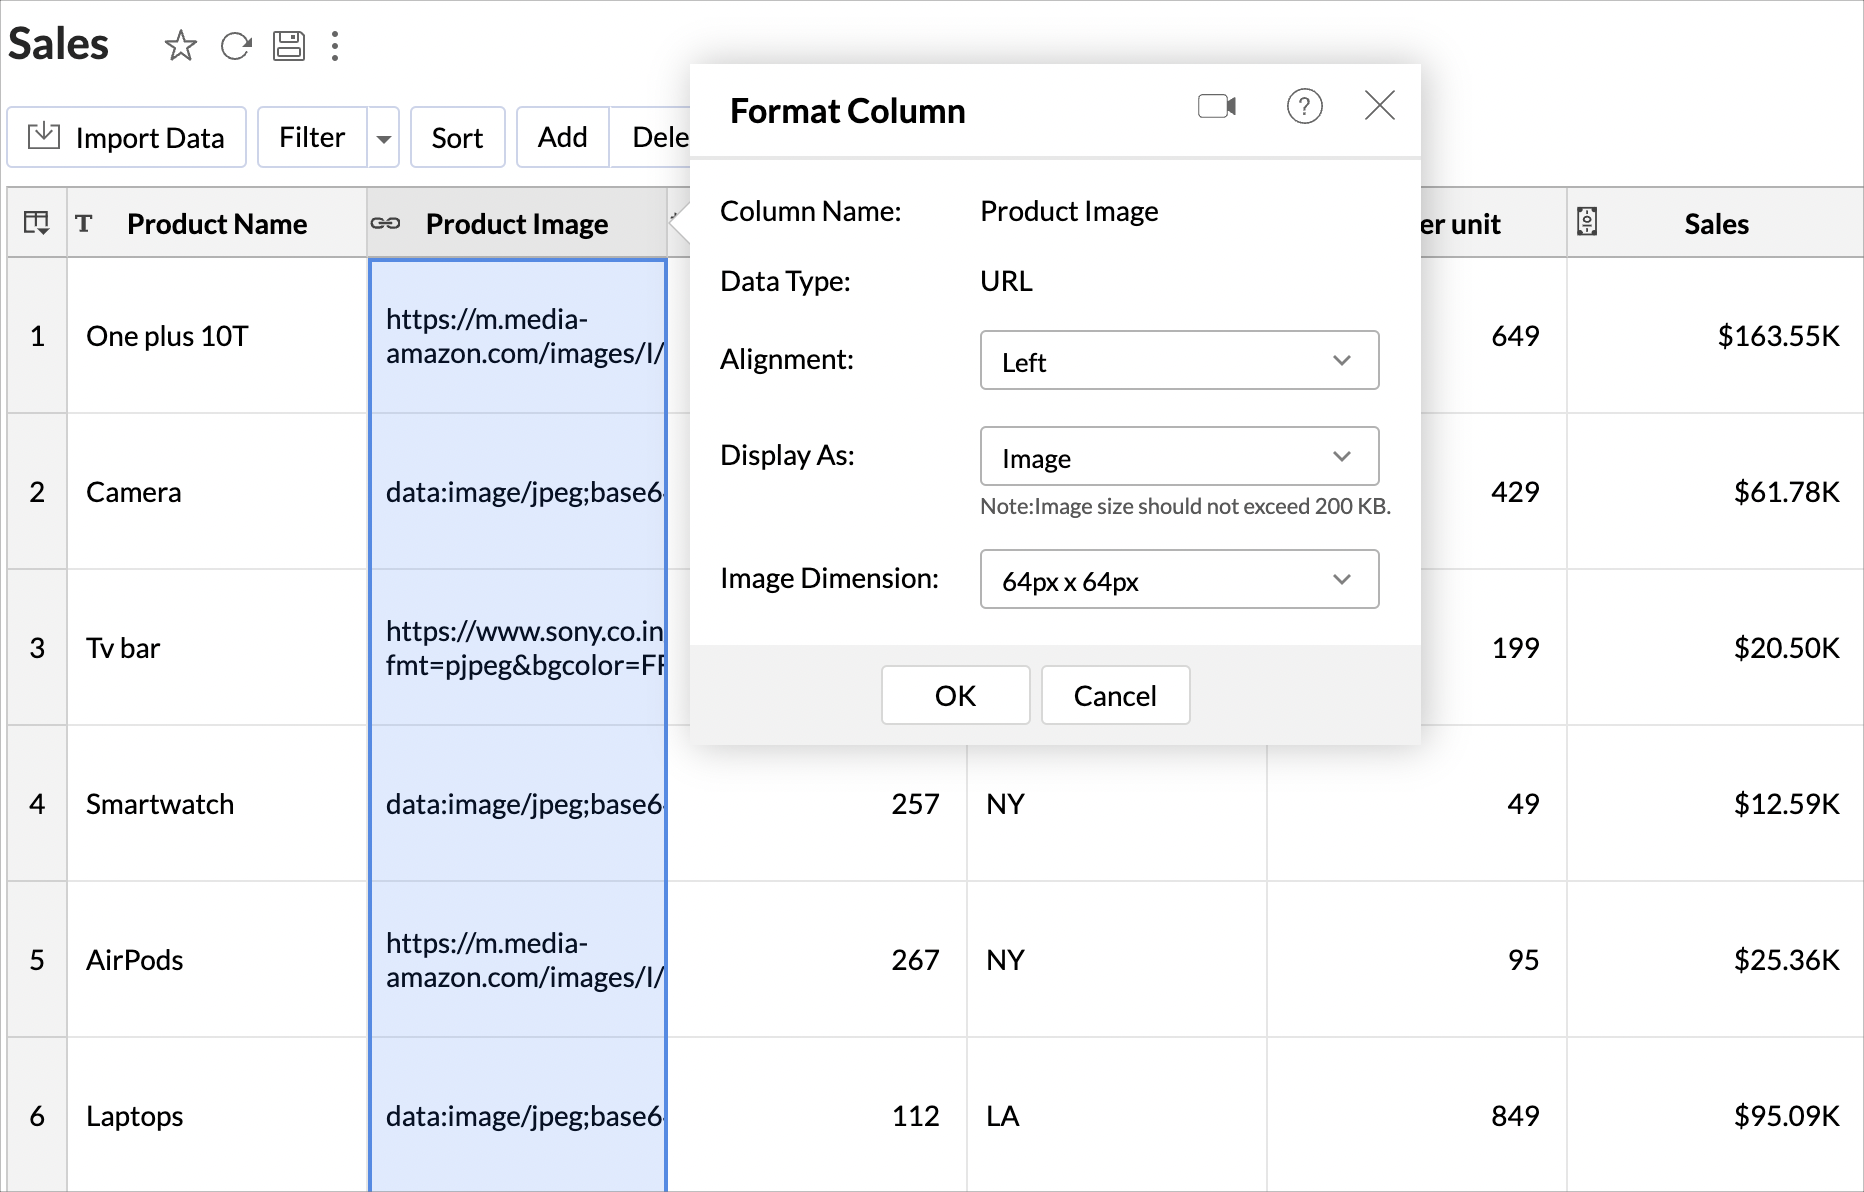
- You need a column that has the images (URLs of image addresses).
- Each image's size should not exceed 200KB.
-
The
Display As
option under the
Format Column
menu must be set to
Image.

Now let’s see how to create a widget that shows the city with the maximum sales.
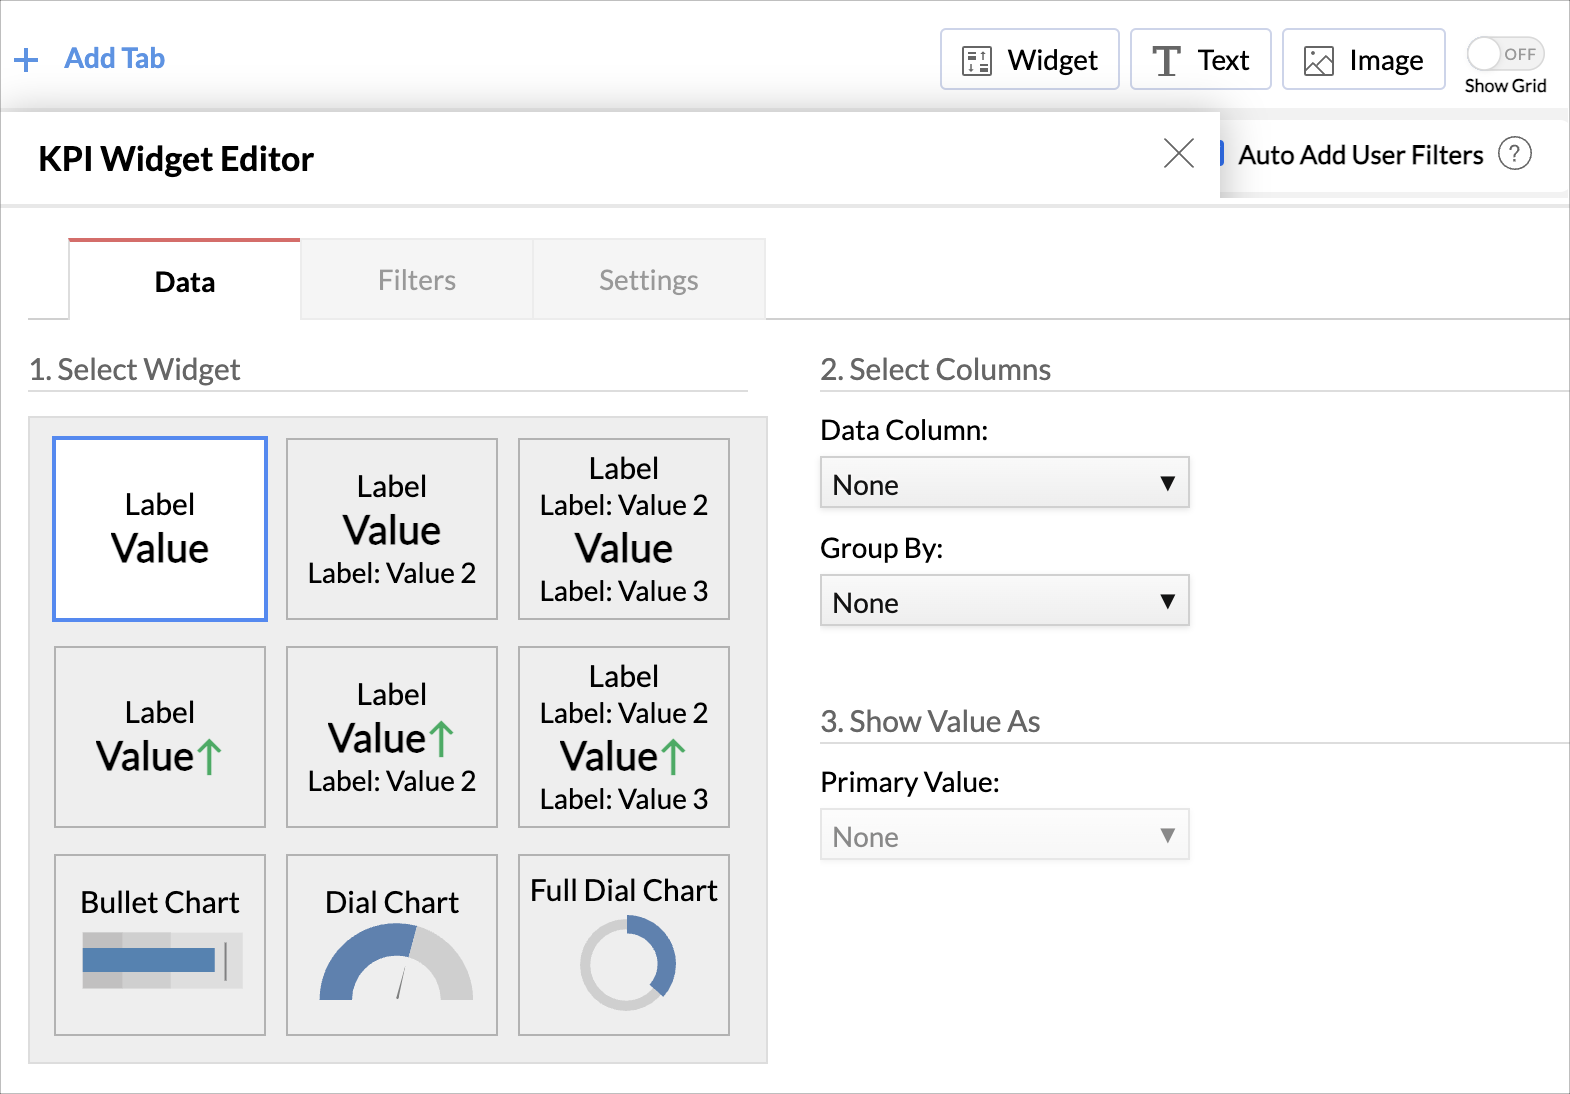
- Access the dashboard in Edit Design mode and click Widget.
- Select the widget type. Please note that images are supported only for numeric widgets.

- In the Select Columns section, choose the primary Data Column over which the calculation should be done. Here we choose the Sales column with the Sum function.
- Select the column that contains the images in the Group By field.
- Choose the Primary Value as Maximum.

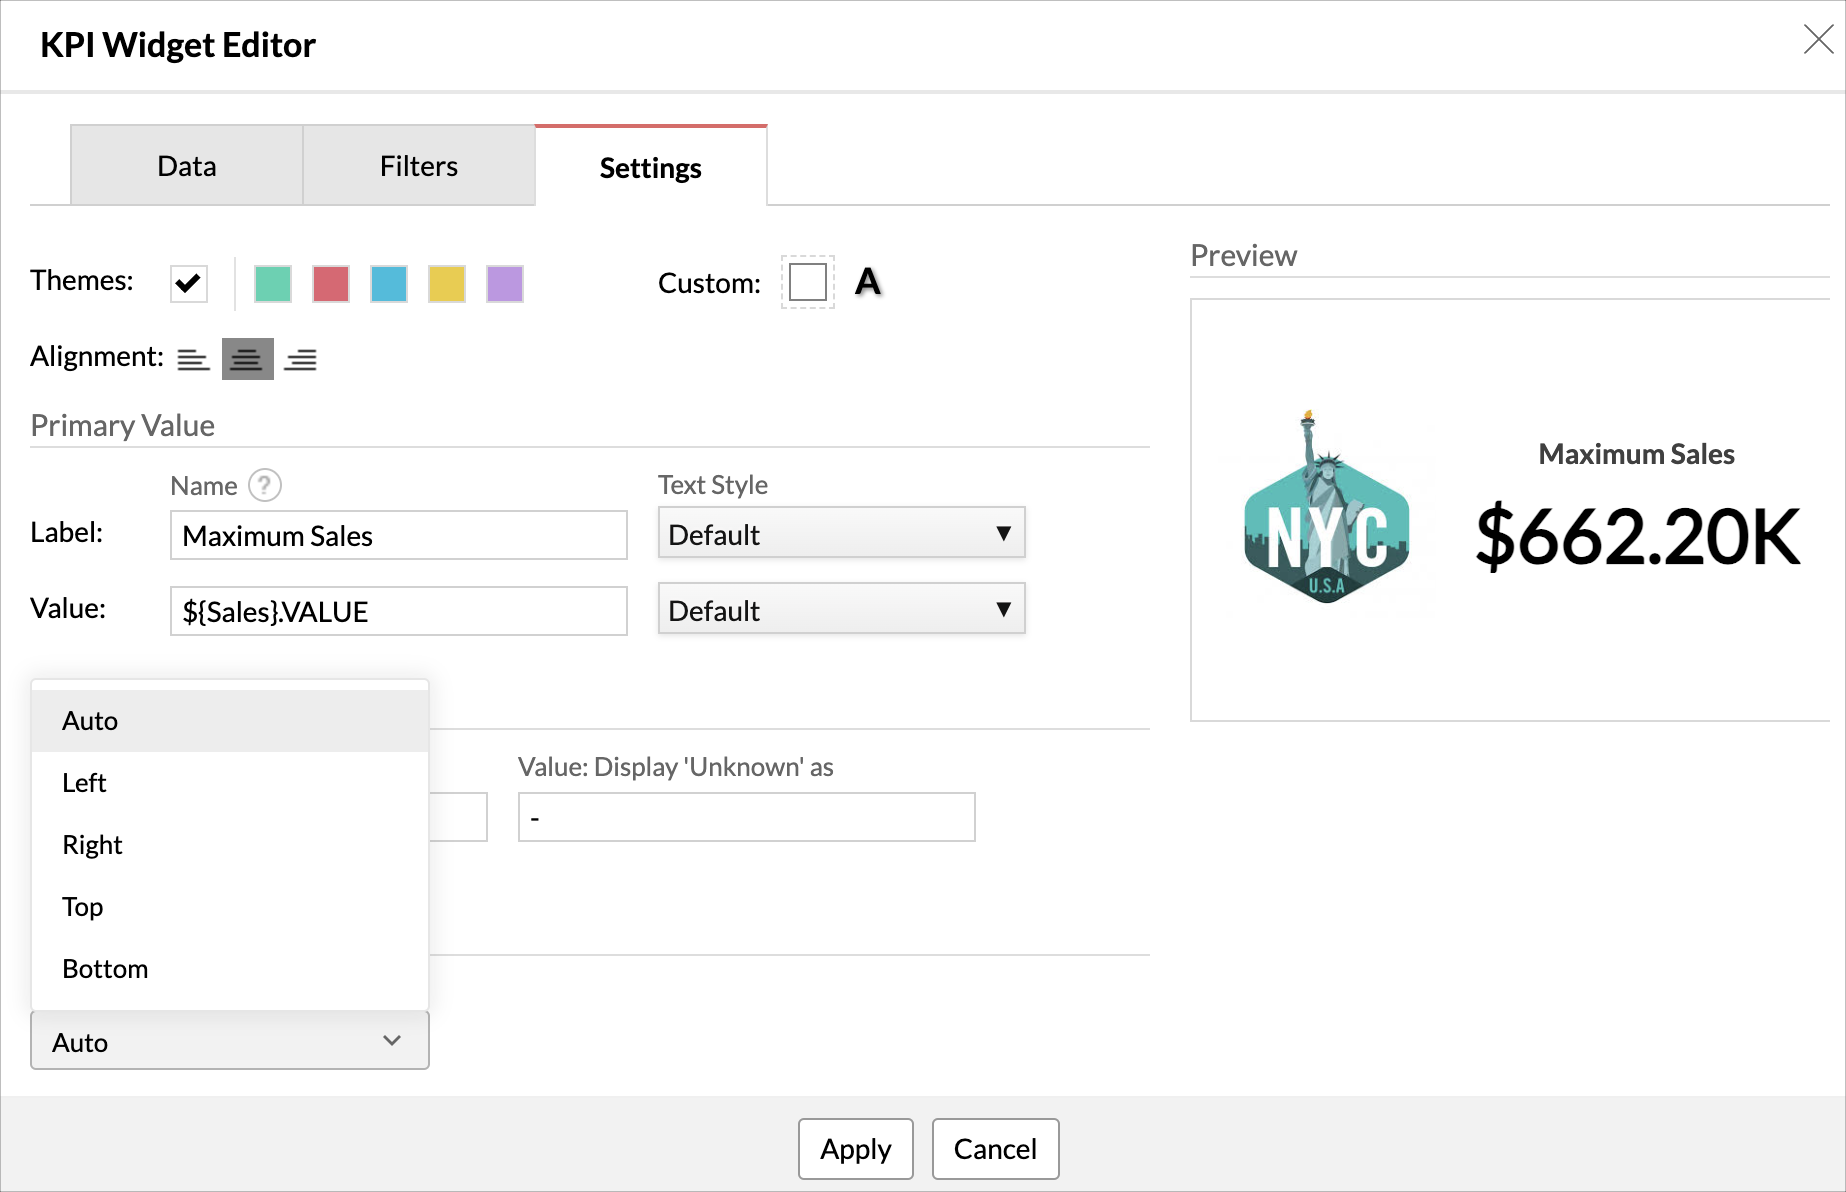
- You can customize the widget elements like the label alignment and the image position and click Apply.

- The widget will be added to the dashboard. Similarly, you can create widgets to know about the most and least sold product.

By using images as part of dashboards, you can elevate user interaction, make it easy for the users to interpret the data, and help craft a compelling narrative around the data.
Topic Participants
Nisha Angel J
Ockert Fourie
Jaisurya S
François Ehret
Juan
Sticky Posts
Zoho Analytics in 2024: A look back
Happy new year to everyone in the Zoho Analytics community! As we welcome 2025, here's a look back of important happenings in 2024.Announcing Zoho Analytics 6.0 Beta!
We are delighted to open up the next major version, Zoho Analytics 6.0 Beta! The new version comes packed with a wide range of functionalities for all persona, namely business users, data analysts, data engineers, and data scientists. Zoho Analytics teamWhat's New in Zoho Analytics - August 2024
Hello Users! We are back with the latest updates and enhancements made to Zoho Analytics. Keep reading to learn more about them. Connect to the data hosted in the cloud without allow-listing the IP addresses Utilize Zoho Databridge to connect to the dataWe are coming to your city! Zoho Analytics Community Meetup
Hello, business leaders and data enthusiasts! We are delighted to announce that registrations are now open for the ZUG meetups, and we can't wait for you to be a part of them. Our in-house analytics experts are geared up to lead discussions on constructingZoho Analytics: 2021 Look Back
As we start a new year in 2022, here's some of our top moments from 2021. Zoho Analytics in 2021
Recent Topics
Syncing with Google calendar, Tasks and Events
Is it possible to sync Zoho CRM calendar, task and events with Google Calendar's tasks and events. With the increasing adoption by many major tool suppliers to sync seamlessly with Google's offerings (for instance I use the excellent Any.do task planningMerge invoices
This has come up three times in a month of me using the system. a client whom i do work for on a regular bases asked me to invoice separate jobs on a single invoice. I would then go and cancel the old invoices and make a new one. It would be great if i could just select the invoices and click merge to create a single invoice.Pipeline stages for product-led growth (PLG) subscription services
(Estagios de pipeline com foco em serviço digital por assinatura (PLG)) Dear colleagues, I am writing to request assistance with a significant challenge I am currently facing. I manage a digital service that operates on a subscription-based model. I amMultiselect lookup in subform
It would be SO SO useful if subforms could support a multiselect look up field! Is this in the works??Zoho CRM for Email ( Microsoft add on app) Feb 25, 2025
We are currently experiencing issues with Zoho CRM for Outlook despite updating the Microsoft add on app and Zoho software to the latest versions. When working in Outlook on our Macs and PC's and 365 on the web, when we try to link an email in OutlookSheet View for Reports
We often need to filter our contacts in a way that is too complex for Custom Filters (which now allows filtering by Related Modules - amazing! - but doesn't allow for an *OR* relationship between the multiple filters) or Custom View (which does not yetFeature enhancement: Highlight rows based on a cell value
Hello Sheet users, We're excited to announce a new feature enhacement, shaped directly by your valuable feedback! As you might know, conditional formatting is a great tool for anyone dealing with large data sets. Previously, if you’ve ever wanted to drawUrgent: Unable to Receive OTP Email for Portal User Registration in Zoho Creator
I paid to enable the Portal User feature on 2/25, and followed the official instructions (Youtube video: Customer Portals | Zoho Creator) to set up the Portal User using my Gmail account. However, I am not receiving the OTP email and am unable to successfullyZoho not receiving verification email.
I developed a website registration page and need to send verification email. I am using sendinblue for sending out the verification emails. Somehow, the mail is not being received by the Zoho users. Gmail, outlook, yahoo domains works fine but when I try to send the mail to my Zoho account I am not able to receive the mail. Can you please let me know what might be the issue?Restore deleted spreadsheet
Hi all, I can not find my spreadsheet. It seems that my spreadsheet is deleted. Please, restore the spreadsheet. Thanks in advanceLookup fields can't be used for anything important
Hi It seems the lookup fields are mostly.... informative, you can at most link stuff between modules... You can't use lookup fields in blueprints, you can't use them in layout rules or anything... It that correct?Function to check frequency of customer ordering patterns
Hi, I'm no coder, so I thought I could make use of Chat GPT to generate some Deluge script to create a function that would check order frequency of our customers so that I could send an email if they go beyond their usual order pattern. Chat GPT and ClaudeBetter Control over Team Ordering and Display
Two feature requests for Zoho Desk team drop downs: The ability to change the order of teams, currently it's not in alphabetical order, which is confusing. I'm thinking a manual ordering via number or drag and drop, alphabetical order, and creation orderClear specific tag or tags from all leads
I'm looking for a way to clear a specific tag from all Leads. I have a function when a tag is added to a lead they are added to a campaign and their status is set to "invited". I need to find a method to remove the tag. If I try to delete the tag to clearCisco Webex Calling Intergration
Hi Guys, Our organisation is looking at a move from Salesforce to Zoho. We have found there is no support for Cisco Webex Calling however? Is there a way to enable this or are there any apps which can provide this? Thanks!Has Anyone Else Built a State Machine into a Function?
I'm in the process of building a state machine for lead lifecycle management within Zoho CRM, and I'm curious if anyone else has tried integrating a state machine into their Deluge functions, especially considering Zoho’s 12-function cap. I’ve managedIs there a way for a custom function to trigger a custom made email alert?
Hi Zoho Team, We have currently maxed out our 30 workflows in one of our department and we are trying to find ways to make it more efficient. We usually use our workflows to send automated email notifications per team leader for approval of tickets. IsUnified WhatsApp Number Management in Zoho Desk and SalesIQ
Dear Zoho Desk Support Team, We are currently utilizing both Zoho Desk and Zoho SalesIQ for our customer support operations. While both platforms offer WhatsApp integration, we are facing challenges due to the requirement of separate WhatsApp numbersMulti User Lookup field on the Zoho CRM iOS app.
Hello all! Hope you are all safe and sound. We have now brought in support for the Multi User Lookup field on the Zoho CRM mobile app. Below are the enhancements that are supported in this update: * Multi User Lookup field can be added through theHelp with Deluge Script in Zoho SalesIQ (Input Variables Always Null)
Hi everyone, I’m working on a Deluge script for Zoho SalesIQ, specifically for a block in Zobot. The script is supposed to: Check the visitor’s name when they start a chat. If the name is empty, return false; if a name is present, return true. However,Item/service subtotal
Just discovered & really pleased that we can drag to re-order the line items in Sales orders & Invoices, a very nice feature which doesn't seem to be documented? It would be nice to be able to insert a subtotal as a line item to complete this great featureHide/Show Certain Fields When Creating/Editing Invoices, Estimates, Etc.
Hello there, I would like the ability to hide or show certain fields for different employees/roles in my company when they are creating or editing invoices, estimates, etc.. Most of the time, we don't use half of the fields shown on the create/edit invoiceIs there a way to make an account inactive in ZoHo Desk
We have a few Clients "Accounts" that we no longer do business with. It would be beneficial for them to not show up in lists. However, we want to go back and view tickets, time, etc.Any way to Associate a Recurring Invoice with Deal/Potential in Zoho CRM
When we create an Invoice in Zoho Books, we have the option to associate that invoice with a Potential/Deal that is tied to that same customer. Can we do the same thing with Recurring Invoices? When creating a Recurring Invoice, I want to be able to AssociateSSO/SAML
Question - how are you guys handling SSO for Desk? It seems the only options lead back to ADFS which is a dying technology, stupidly complicated to set up and configure (I mean, you can put that on your resume) and seems like overkill for SSO when AAD does it so much better and effortlessly. We want to have our clients have SSO to log into our support portal and we want our Agents to have SSO as well. I shouldn't have to expose our server, turn on ADFS, configure it, install multiple clients (SyncAre downloadable product available in Zoho Commerce
Hi all. We're considering switching to Zoho Commerce for our shop, but we sell software and remote services. Is there a features for downloadable products? I can't find any information about this. Thank you very much AliceAsk the Experts 17: Elevate Customer Communication With Multichannel & Instant Messaging
Hello Everyone, Get ready for the opportunity to interact with Zoho Desk specialists! This month, we’re diving into Multichannel Operations, helping you manage customer interactions across various platforms seamlessly. Why Join? Customers reach out throughZOHO DESK
I use Outlook Exchange to receive emails and want to forward them to Zoho Desk for better management. Additionally, I want to reply to emails in Zoho Desk and have them sent to customers via Outlook Exchange, but I don’t know how to configure it.Automating Custom Web Link Messages to Customers via Instant Messaging in Zoho Desk
Hello, I am looking for assistance with Zoho Desk's Instant Messaging feature. Is there a way to automate the sending of a custom web link to customers every day at 6:30 PM? Any guidance or suggestions on how to achieve this would be greatly appreciated.Exciting Update: Multi WhatsApp Business Account (WABA) Support Now Available in SalesIQ!
We’re pleased to share an important update that will enhance the way you manage your WhatsApp Business accounts (WABAs) within SalesIQ. With the launch of Multi WABA support, you can now connect and manage multiple brands more effectively, each underAn error occurred while uploading the attachment.
From the image below, attaching files is not possible via the website but is supported through the Mobile App.One time offer in Zoho Campaigns
Hello! I have an idea to improve my sales. I would like to make a "one time offer" in Zoho Campaigns with a clock that will count down the bid validity period. Is it possible? Regards.How to Initiate WhatsApp Message on SalesIQ?
I've just activated a Business WhatsApp phone number through SalesIQ because of its touted omnichannel chat approach. Sounds exciting. I understand that when a customer sends me a WA message, I can reply to it on SalesIQ and keep the chat going, perfect.Multiple self client instances
there a couple of details that deserve clarification / improvement in Zoho's OAuth 2: 1. for building true server apps - cloud to cloud REST - one has to choose Self Client when creating a new instance in API Console; Server-based Appplications is slightlyWorkdrive Oauth2 Token Isn't Refreshing
I have set up oauth for a bunch of zoho apis and have never had a problem with oauth. With workdrive i am using the exact same template i usually use for the other zoho apps and it is not working. All requests will work for the first hour then stops soZoho Desk - Delete an email conversation
When using Zoho support desk I see an option to delete and edit conversations that are comments, BUT if the conversation was automatically added as a conversation from an email, then the option to delete it seems not to be available. Is there a way toOrganizational Emails Send through Email Relay Server
Hello, It would be great if the the Organizational Emails could send through the Email Relay Server as well. I often need to send email as someone else and since we use the GMail API option I have to use the organizational emails to do this. We use Postmark for our Email Relay Server to increase deliver-ability which is something that we have had issues with when sending everything through Zohos servers. Also with postmark there is no need for each organizational email to have its own credentialsEmoji support in workdrive
Hello, We are using emojis in our filenames and folder to help visually find relevant data. Currently Workdrive is stripping out emojis and the rest of the filename (along with the suffix), making the file unreadable when they are synchronized with desktop.What is a 'user' in Zoho Surveys, and can I have multiple Offline Kiosks running?
Is a 'user' the amount of people that can make and edit surveys on the website? I basically just want to know if I am able to have multiple Offline Kiosks running on multiple devices at the same time. Either on the Basic or Plus plan which both have 1Fundation / Non profit : Could you help ?
Hi, We're about to handle a Medical research fundation, non profitable structure, what kind of prices could we hope from you ? Could you help us ? We would need Survey, automated campaign and ZIA Thanks in advanceNext Page