Visualize your data with a new set of charts: Treemap, Butterfly, Sankey, and Cluster charts in Zoho CRM
Dear customers,
When it comes to analytics, it's not just about the numbers; it's about understanding the story behind them.
With that philosophy in mind, we’re excited to introduce a line of representations to the existing array of chart types in Zoho CRM: Treemap, butterfly, sankey and cluster charts. Let's go!
Treemaps
Treemap charts are used to visually represent hierarchical datasets in a rectangular layout. It aligns its parent categories as larger tiles with their sub-categories nested within them. The size of each tile is proportional to its corresponding value, making it easy to compare different segments within the hierarchy.
This is how a treemap chart looks:

These structured data representations help you understand overall performance and contributions, as well as compare participating entities at a glance.
Unlike traditional bar charts or pie charts, treemaps can be used if your datasets are large and exhibit parent-child relationships.
Here are some examples to better understand their usage:
Comparing revenue distribution between functions
A company's revenue is distributed among its functions before it gets further disbursed to its employees. Treemap charts can be used to depict this distribution and compare it between functions. As you can see below, the hierarchy can be represented as a treemap to compare it directly with other functions:

The hierarchy at the top shows just the numbers and levels, but the treemap chart represents the numbers proportionally, allowing leaders to visualize the difference in distribution.
Interpretation: As you can easily see in the treemap, sales and marketing receive the same amount of revenue, while engineering is given significantly more than the other two.
Likewise, with treemap charts, you can:
- Compare popular lead sources with lead counts is the measure and lead source being the participating entity—a classic single-grouping configuration.
- View cost savings achieved across departments. With the departments as the grouping parameters and the cost saved as the measured amount, the chart lays out all the departments as tiles in proportion, based on money saved.
- Compare ad spends across channels, where channels are the parent grouping and ad spend is the measured unit.
Butterfly
Butterfly charts are used to compare two related datasets side-by-side, resulting in a representation that looks like a butterfly or tornado.
Now, how does it differ from bar charts?
The standard bar chart can compare two entities for a given measure. Say, you are comparing the performance of Mary and Charles. The two users' data is represented using bars, and the length will denote their performances. But, when it comes to comparing their performances over a period or their contribution across different stages, a bar chart is not sufficient.


With butterfly charts, you can:
- Compare revenue between two of your branches each month. With branches being compared for sum of sales revenue, grouped by closing date.
- Compare the performance of two reps in a given quarter. Compared between two users for average of amount of deals, grouped by closing date until today.
In addition to the user-based comparison above, butterfly charts are well-suited to visualizing other types of data comparisons, like:
- Picklist-based comparisons
- Duration-based comparisons
- Aggregate-based comparisons
Business scenario
Comparing the number of deals closed for each lead sources: Duration-based comparison
You can identify the productive lead source by comparing the number of deal closures for every lead source in your organization based on their closing week.

Analyzing effective sales methodology, inbound vs. outbound: Picklist-based comparison
Businesses use both inbound and outbound lead generation strategies, and each of these methods can reap different results based on the season and occasion. By comparing inbound versus outbound each month, you can identify which works best at what time.

Analyze the amount versus the expected revenue between accounts: Aggregate-based comparison
Expected revenue is a result of a deal's progression in the sales pipeline. Comparing the amount versus their expected revenue will not only help visualize the expected revenue of participating accounts but also indicate the accounts' stage in the sales pipeline.

Sankey
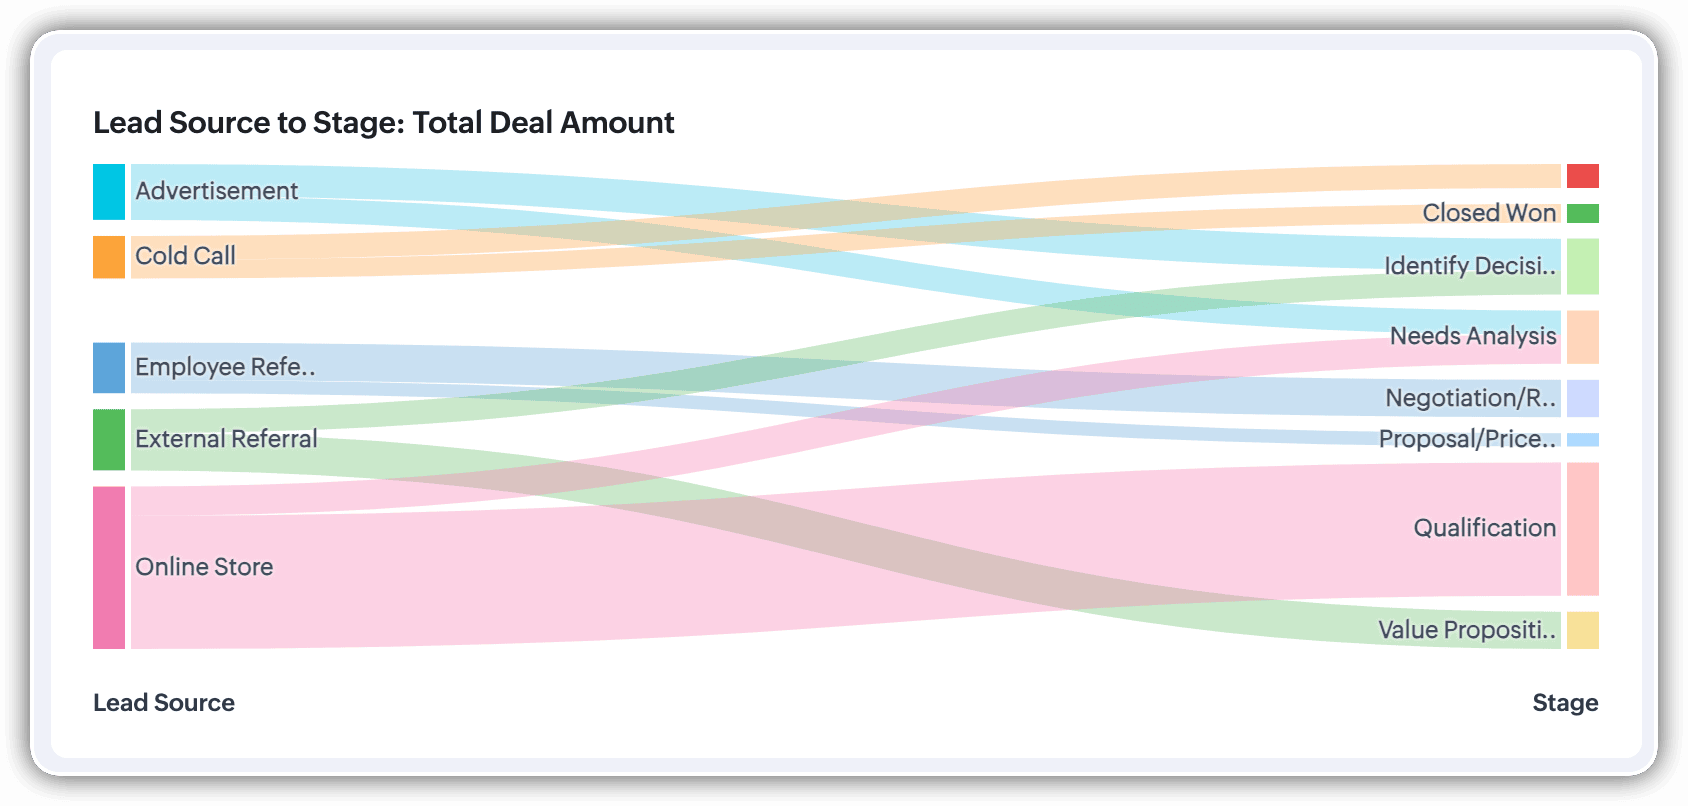
A Sankey Chart is designed to visualize the movement of data across different data groups. Unlike traditional charts—such as bar, column, pie, or donut—that mainly provide a static distribution of values, the Sankey Chart focuses on illustrating the flow between multiple segments or grouping fields. This makes it an ideal choice when you want to track how values (like lead counts, revenue, or deal statuses) move from one category to the next.

Key features
- Flow visualization: With the Sankey Chart, you can observe the movement of data between different groups.
- Multiple grouping fields: This chart works best when you have at least two grouping fields. You can go even further and add a third grouping to see an even more detailed mapping of your data flow.
- Simple configuration: The configuration for the Sankey Chart is as simple as any other chart type in Analytics.
Business scenarios:
Imagine you’re a sales manager trying to get a better handle on your team’s performance and your company’s pipeline. You want to understand not just how many deals are coming in, but also which sources are contributing the most value—and how those deals are progressing through different sales stages.
Let’s say you want to understand which lead sources are driving the most deal activity and how those deals progress through the pipeline. You can create a Sankey chart that maps the count of deals from Lead Source to Stage.

After analyzing the chart, you might notice that Online Store brings in a high volume of early-stage deals, while sources like External Referral contribute fewer deals that are more likely to reach advanced stages like Proposal or Negotiation.
This insight helps you prioritize nurturing the most profitable channels.
Sankey charts can also be helpful in other operational scenarios where understanding transitions across stages or teams is essential:
- Regional revenue distribution: Visualize how revenue flows across different regions, product categories, and their corresponding annual revenue. This helps you compare which regions contribute the most to each product line and where your high-value segments lie.
- Ticket handling flow: Visualize the flow of support tickets from their origin channel to internal departments and finally to resolution statuses. This can reveal workload imbalances or common points of delay in your support process.
Cluster
A cluster chart is similar to stacked column charts, but instead of stacking horizontally, the data is represented as vertical bars. As you create a column chart with multiple groupings, you can change the type of column chart to a cluster chart to achieve this representation.

In the above image, you can see the stacked column chart compares the number of lead conversions based on popular sources between countries. The stacks appearing on top of existing stacks ask you to calibrate the record count (y-axis) based on the previous stacks, which can lead to inaccurate interpretations. In this case, a cluster representation will paint a clearer picture of the analyses.
Other minor enhancements:
In addition to the three charts we mentioned above, we've also made the following minor changes:
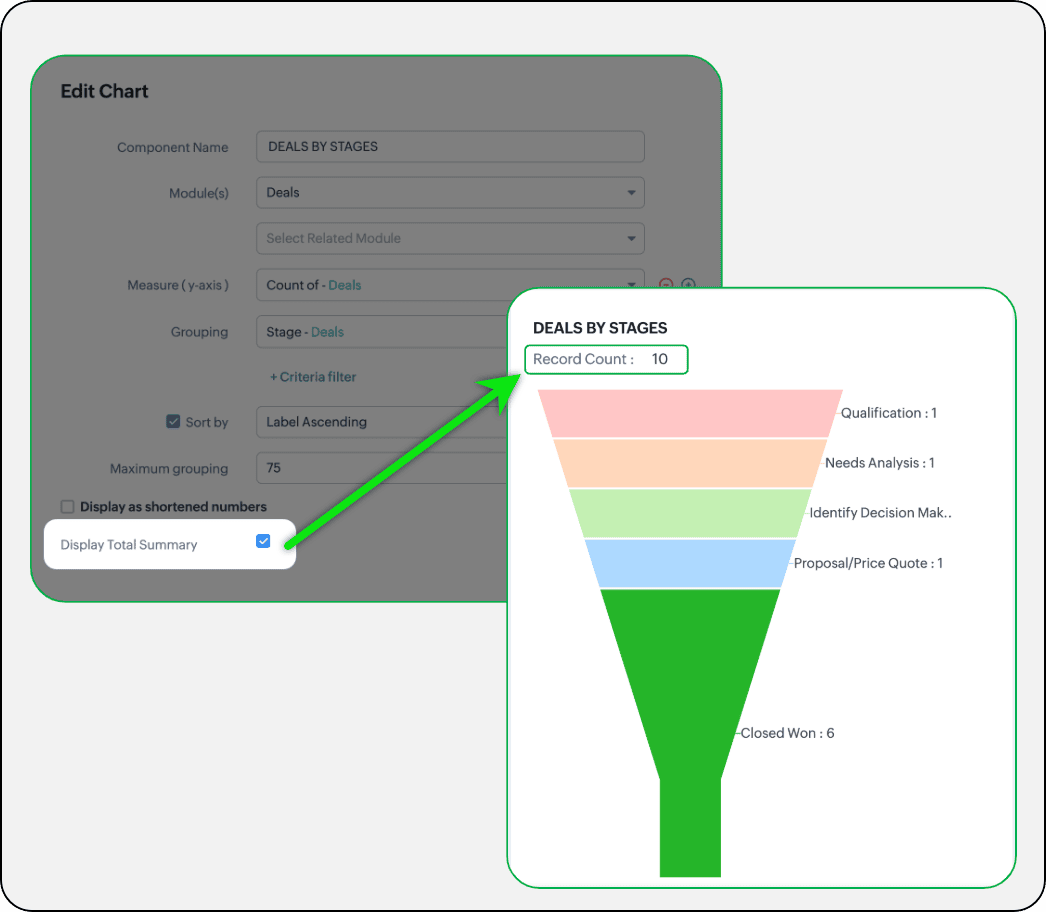
- Display total summary: Thus far, for all charts, each participating measure included labels. Now, to better understand overall contributions, a check box to display the total summary is provided under More options on the Chart Configuration page. Based on the configuration, the total revenue or the rolled-up quantities will be prominently displayed.
- Merge Y-axis: For charts that use two y-axis measurements, the intention is to view the progression of one entity against these two measures. Despite the scale, if the y-axis on the left is disproportionate to the values of the y-axis on the right, the plotted graph will result in a graphically and logically incorrect representation.
As you can see in the image below, the plot area of the sum of amount bar and the sum of expected revenue aligns close together, while, the difference between $700,000 and $40,500 is drastic, creating inaccurate interpretations.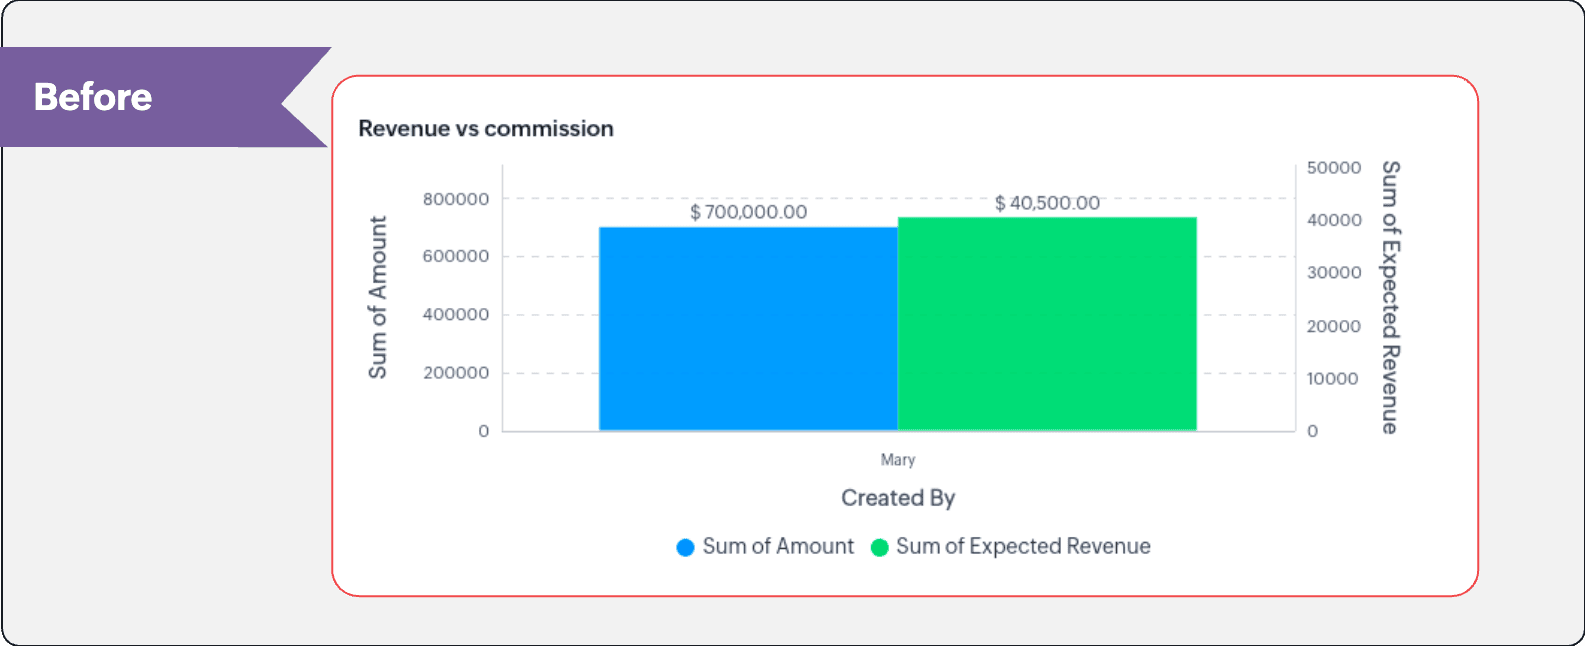
In this enhancement, we're allowing neighboring values of measures to merge so that the interpretation can be more visually accurate.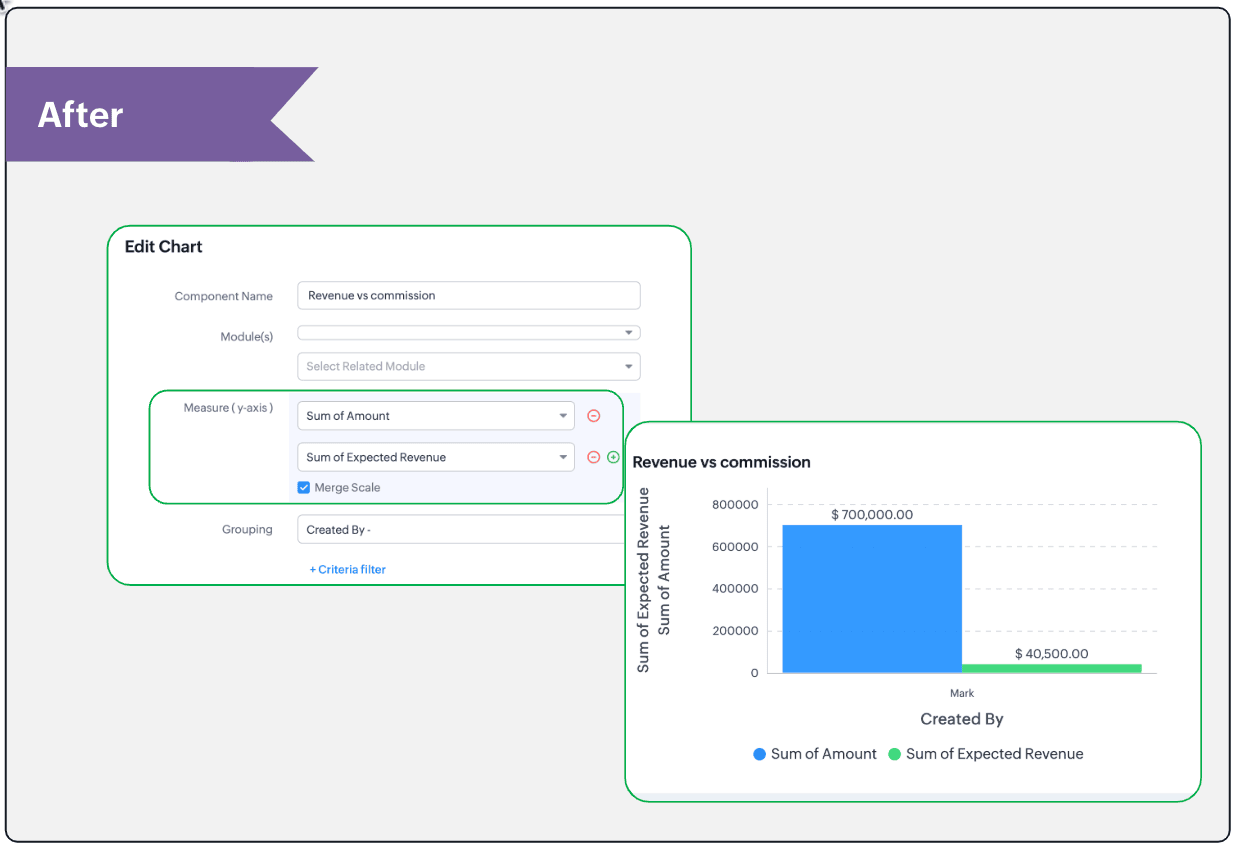
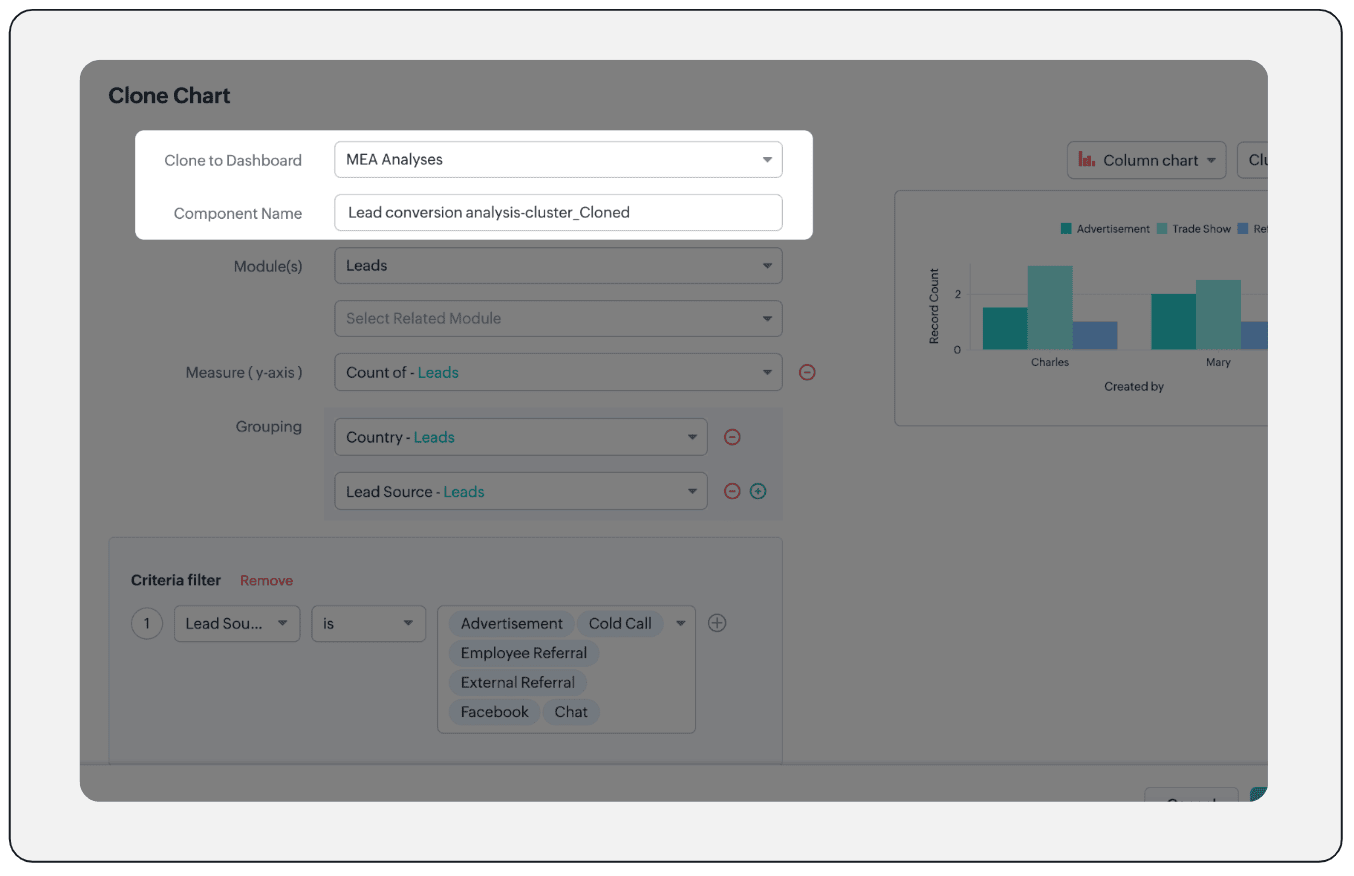
- Clone components to a different dashboard: Dashboards in Analytics serve in unique ways for various audiences—there can be separate dashboards for the sales team, marketing team, engineering team, and so on, and the chances of using the same measure for reference is common. Thus, when you clone a chart, you can now determine the target dashboard in which the cloned chart can be placed.
Resource: Help document
Thanks and have a good one!
Kind regards,
Saranya Balasubramanian
Saranya Balasubramanian
Topic Participants
Saranya Balasubramanian
Sticky Posts
Introducing Multiple Sandbox Types and Support for Module's Data Population
Register here for the upcoming Focus Group webinar on Multiple Sandbox | Help documentation to learn more about the new enhancements Hello everyone, Sandbox in CRM is a testing environment for users to create and test new configurations like workflowGood news! Calendar in Zoho CRM gets a face lift
Dear Customers, We are delighted to unveil the revamped calendar UI in Zoho CRM. With a complete visual overhaul aligned with CRM for Everyone, the calendar now offers a more intuitive and flexible scheduling experience. What’s new? Distinguish activitiesVoC in Zoho CRM is now data savvy: Explore response drilldown, summary components and participation in CRM criteria
VoC has all the goods when it comes to customer intelligence—which is why we're constantly enhancing it. We recently added the following: A customer drilldown component that shows you the list of prospects and customers behind a chart's attribute ExpandedWrapping up 2025 on a high note: CRM Release Highlights of the year
Dear Customers, 2025 was an eventful year for us at Zoho CRM. We’ve had releases of all sizes and impact, and we are excited to look back, break it down, and rediscover them with you! Before we rewind—we’d like to take a minute and sincerely thank youPresenting ABM for Zoho CRM: Expand and retain your customers with precision
Picture this scenario: You're a growing SaaS company ready to launch a powerful business suite, and are looking to gain traction and momentum. But as a business with a tight budget, you know acquiring new customers is slow, expensive, and often delivers
Recent Topics
Automatically Update Form Attachment Service with Newly added Fields
Hi, When I have a Form Setup and connected to a 3rd Party Service such as OneDrive for Form Attachments, when I later add a new Upload Field I have to remove and redo the entire 3rd Party Setup from scratch. This needs to be improved, such as when newZoho CRM for Everyone's NextGen UI Gets an Upgrade
Hello Everyone We've made improvements to Zoho CRM for Everyone's Nextgen UI. These changes are the result of valuable feedback from you where we’ve focused on improving usability, providing wider screen space, and making navigation smoother so everythingNewsletter in multiple languages
Hi We are planning on starting to use Zoho Campaigns for our newsletters. Since we send our newsletters in three languages, I would need the "unsubscribe page" and other pages related to the NL (Thank you page and so on) to be available in different languagesFixed assets in Zoho One?
Hi, We use Zoho Books and have the fixed asset option in it. I started a trial for Zoho One and I do not see that as an option. Is the books that is part of zoho one equivalent to Zoho Books Elite subscription or is it a lesser version? Thanks, MattSet Default Status of Assembly to "Assembled" When Entered in UI
I've just discovered the new "confirmed" status of Assemblies within Inventory. While I understand the intent of this (allowing for manufacturing planning and raw material stock allocation), it was initially confusing to me when manually entering someI need to Record Vatable amount and non vatable amount separately in zoho books in a single line
I need to Record Vatable amount and non vatable amount separately in zoho books in a single line give me the customisation option and in invoice copy to customer the total amount should be inclusive 5%vat and no need to show the vatable and non vatableSort Legend & stacked bar chart by value
I'd love to see an option added to sort the legend of graphs by the value that is being represented. This way the items with the largest value in the graph are displayed top down in the legend. For example, let's say I have a large sales team and I createScanned Doc - selecting Item overwrites Rate
I have a Vendor Invoice which was uploaded to Documents. I select Add To > New Bill. The OCR is actually quite good, but it is reading an Item Description instead of an Item Number. I remove the description and select the correct Item Number... and itTimesheet invalid data error
Getting the "Invalid Date" error when trying to add a time sheet to an appointment in a work order. I initially though the work order was corrupt or something so I deleted the work order and recreated it. I added the first time sheet to the AP and savedConvert invoice from zoho to xml with all details
How to convert an Invoice to XML format with all detailsAny update on adding New Customer Payment Providers who support in store terminal devices?
Currently there is only one Customer payment provider listed for terminal devices in USA- Everyware. They charge a monthly fee of almost $149 minimum. Will you add other providers - like Zoho Payments or Stripe or Worldpay that would allow integratedDealing With One-Time Customers on Zoho Books
Hello there! I am trying to figure out a way to handle One-Time customers without having to create multiple accounts for every single one on Zoho Books. I understand that I can create a placeholder account called "Walk-In Customer", for example, but ICustomizing Helpcenter texts
I’m customizing the Zoho Desk Help Center and I’d like to change the wording of the standard widgets – for example, the text in the “Submit Ticket” banner that appears in the footer, or other built-in widget labels and messages. So far, I haven’t foundPassing the image/file uploaded in form to openai api
I'm trying to use the OpenAI's new vision feature where we can send image through Api. What I want is the user to upload an image in the form and send this image to OpenAI. But I can't access this image properly in deluge script. There are also some constraints"Temporary" Field Value?
I have a custom action in Form A report Detail View that passes the Rec ID and updates a Temp Record ID lookup field in the Form B record via openURL (and opens the Form B report in popup) . The updated Temp Record ID field value in Form B is then usedFile Upload field automatically replaces spaces with underscores – support experience
Hi everyone, I want to share my recent experience regarding the File Upload field behavior in Zoho Creator and my interaction with the Zoho support team. When a user uploads a file, the system automatically renames the document by replacing spaces inWe Asked, Zoho Delivered: The New Early Access Program is Here
For years, the Zoho Creator community has requested a more transparent and participatory approach to beta testing and feature previews. Today, I'm thrilled to highlight that Zoho has delivered exactly what we asked for with the launch of the Early AccessQueries on Project-Based Inventory Consumption and Proforma Invoice in Zoho ERP
We would appreciate your clarification on how Zoho ERP plans to handle the following: Project-based inventory consumption without itemized sales orders Accurate project cost tracking along with inventory reduction Proforma Invoice usage We look forwardApplying Excess Payments & Conflict Invoices Due to Cancelled Items
I’m running into several issues that appear to stem from deeper-than-expected overlap between Zoho Finance (Books/Inventory) and Zoho POS. The level of coupling between these systems seems greater than what was originally communicated, and it’s leadingZoho Sprint Backlog View, filter by item status
Hello, In Zoho Sprints, it would be great to be able filter out specific items in the Backlog based on their status. We would like to track items that were Removed from our backlog without seeing them constantly in the Backlog view, as this view shouldWATERFALL CHART IN ZOHO ANALYTICS
Hi Team, I would like to know whether Zoho Analytics currently supports a Waterfall Chart as a built-in visualization type. If yes, could you please share the steps to create one? If not, is there any workaround or recommended method to build a WaterfallExport contacts from Bigin's mobile app to your Android device
Hello everyone! We're happy to announce that you can now export customer contacts from the Bigin mobile app to your device. Scenario A small-scale business owner has two pipelines in Bigin—one for procuring raw materials and the other for selling hisASAP iOS SDK – Xcode Compatibility Update
Hello everyone, We have been delivering the ASAP iOS SDK developed using Xcode 16.1 to provide Help Center support within mobile applications. Thus, ASAP iOS SDK versions upto 4.5.8 are compatible with development environments running in Xcode 16.1 andSub form auto field population based on parent form
I have a parent form called "Sites" with a text field called "Site". I have a subform called "Design Comments" (actual form name "Review Comments") with a lookup field name "Sites1" that looks up from the Sites form. I want the Sites1 lookup field toA note-taking app right inside your project management space
How do you feel when you check off the last task from your to-do list after a long day at work? Euphoric, blissful, satisfied? Now, imagine completing the same checklist from your PM platform, without juggling tools. Sounds simple and handy? That’s exactlyEmail Forwarding: Maintain business continuity
As an administrator, ensuring uninterrupted email communication is critical when a role-based employee is unavailable due to extended leave or a temporary role change. Emails from customers, partners, and internal teams must continue to be received andTip #61- Collaborate live with Invite Technician- 'Insider Insights'
We’ve all been there: you’re deep into a complex remote session, and you realize you need a second pair of eyes. Instead of ending the call or rescheduling, why not just bring the expert to you? With Zoho Assist, you can invite internal colleagues orHow to integrate Zoho CRM, Zoho Forms and a WIX Web Site
Attached video demonstrates how to use Zoho Forms included in Zoho One, to design a Contact Us form to be embedded into a WIX web site and integrated into Zoho CRM.Bug Causing Major Sync & SO Access Failures in Zoho POS
We are experiencing critical and recurring issues in Zoho POS that all trace back to role-permission handling defects in the latest POS app version. These issues directly affect syncing, login ability, and Sales Order access for role-restricted usersOAuth2 Scope Error - Incorrectly defaulting to CRM instead of Analytics.
Hello Zoho Team, I am trying to connect n8n to Zoho Analytics API V2 for a simple automation project. Despite using the correct Analytics-specific scopes, my OAuth handshake is failing with a CRM-related error. The Problem: The authorization screen shows:Add Custom Reports To Dashboard or Home Tab
Hi there, I think it would be great to be able to add our custom reports to the Home Tab or Dashboards. Thanks! Chad Announcement: The feature is being rolled out across DC's and Edition in phases. To know more refer to the announcement post here.Hiding Pre-defined Views
You can enhance Zoho with custom views - but you cannot hide the pre-defined views. Most users focus on 4 or 5 views. Right now for EVERY user EVERY time they want to move to one of their 4 or 5 views - they have to scroll down past a long list of pre-definedwhy can't agent see accounts & contacts
My new user, with 'Agent' privileges, cannot see records that don't belong to them. How can I give them access? Why isn't this the default configuration in Zoho?Sender Email Configuration Error.
Hello Team, Hope you are all doing well. We are in the process of creating the Zoho FSM environment in the UAE. When we try to add the sender email address “techsupportuae@stryker.com”, we receive the error message: “Error occurred while sending mail【Zoho CRM】フィルター機能のアップデート:ルックアップ項目を使ったデータフィルタリング
ユーザーの皆さま、こんにちは。コミュニティチームの藤澤です。 今回は「Zoho CRM アップデート情報」の中からフィルター機能のアップデートをご紹介します。 ルックアップ項目を使ったデータフィルタリングがより詳細に行えるようになりました。 この機能は詳細フィルターとカスタムビューで利用でき、必要な情報を正確に取得できます。 これにより、タブ間を移動することなく、より深く正確な方法でデータを絞り込むことが可能になります。 ◉できること 詳細フィルターとカスタムビューで、ルックアップ先タブの項目が選択可能This will be long, Please bear with me - Next Gen Layout - Search
In general, I think that Zoho are going in the right direction with the Next Gen UI. The latest update brings some nice improvements and all-in-all from a user's perspective I think the improvements are generally very good. However, there are some areasZoho Books | Product updates | July 2025
Hello users, We’ve rolled out new features and enhancements in Zoho Books. From plan-based trials to the option to mark PDF templates as inactive, explore the updates designed to enhance your bookkeeping experience. Introducing Plan Based Trials in ZohoZoho Books | Product updates | August 2025
Hello users, We’ve rolled out new features and enhancements in Zoho Books. From the right sidebar where you can manage all your widgets, to integrating Zoho Payments feeds in Zoho Books, explore the updates designed to enhance your bookkeeping experience.Quotes Approval
Hey all, Could you please help in the following: When creating quotes, how to configure it in a way, that its approval would work according to the quoted items description, not according to quote information. In my case, the quote should be sent to approvalImportant Update: Facebook Pages API Deprecation
Dear Zoho Analytics users, As of January 26, 2026, Facebook has officially deprecated Facebook Pages API version 18. This update involves the removal of several metrics that were previously supported by the API. As a result, these changes will affectNext Page