Did you know?#2: How to filter your report by custom date range in PageSense

Do you want to quickly view your experiment analysis or responses over different time periods? Want to effortlessly compare the performance of your website by specific weeks, months, or years? Also, see whether your new marketing strategies or efforts have brought the expected sales in a planned time frame?
PageSense makes this easy for you with custom data range filters in your report.
There might be situations when you want to narrow down and see your experiment reports based on specific date or date ranges instead of the entire duration—for example, viewing the number of successful signups obtained on your SaaS website during Q1 and Q2 of business cycles, or watching the purchase pattern of the customers on your ecommerce site over the two months before an end-of-season sale.
Using the custom date range in your reports can let you quickly pick a date range or interval of reports on your PageSense dashboard and filter your data at a granular level based on your business requirements. This extracted information can act as clear evidence to prove your new optimization and marketing efforts in front of your peers or external stakeholders.
So, if you haven't used this option yet? Try it out for yourself now:
From the REPORTS page, click the date picker at the top-right corner and choose Custom Range. Next, select the start and end dates from the Calendar within which you want to view your data. The end date in your custom filter can not exceed the current or last date your experiment was running.
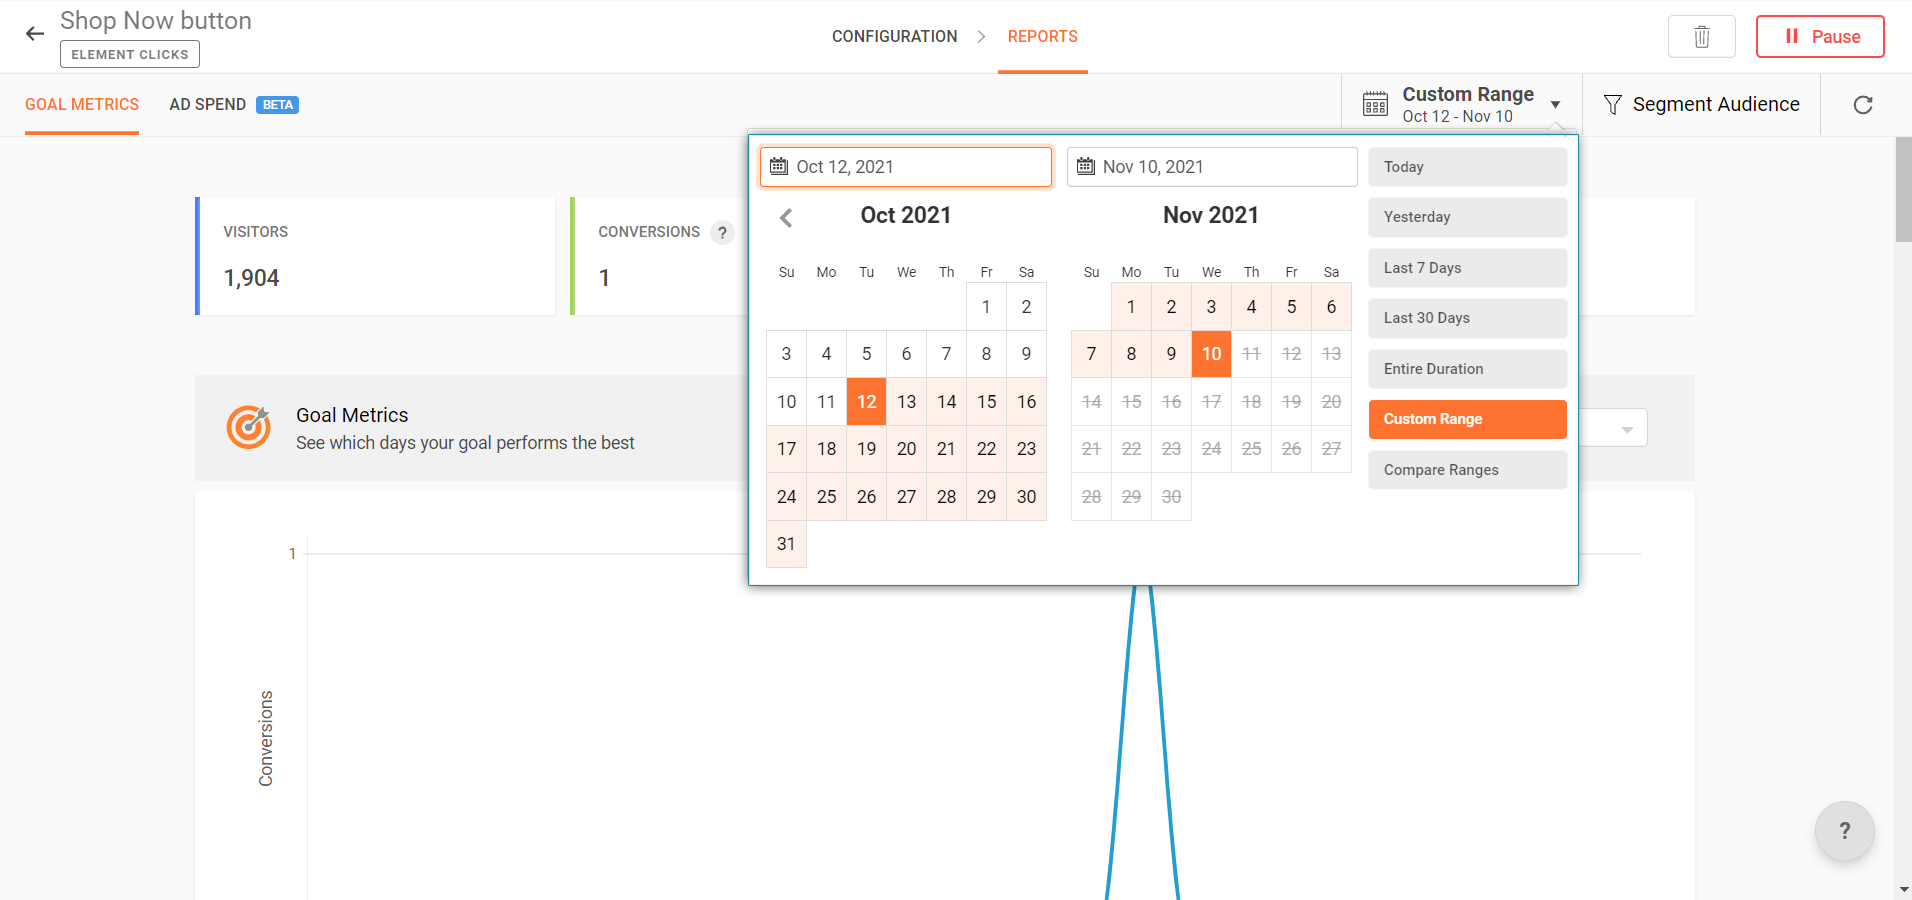
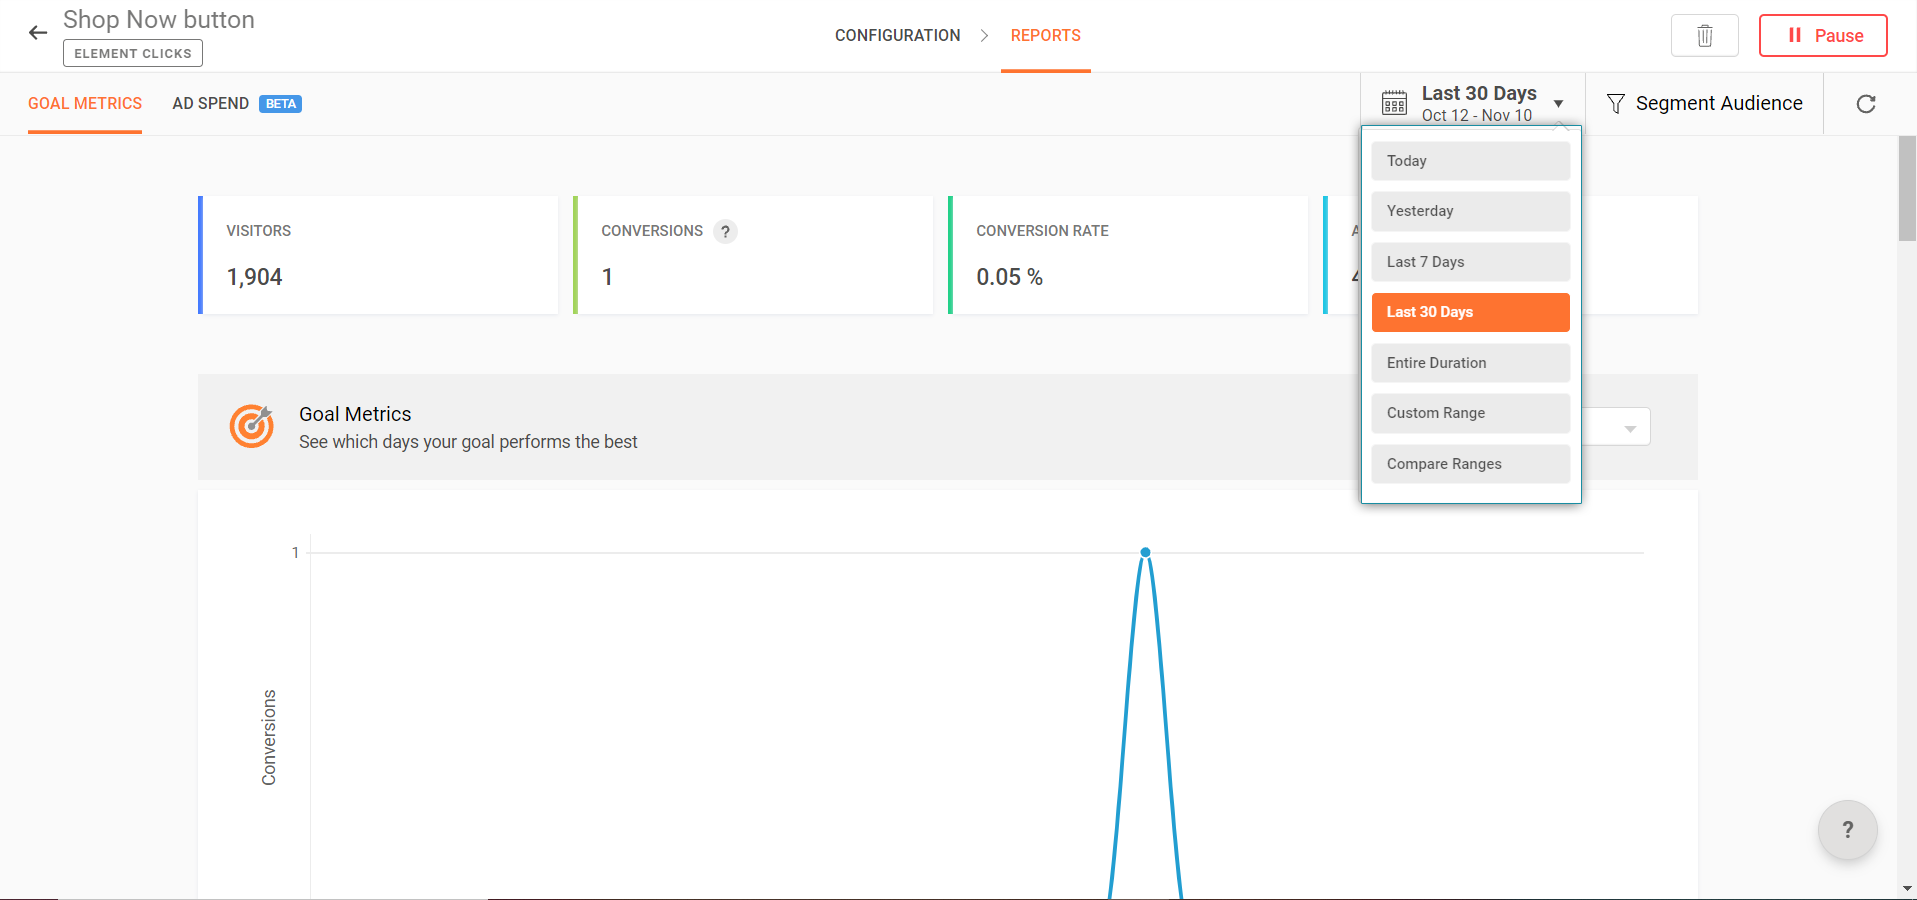
Note: You can also filter and view your reports using other predefined date filters like Today, Yesterday, and Last 7 Days for experiments currently running. Additionally, you can see the Last 30 Active Days filter for experiments in a paused state but that have been active for a minimum of 30 days.
Another beautiful addition to date filters is the Compare Range option, which helps you answer the fundamental business question, “How much better/worse is my website doing at this time compared to the last time?” Using this option, you can filter and compare your experiment reports between different time periods—for example, the same period last year, the previous month on this day, week-over-week, and more—that are differentiated by two different colors within a single report.
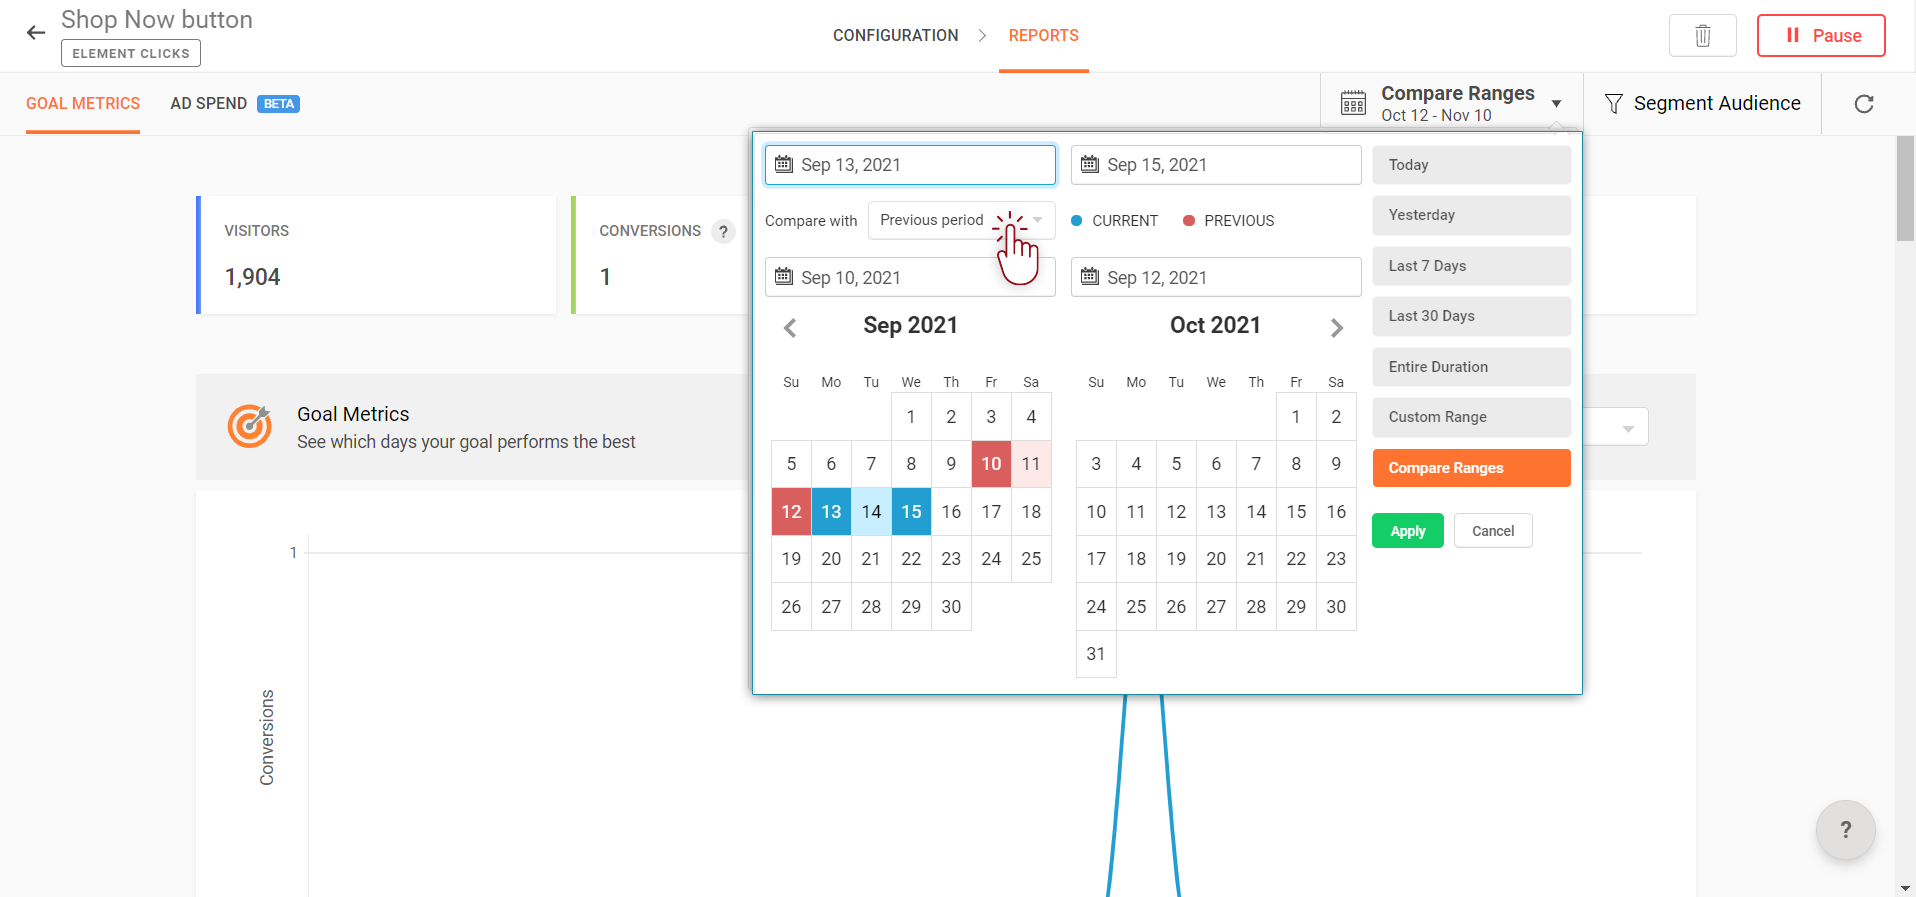
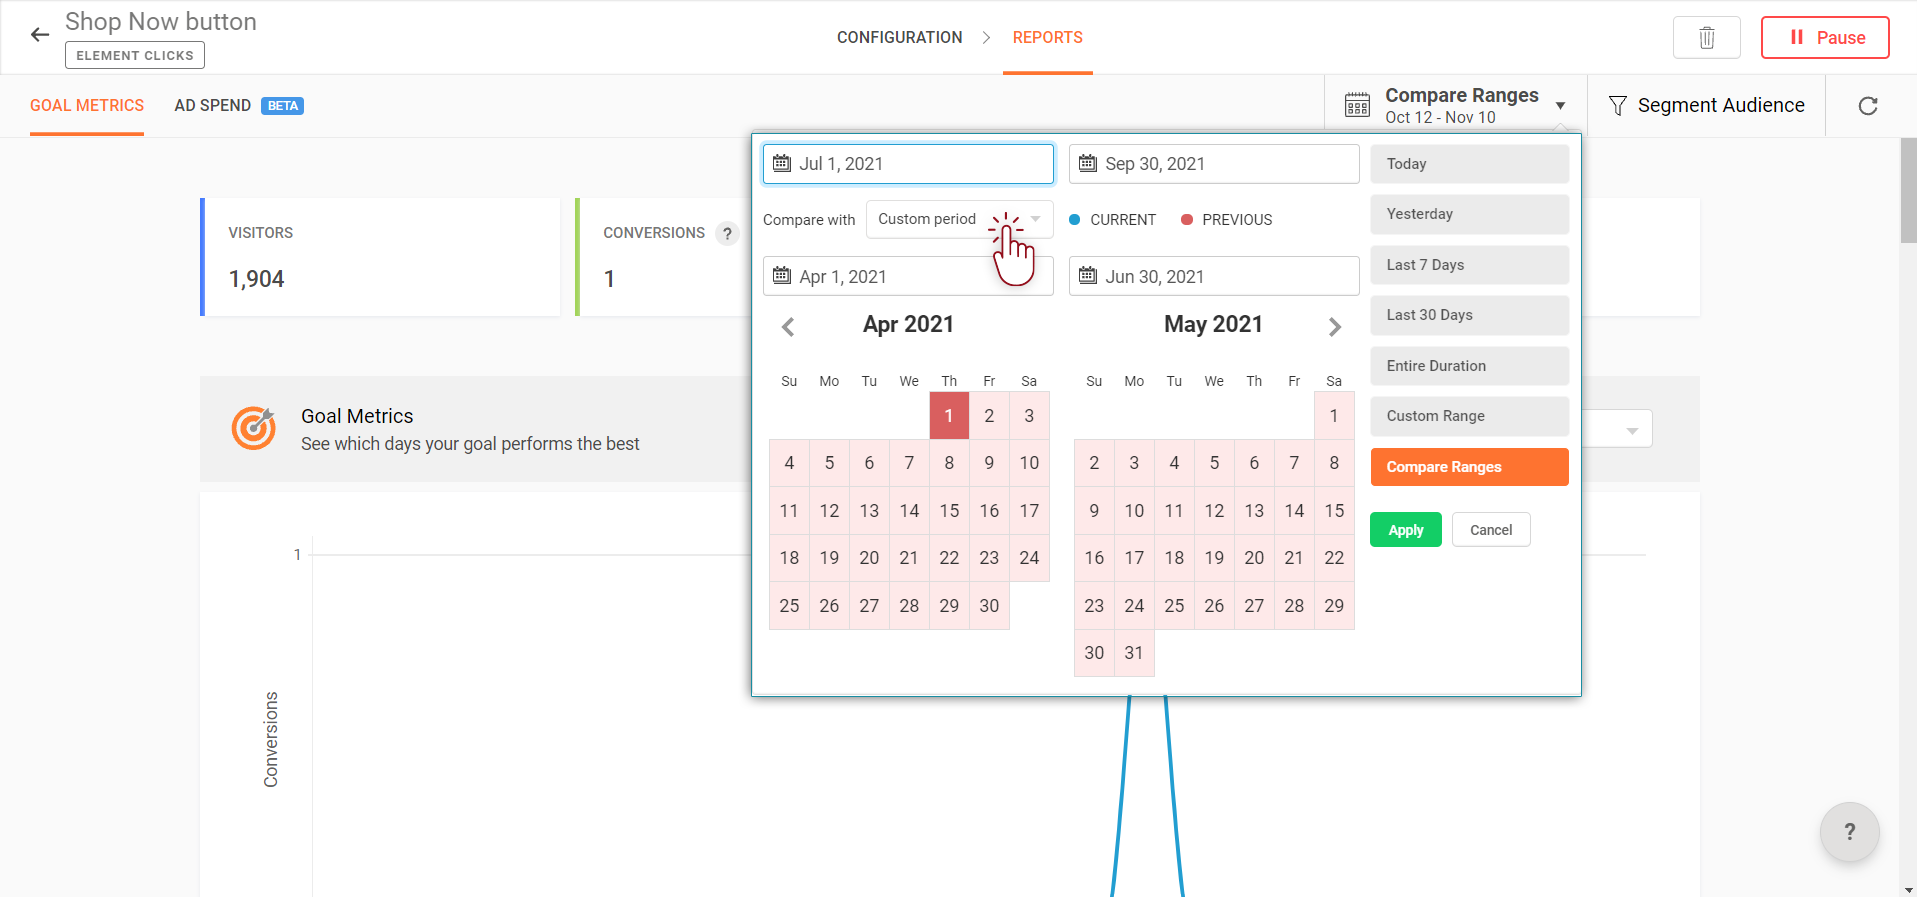
In order to create a comparison report, click the date picker on your REPORTS page and click the Compare Ranges option from the menu. Next, select Previous Period, Previous Month, or Custom Period from the dropdown and choose the date ranges from the Calendar:
- Previous period—Compares the currently selected period in the calendar to the previous (immediately preceding) matching period. For example, if the current period is last three days of a month, the comparison period is to the previous three days prior to your current chosen dates.
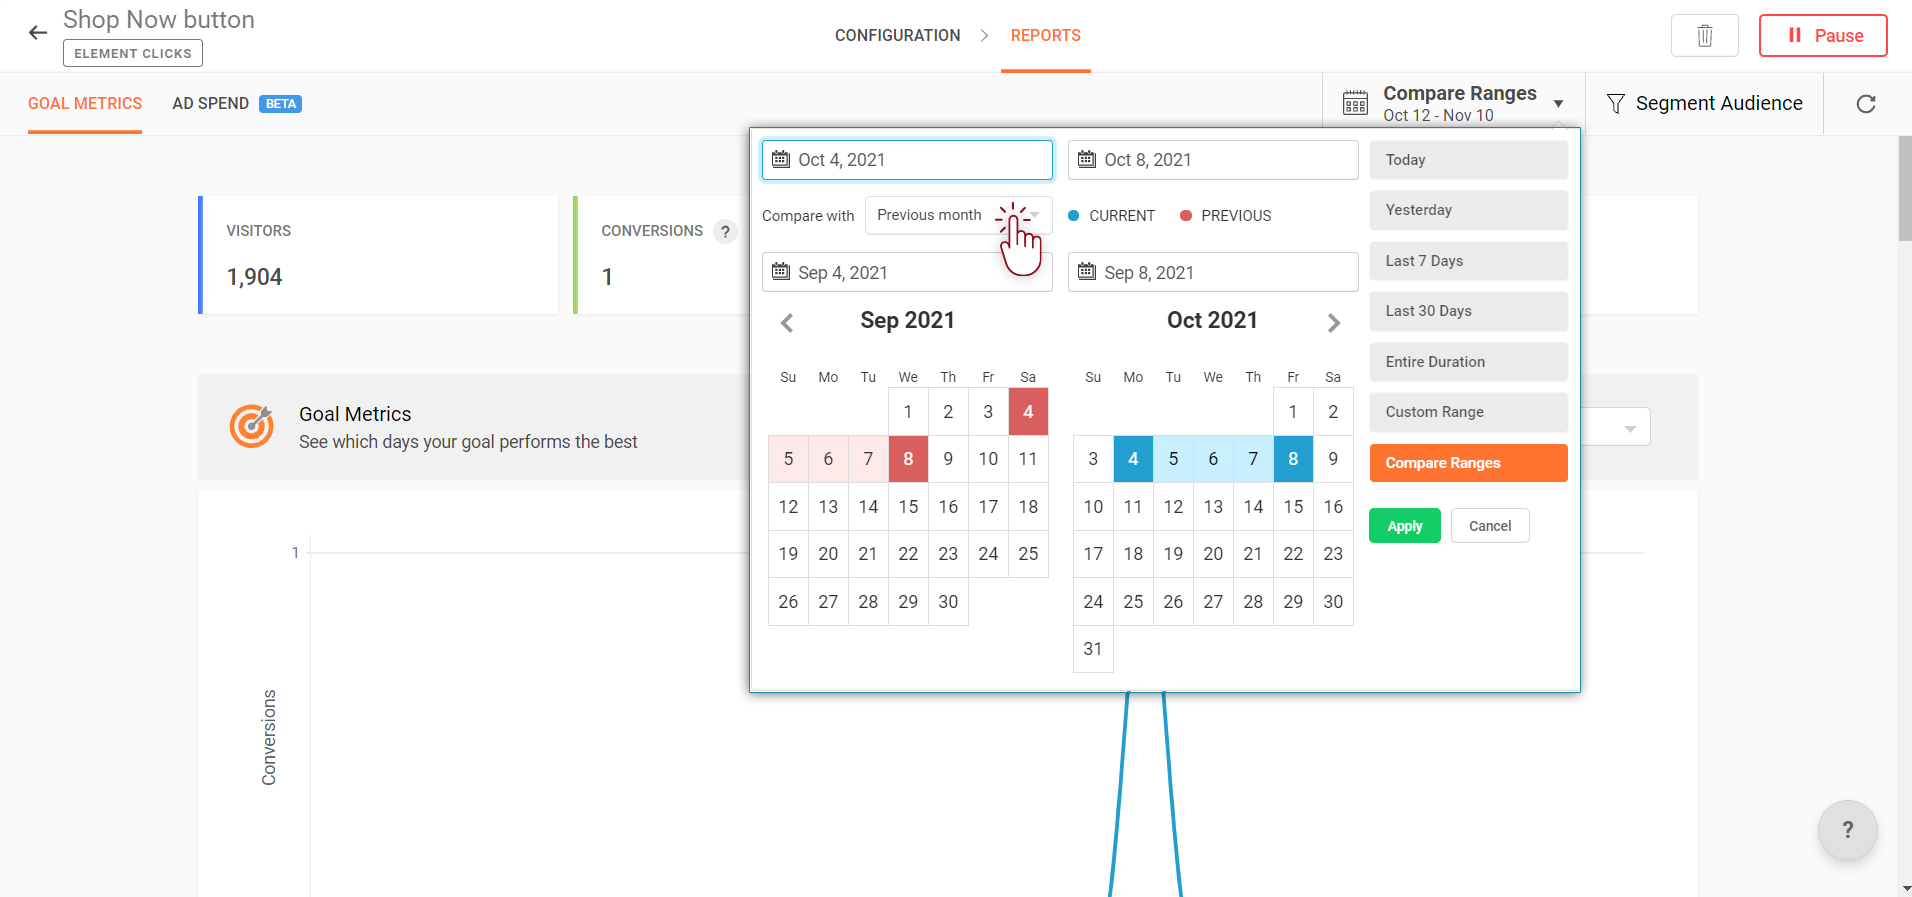
- Previous month—Compares the currently selected period to the same period last month . For example, if the current period is a particular week of the month, the Calendar displays comparison data for the matching dates last month.
- Custom period—Compares your report based on the fixed date range you manually select from the Calendar.
Here is a table to understand the differences better.
Comparison Option | Start Dates | End Dates |
Previous period | Sept 13, 2021 to Sep 15, 2021 | Sept 10, 2021 to Sept 12, 2021 |
Previous month | Oct 4, 2021 to Oct 8, 2021 | Sept 4, 2021 to Sept 8, 2021 |
Custom period | April 01, 2021 to June 30, 2021 | July 01, 2021 to Sept 30, 2021 |
Note: You can also select one of the following date ranges from the menu like Today, Yesterday, Last 7 Days, and Last 30 Days to create your comparison report.
Bonus tip: The best way to understand your reports is to combine date range filters with audience segment filters. Say, for example, you want to filter the number of purchases made by new visitors in your sales funnel during the past 10 days of running an ad campaign. This combination of filtering will help you accurately segregate your website data based on certain specific audience groups over most important periods of time (or events).
Was that helpful? Do share your feedback or comments in the box below. Before we wrap up, here is a heads-up on our next post in the series: How to target and run your experiment to a specific group of visitors on your website. 'Til then, stay tuned.
Start learning. Start customizing!