Customer Segmentation using RFM Analysis
How well do you know your customers? Whether you operate in a B2B or B2C space, chances are that 80% of your business comes from just 20% of your customers (Pareto's Principle). According to a study by Forbes, acquiring new customers costs five times more than retaining the existing ones. Identifying high-value customers is crucial to increase revenue and building brand loyalty.
Customer Segmentation is a critical strategy for businesses to understand and engage with customers effectively. Understanding the behavioral patterns of customers can help personalize the purchases they make and cater to their needs better.
Questions like who are the customers who contribute more to sales, who are the customers about to churn, will help digital marketers understand the behavioral patterns of their customers.
While there are many criteria based on which the customer base can be segmented, this solution focuses on segmenting customers based on the RFM analysis.
What is RFM Analysis?
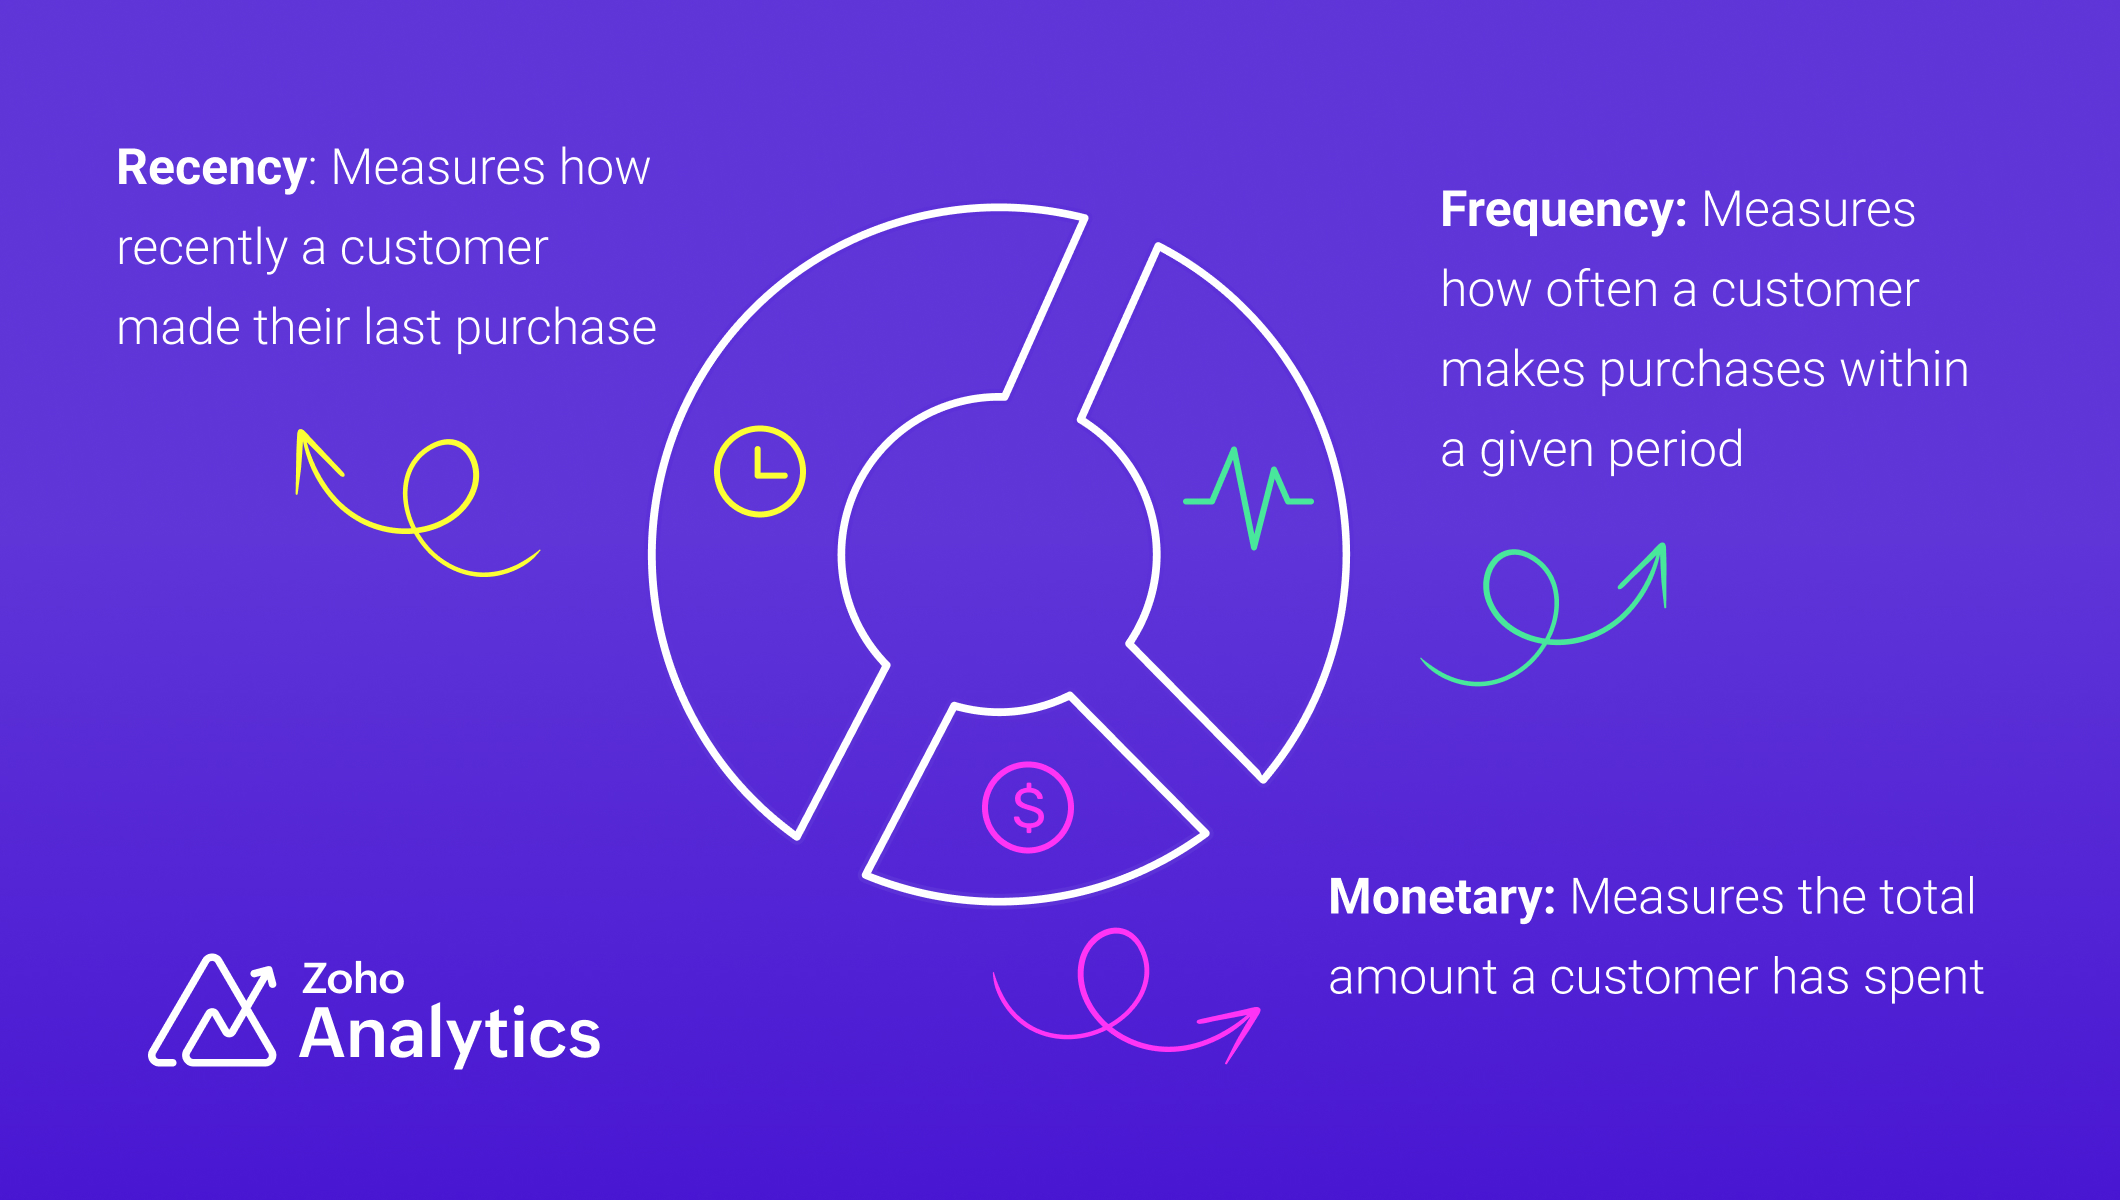
RFM analysis (Recency, Frequency and Monetary) is a method used to identify and segment existing customers based on their purchasing behavior. The key metrics of RFM analysis include
Recency
Recency refers to how recently a customer has made their purchase and this is the most important metric of the other metrics. This metric is a strong indicator of customer loyalty and interest.
Frequency
Frequency refers to how often a customer makes purchases or interacts with a business within a specific period. It measures the level of engagement and loyalty of a customer.
Monetary
Monetary value refers to the total amount of money a customer has spent with a business during a specific period.
Industry-Specific Applications of RFM Analysis
- SaaS and subscription services: RFM analysis can be adapted for SaaS and subscription services to segment users based on engagement, renewals, and revenue contribution.
- Financial Sector: RFM analysis can improve credit scoring and risk assessment by evaluating customer transaction patterns, helping financial institutions make more informed loan approval decisions.
Data Requirements
For RFM analysis, you'll need a transactional dataset with the following equivalent columns (details)
- A product (Product ID)
- A related transaction (Transaction ID)
- Number of products purchased in a transaction (Product Quantity)
- The product purchase price (Product Price)
- Transaction date (Date)
- Customer who made the purchase (Customer ID, Customer Name)
We have used a sample table of e-commerce data for illustration.
Steps for Implementing RFM analysis
1. Gather and Prepare Transaction Data :
Gather all transaction data, ensuring it includes customer identifiers, transaction dates, and monetary amounts, and address missing or inconsistent values, ensuring data integrity before analysis.
2. Compute RFM Metrics:
To segment customers based on their behavior, we compute three key metrics: Recency (R), Frequency (F), and Monetary Value (M). Below are SQL queries for each, along with detailed explanations.
Recency (R)
Recency measures how recently a customer made a purchase. It is calculated as the number of days since their last transaction. Customers with recent purchases are more engaged, while those who haven’t bought in a long time may be at risk of churn.
The time frame for RFM analysis should be tailored to your business model and industry. Choosing the right period for RFM analysis is essential, as it directly influences the accuracy of customer segmentation and the quality of insights derived.
Frequency (F)
Frequency tracks how often a customer makes purchases within a specific period. A higher frequency indicates a loyal customer who regularly shops, while a lower frequency suggests occasional or one-time buyers.
Monetary Value (M)
The total amount spent by the customer in the same period
RFM Query Table
|
SELECT
"Customer ID",
"Customer Name",
DAYS_BETWEEN(MAX("Transaction Date"), CURRENT_DATE()) AS "Recency",
COUNT ("Order ID") AS "Frequency",
SUM("Transaction Amount") AS "Monetary Value"
FROM "Customer Data"
GROUP BY "Customer ID",
"Customer Name"
ORDER BY "Recency" ASC,
"Frequency" DESC,
"Monetary Value" DESC
|
3. Segment Customers using Cluster Analysis
Manual scoring can skew the results and may not be practical for handling large volumes of data. In contrast, using machine learning algorithms like cluster analysis ensures unbiased, efficient, and data-driven segmentation. Unlike traditional scoring methods such as the quantile or percentile-based approach, cluster analysis recognizes inherent relationships and patterns in the data. With cluster analysis, business can obtain accurate segmentation and devise targeted strategies to improve sales and customer retention.
Follow the below steps to apply cluster analysis,
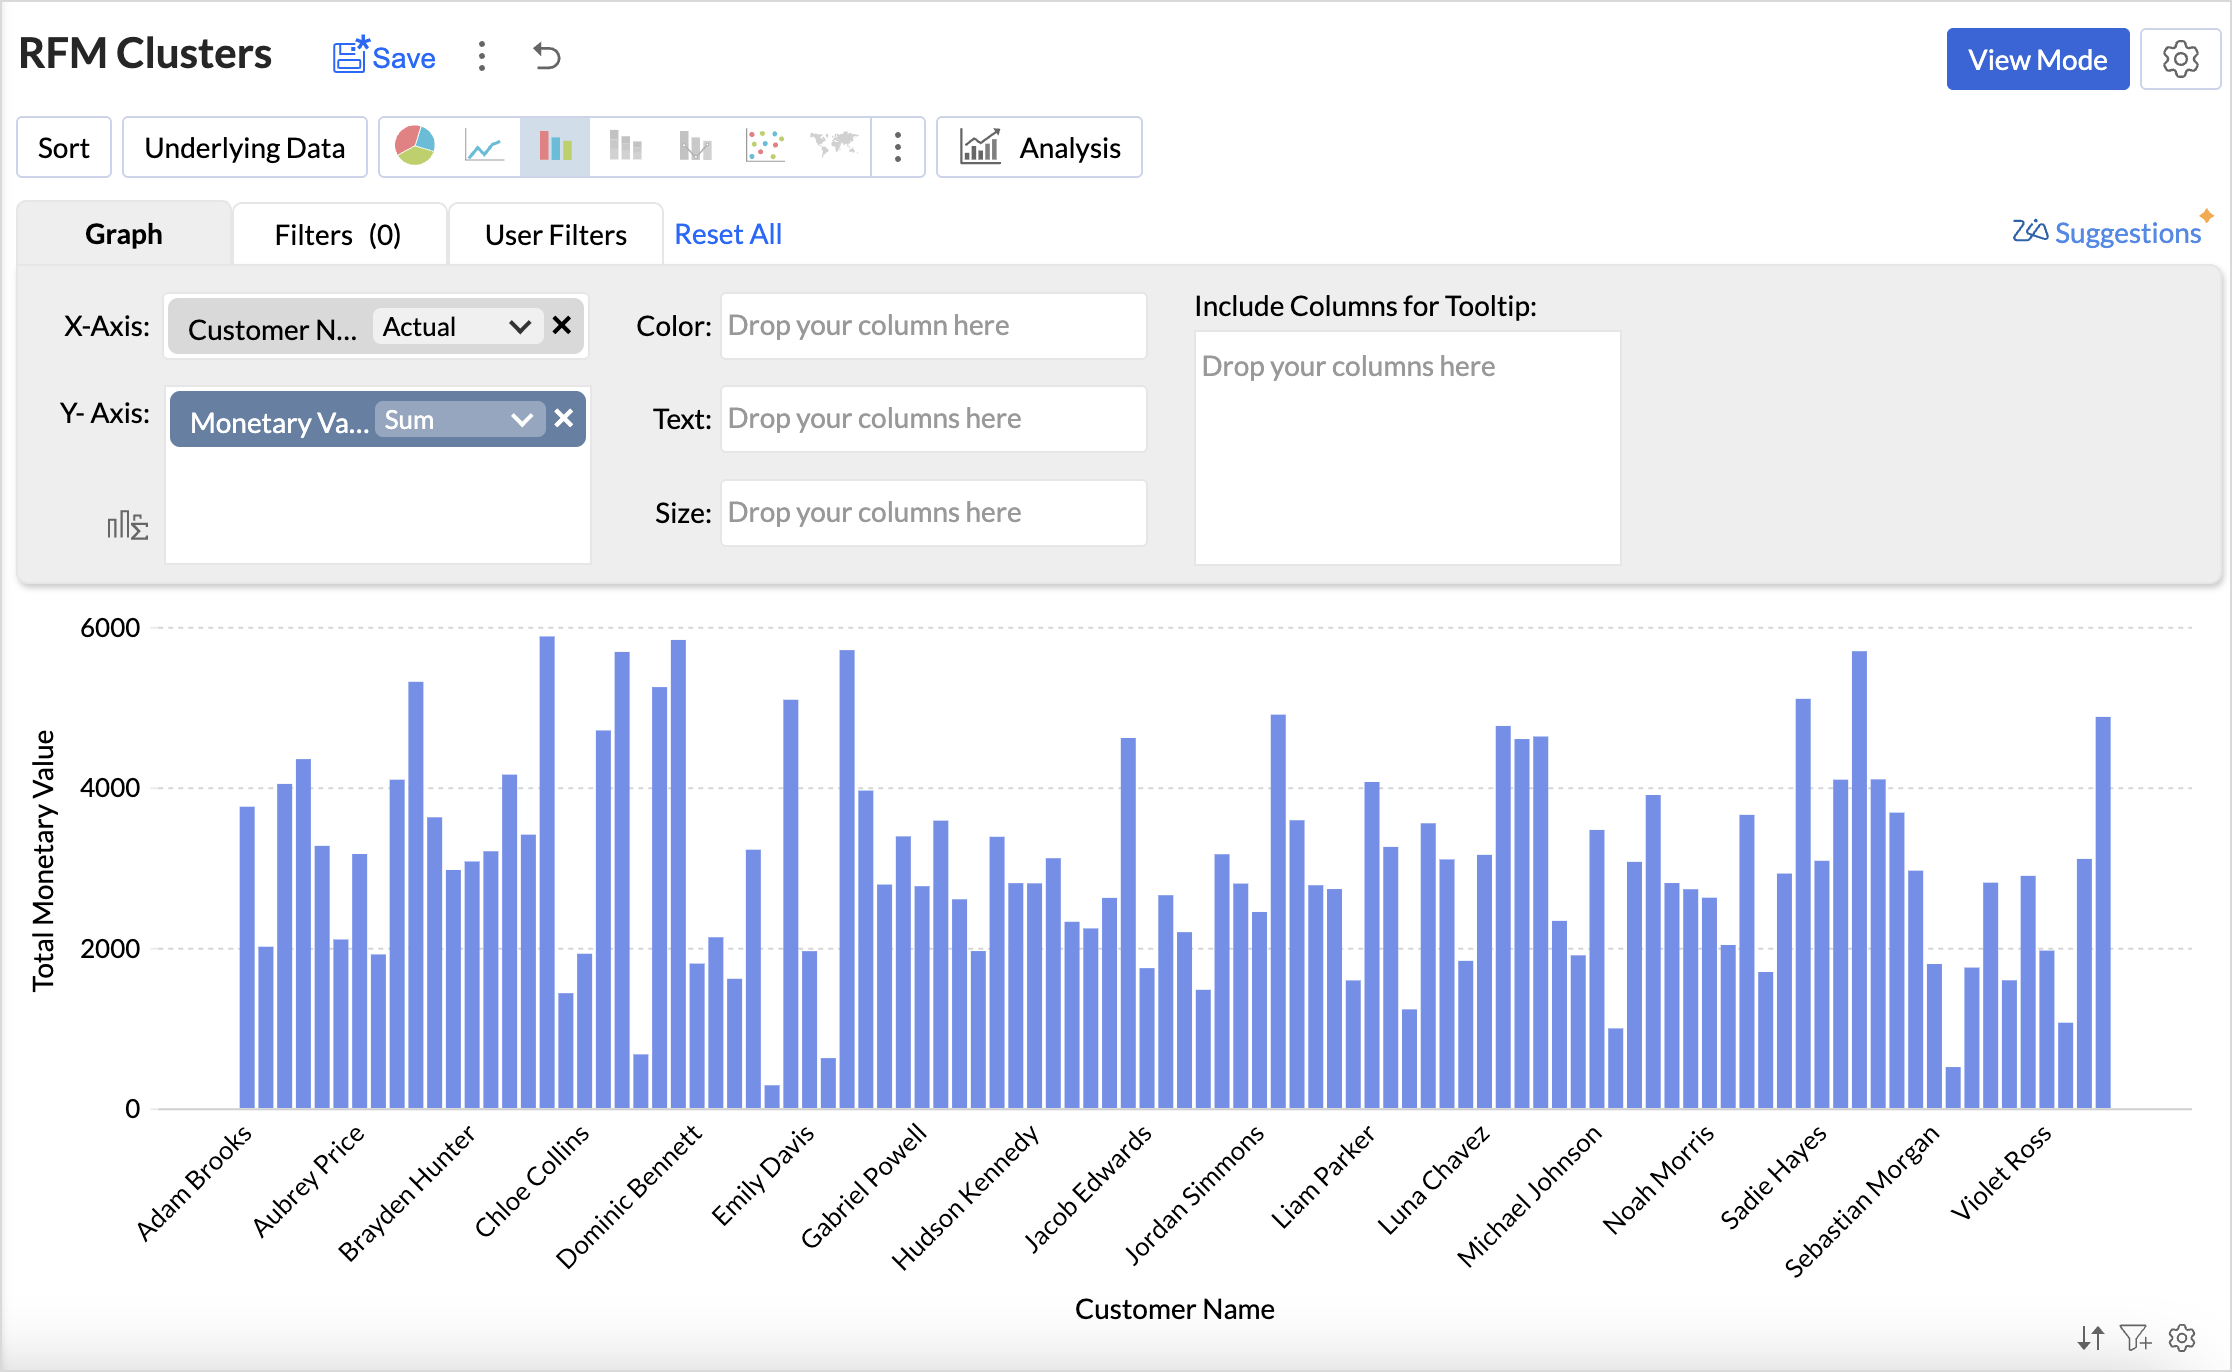
- Click the Create New icon and choose New chart from the drop-down menu.
- Add the columns to the chart shelf as shown below,
- X-axis: Customer Name
- Y-axis: Monetary Value with Sum function.
- Click Generate Graph and change the chart type to bar chart.
- Click the Analysis icon and select Cluster Analysis > Add Clusters.
- The Model is chosen automatically based on the columns dropped in the shelves.
- By default, the columns dropped in the shelves (Monetary Value) are selected as factors. Click the drop-down icon to include Recency and Frequency columns as factors.
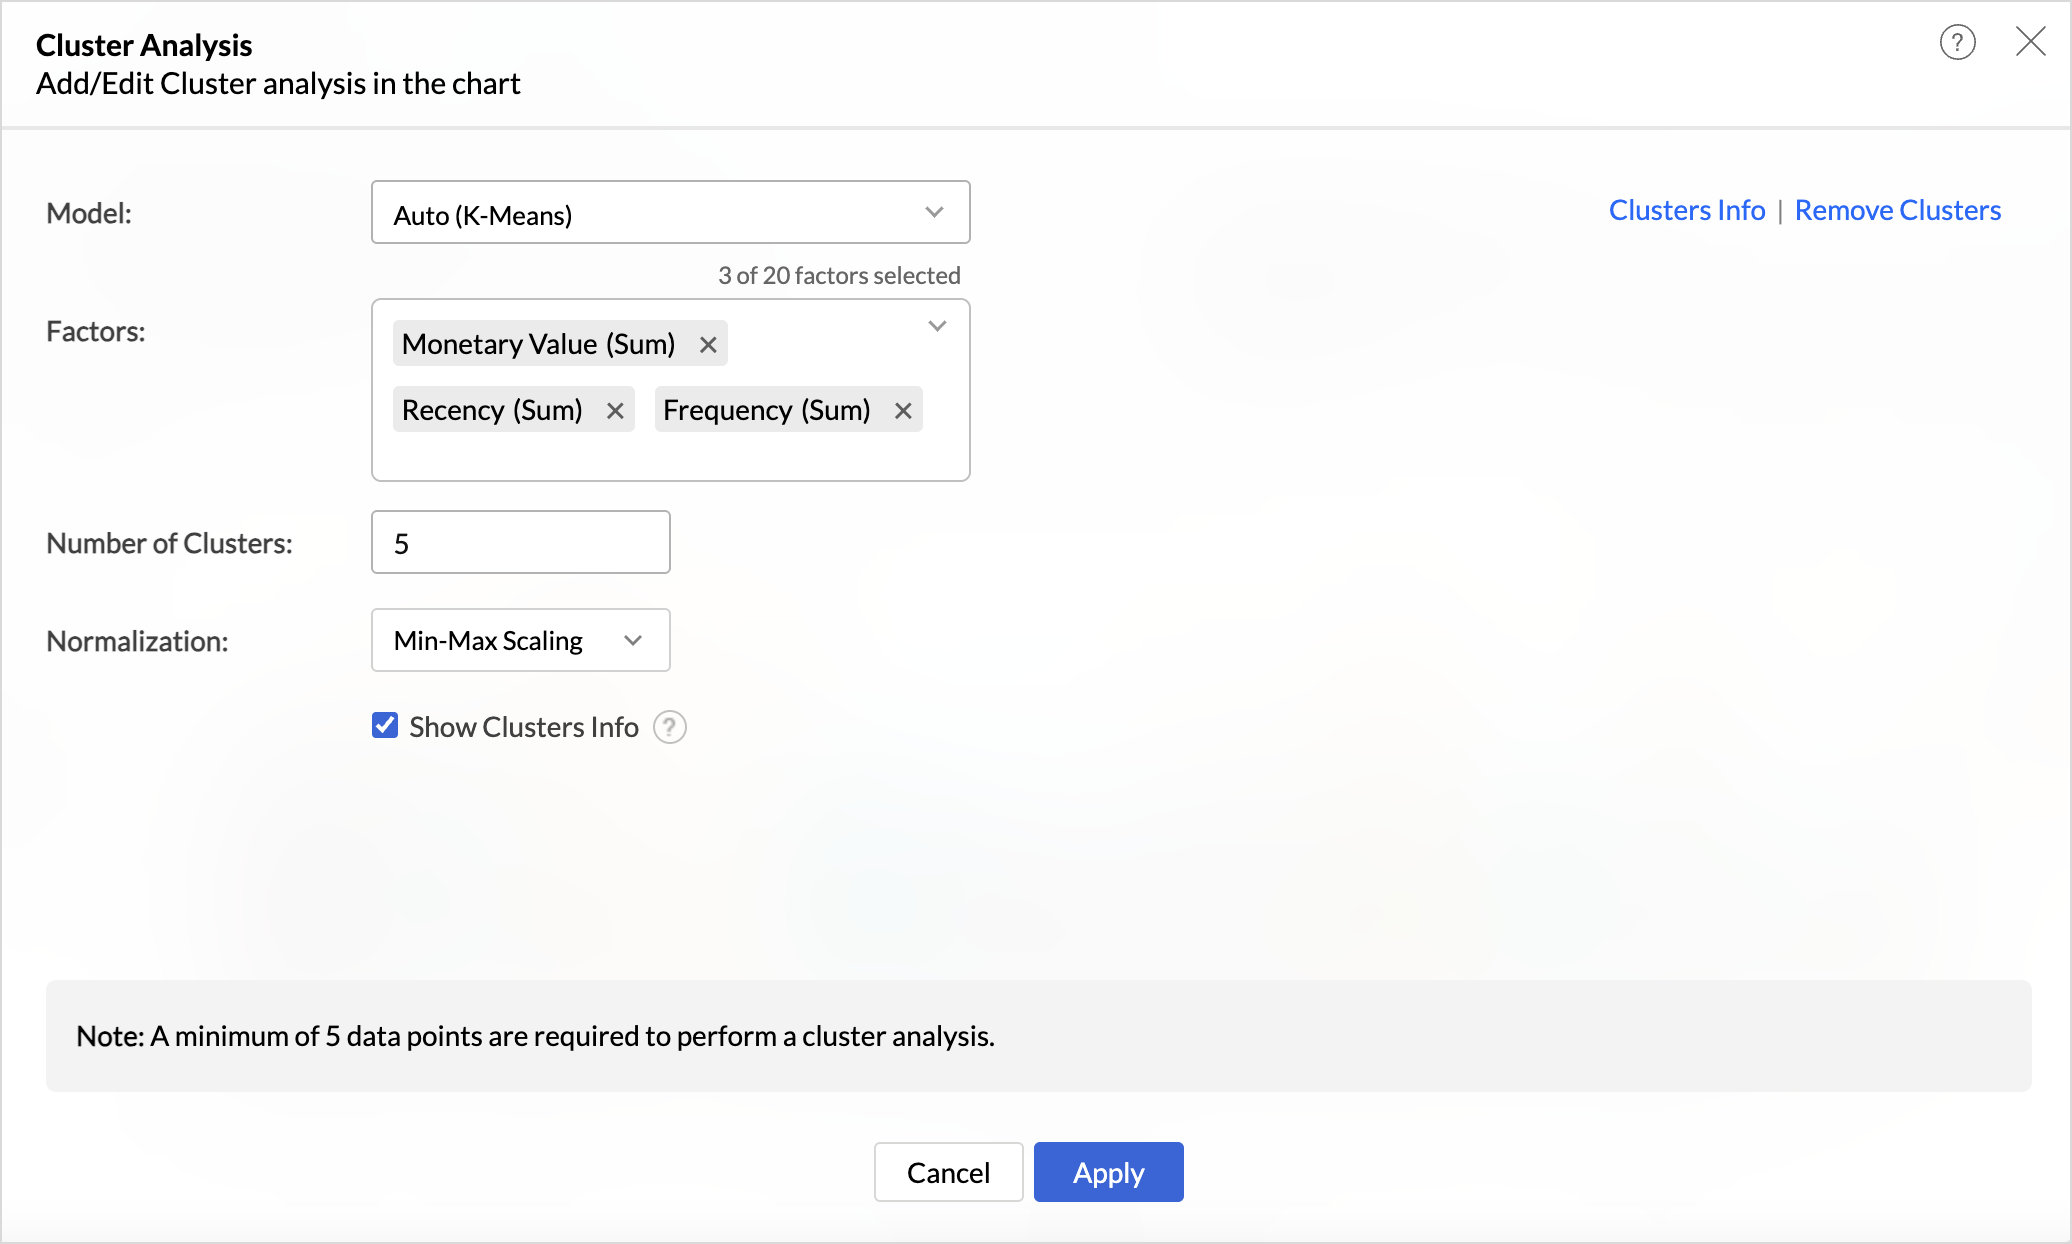
- The number of clusters is determined automatically but can be adjusted based on business needs and specific customer segmentation goals to ensure optimal categorization.
- Choose the Normalization method to prevent values of high ranges from dominating the results. For instance, Recency (measured in days) and Monetary Value (measured in currency) have different scales, and normalization ensures a balanced contribution from each metric.
- Click Apply.
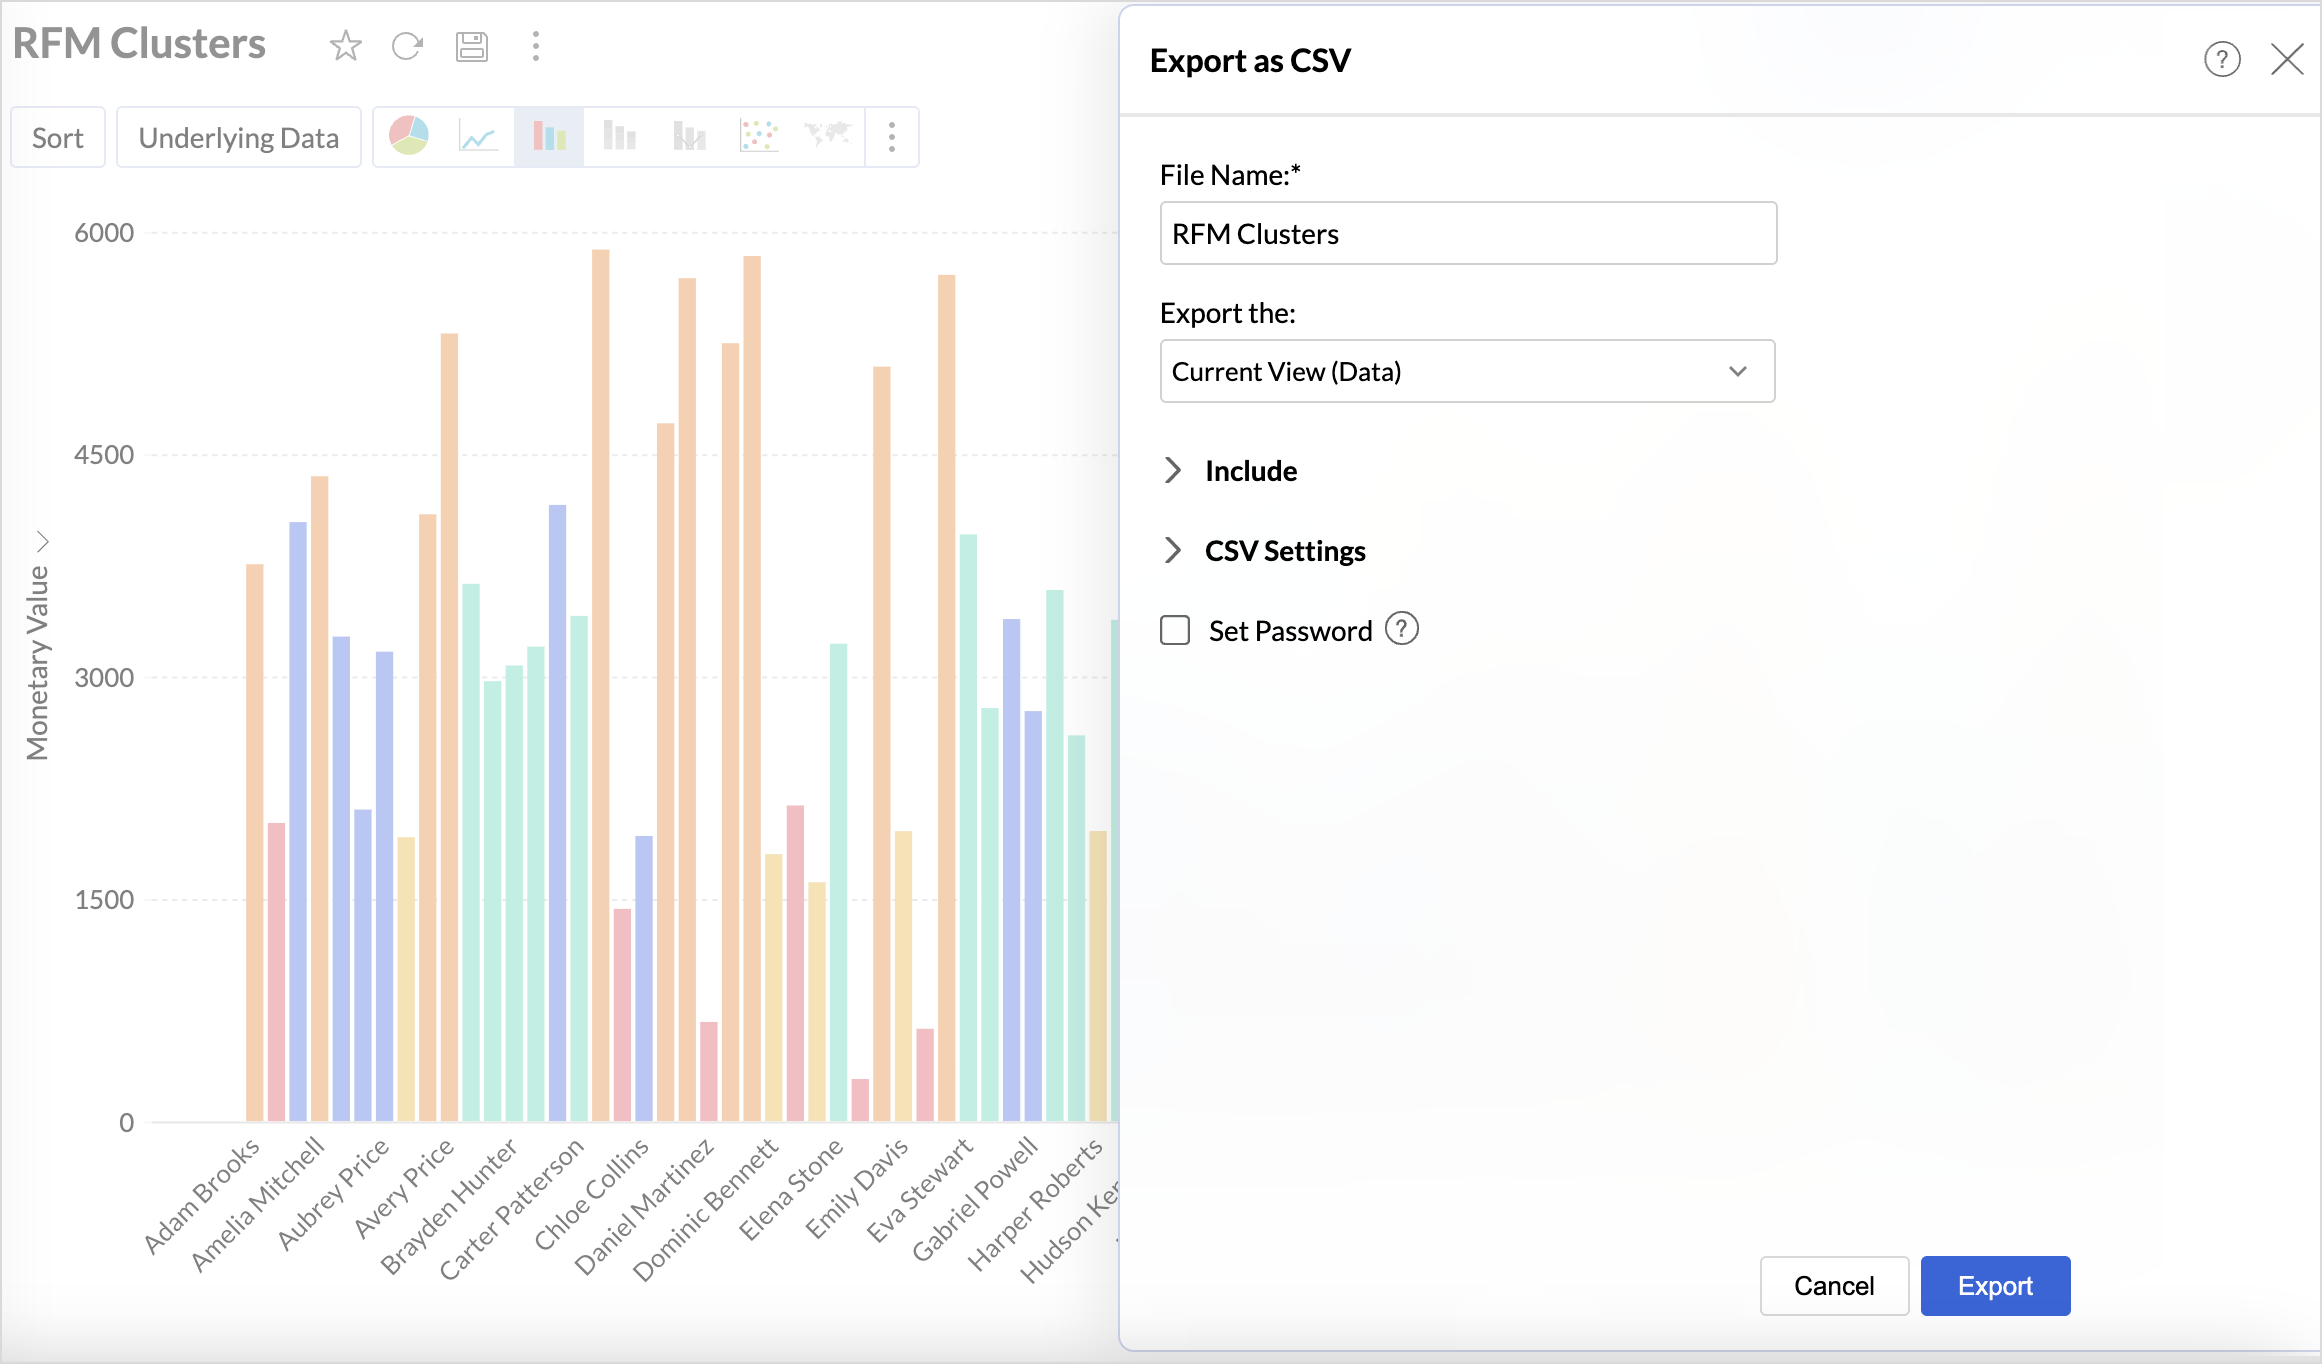
4. Export Clusters Data
Once the customer profiles have been segmented using cluster analysis, Export the Current view in the preferred table format to build more data visualizations to understand the clusters.
Build an RFM Analysis Dashboard
The RFM analysis dashboard provides a comprehensive view of customer behavior. Let's look at the steps involved in building this dashboard.
1. Import the Clusters Data
Import the downloaded clusters table back into Zoho Analytics using the files option as given below.
- Click the New icon on the side navigation panel and choose New Table/ Import Data.
- Select files and choose the Clusters Table to import and click Next.
- A data preview will be displayed; verify the data types of columns and click Create.
2. Create Reports to Understand the Characteristics of the Clusters
While the data is clustered, understanding the characteristics of each cluster is what enables businesses to take strategic actions. This includes identifying which customers need targeted marketing, personalized engagement, or retention efforts. Recognizing patterns within clusters provides insights into customer behavior, which is essential for optimizing marketing campaigns, improving retention strategies, and enhancing customer experience.
The below reports help understand the distribution of customers across different monetary value, recency and frequency segments within each cluster.
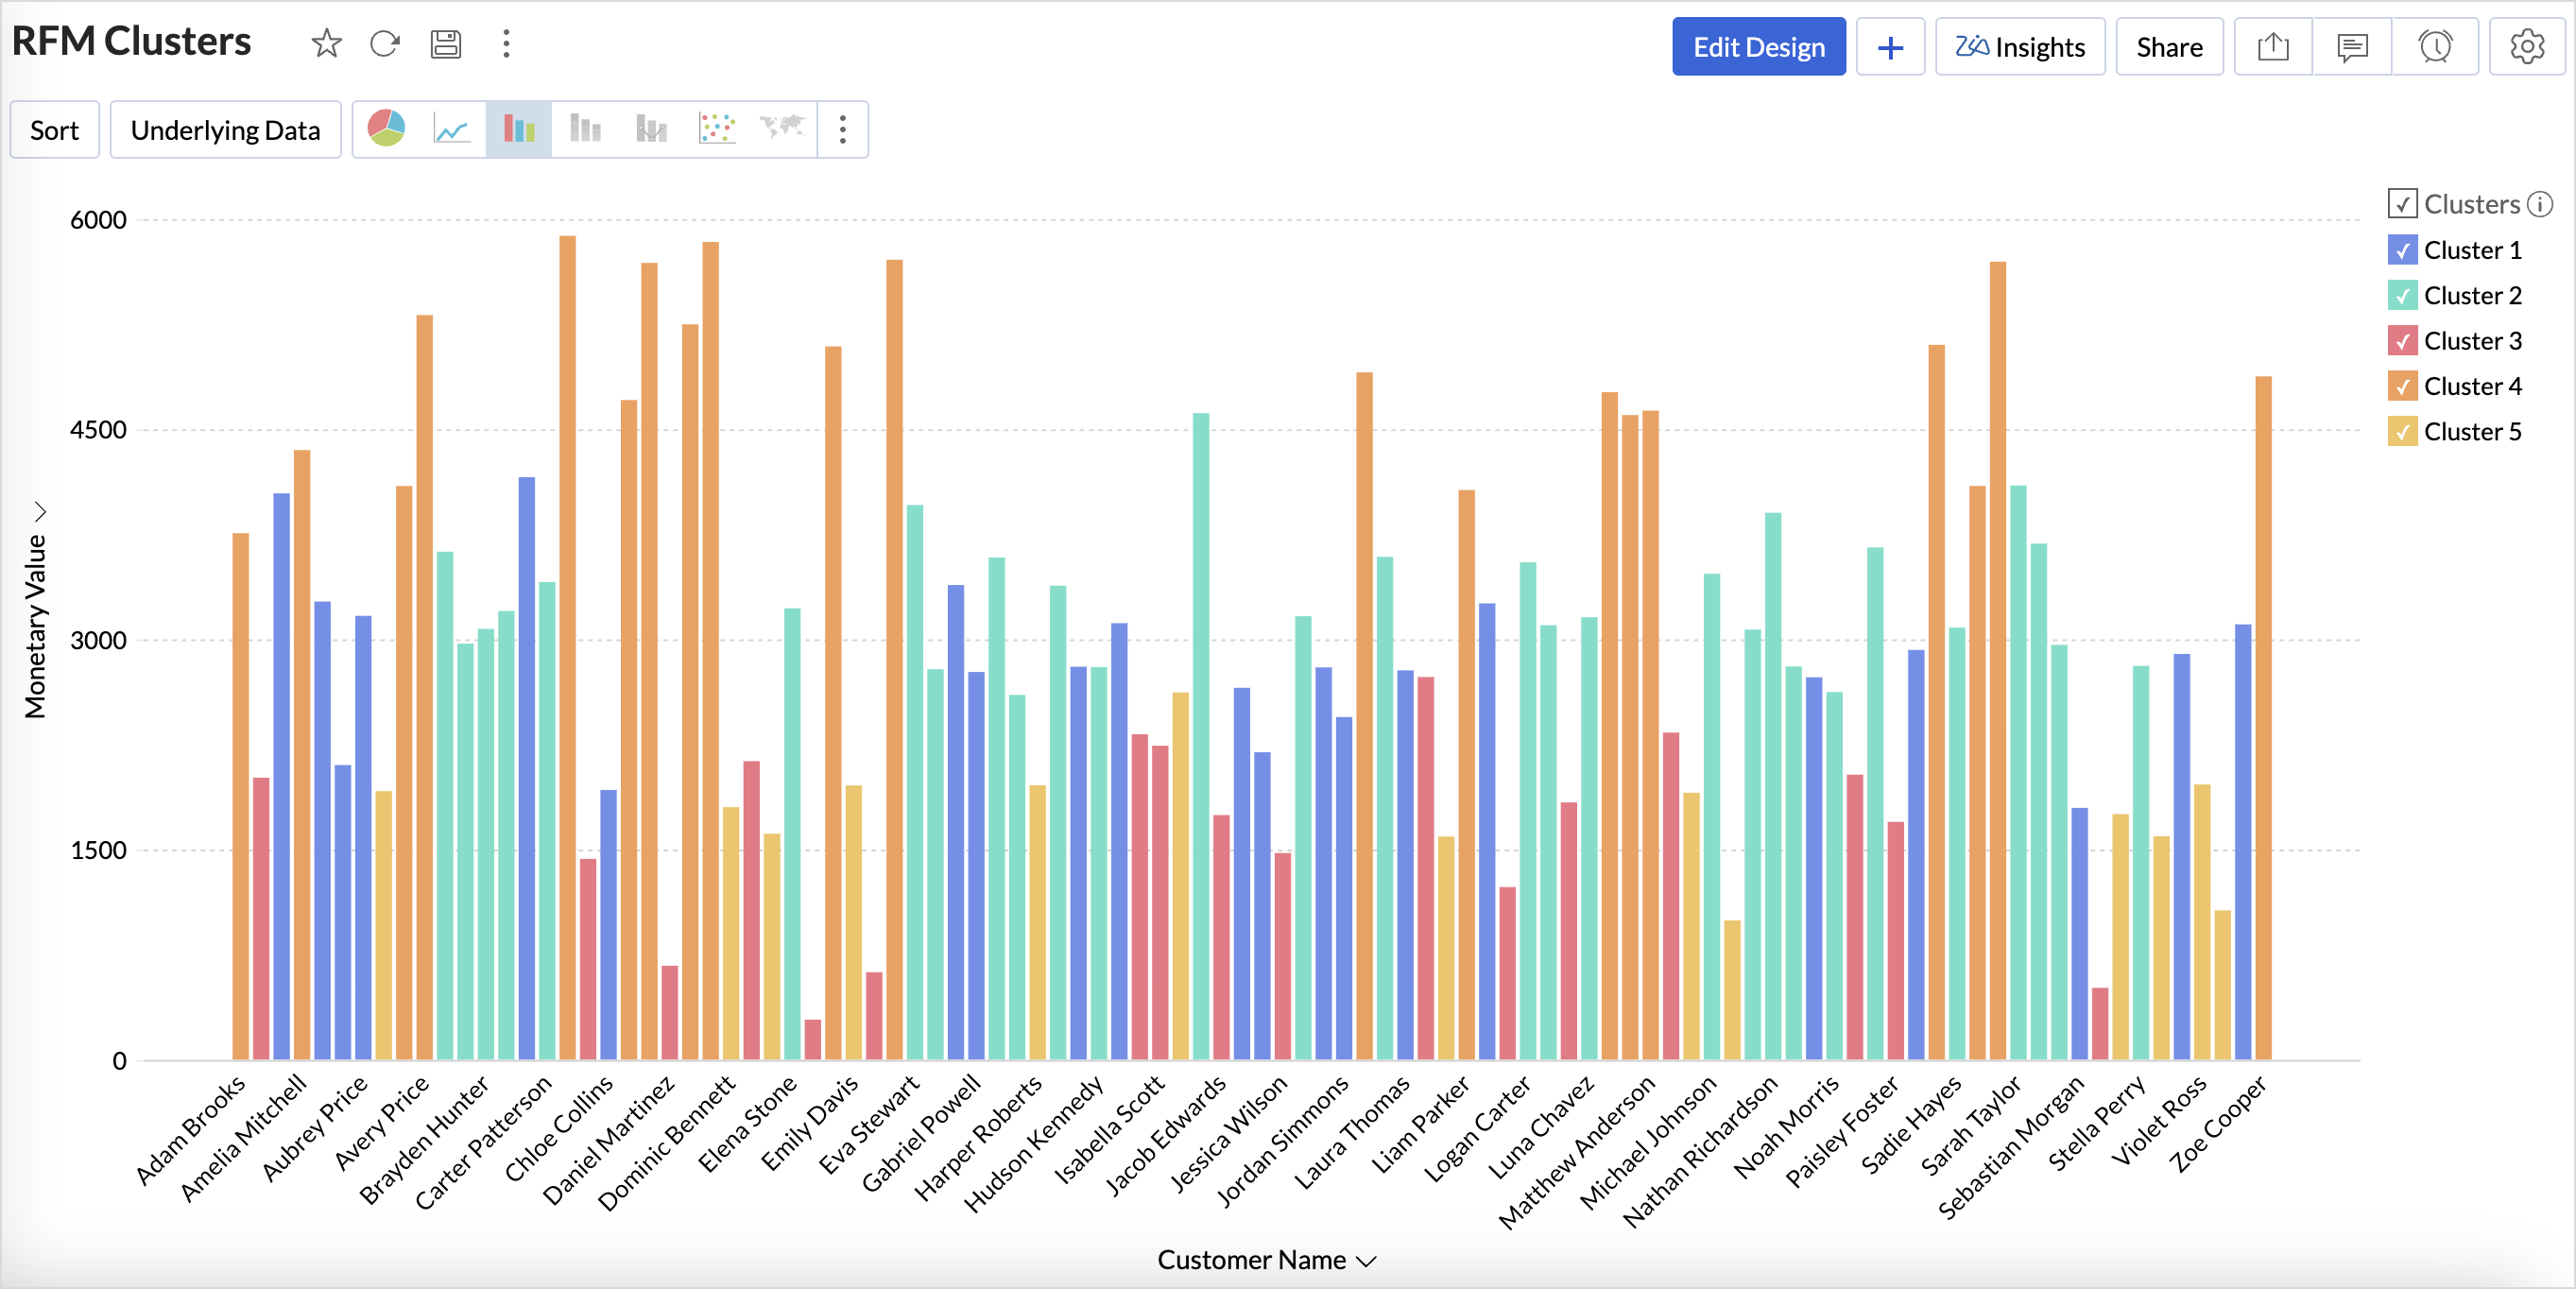
Clusters vs Monetary Value
- Access the cluster table (imported data) and click the new icon > chart view.
- Drag and drop the columns as given below:
- X-axis - Clusters
- Y-axis - Monetary Value with the Count function.
- Color - Monetary Value with the Actual Range function.
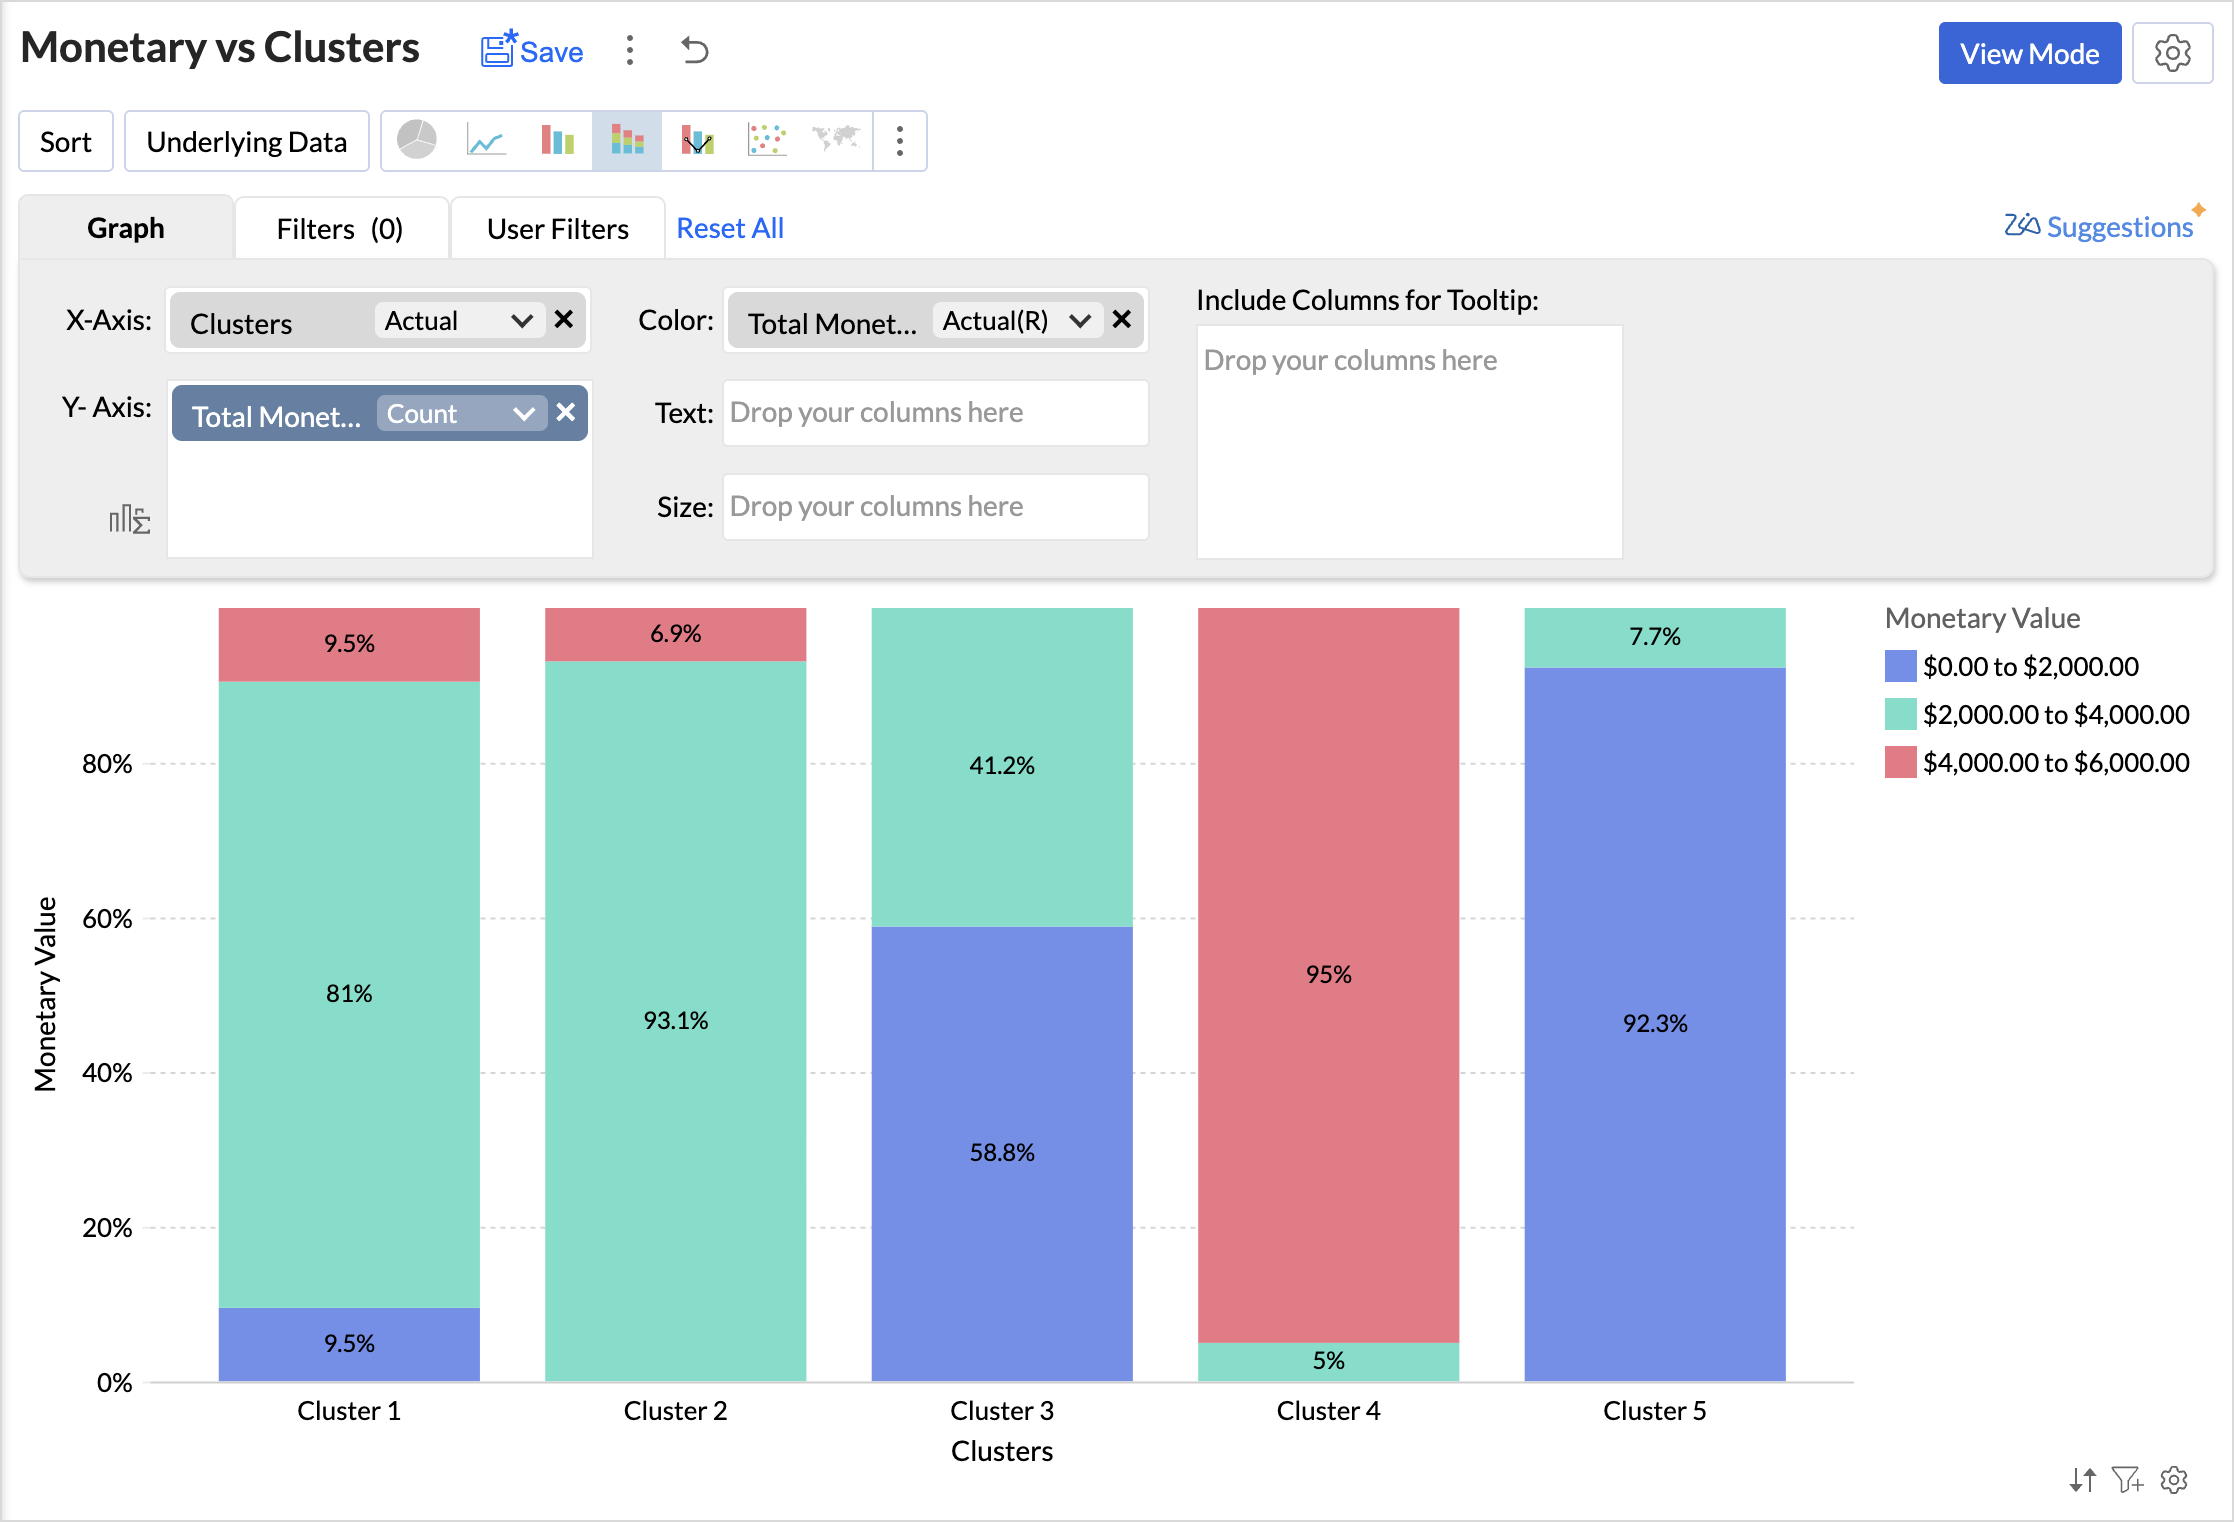
Analyzing the chart, we can infer that,
- Cluster 1 consists of a diverse group of customers spanning all spending levels.
- Cluster 2 includes moderate to high spenders who contribute significantly to revenue.
- Cluster 3 comprises low to mid-range spenders, often occasional buyers.
- Cluster 4 represents high-value customers with premium spending habits.
- Cluster 5 consists primarily of low spenders with minimal purchasing activity.
You can similarly create reports to know about the distribution of customers for the Recency and Frequency metrics.
The below table lists the characteristics of clusters
|
Cluster
|
Cluster Classification
|
Recency
|
Frequency
|
Monetary
|
Recommended actions
|
|
Cluster 1
|
Needs Attention
|
100 to 150 days
|
Low to Moderate
|
Diverse spending
|
Re-engagement campaigns, discounts, or reminders to encourage repeat purchases.
|
|
Cluster 2
|
Loyalist
|
0-50 (Highly Active)
|
High
|
Consistent moderate-to-high spenders
|
Loyalty programs, exclusive deals, early access to new products to maintain engagement.
|
|
Cluster 3
|
Potential Loyalist
|
0-50 (Active)
|
Low to Moderate | Budget-conscious, occasional buyers | Cross-selling, personalized recommendations, and value-based promotions. |
|
Cluster 4
|
Champions
|
100-150 (Inactive)
|
Moderate to High (Frequent buyers)
|
High spenders
|
VIP experiences, personalized services, and premium offers to retain and enhance their spending.
|
|
Cluster 5
|
Hibernating
|
Mostly inactive or infrequent
|
Low
|
Minimal spending
|
Win-back campaigns, incentives, special discounts, and targeted ads to regain interest.
|
Based on the above table, you can give specific labels to the clusters using the bucket columns option.
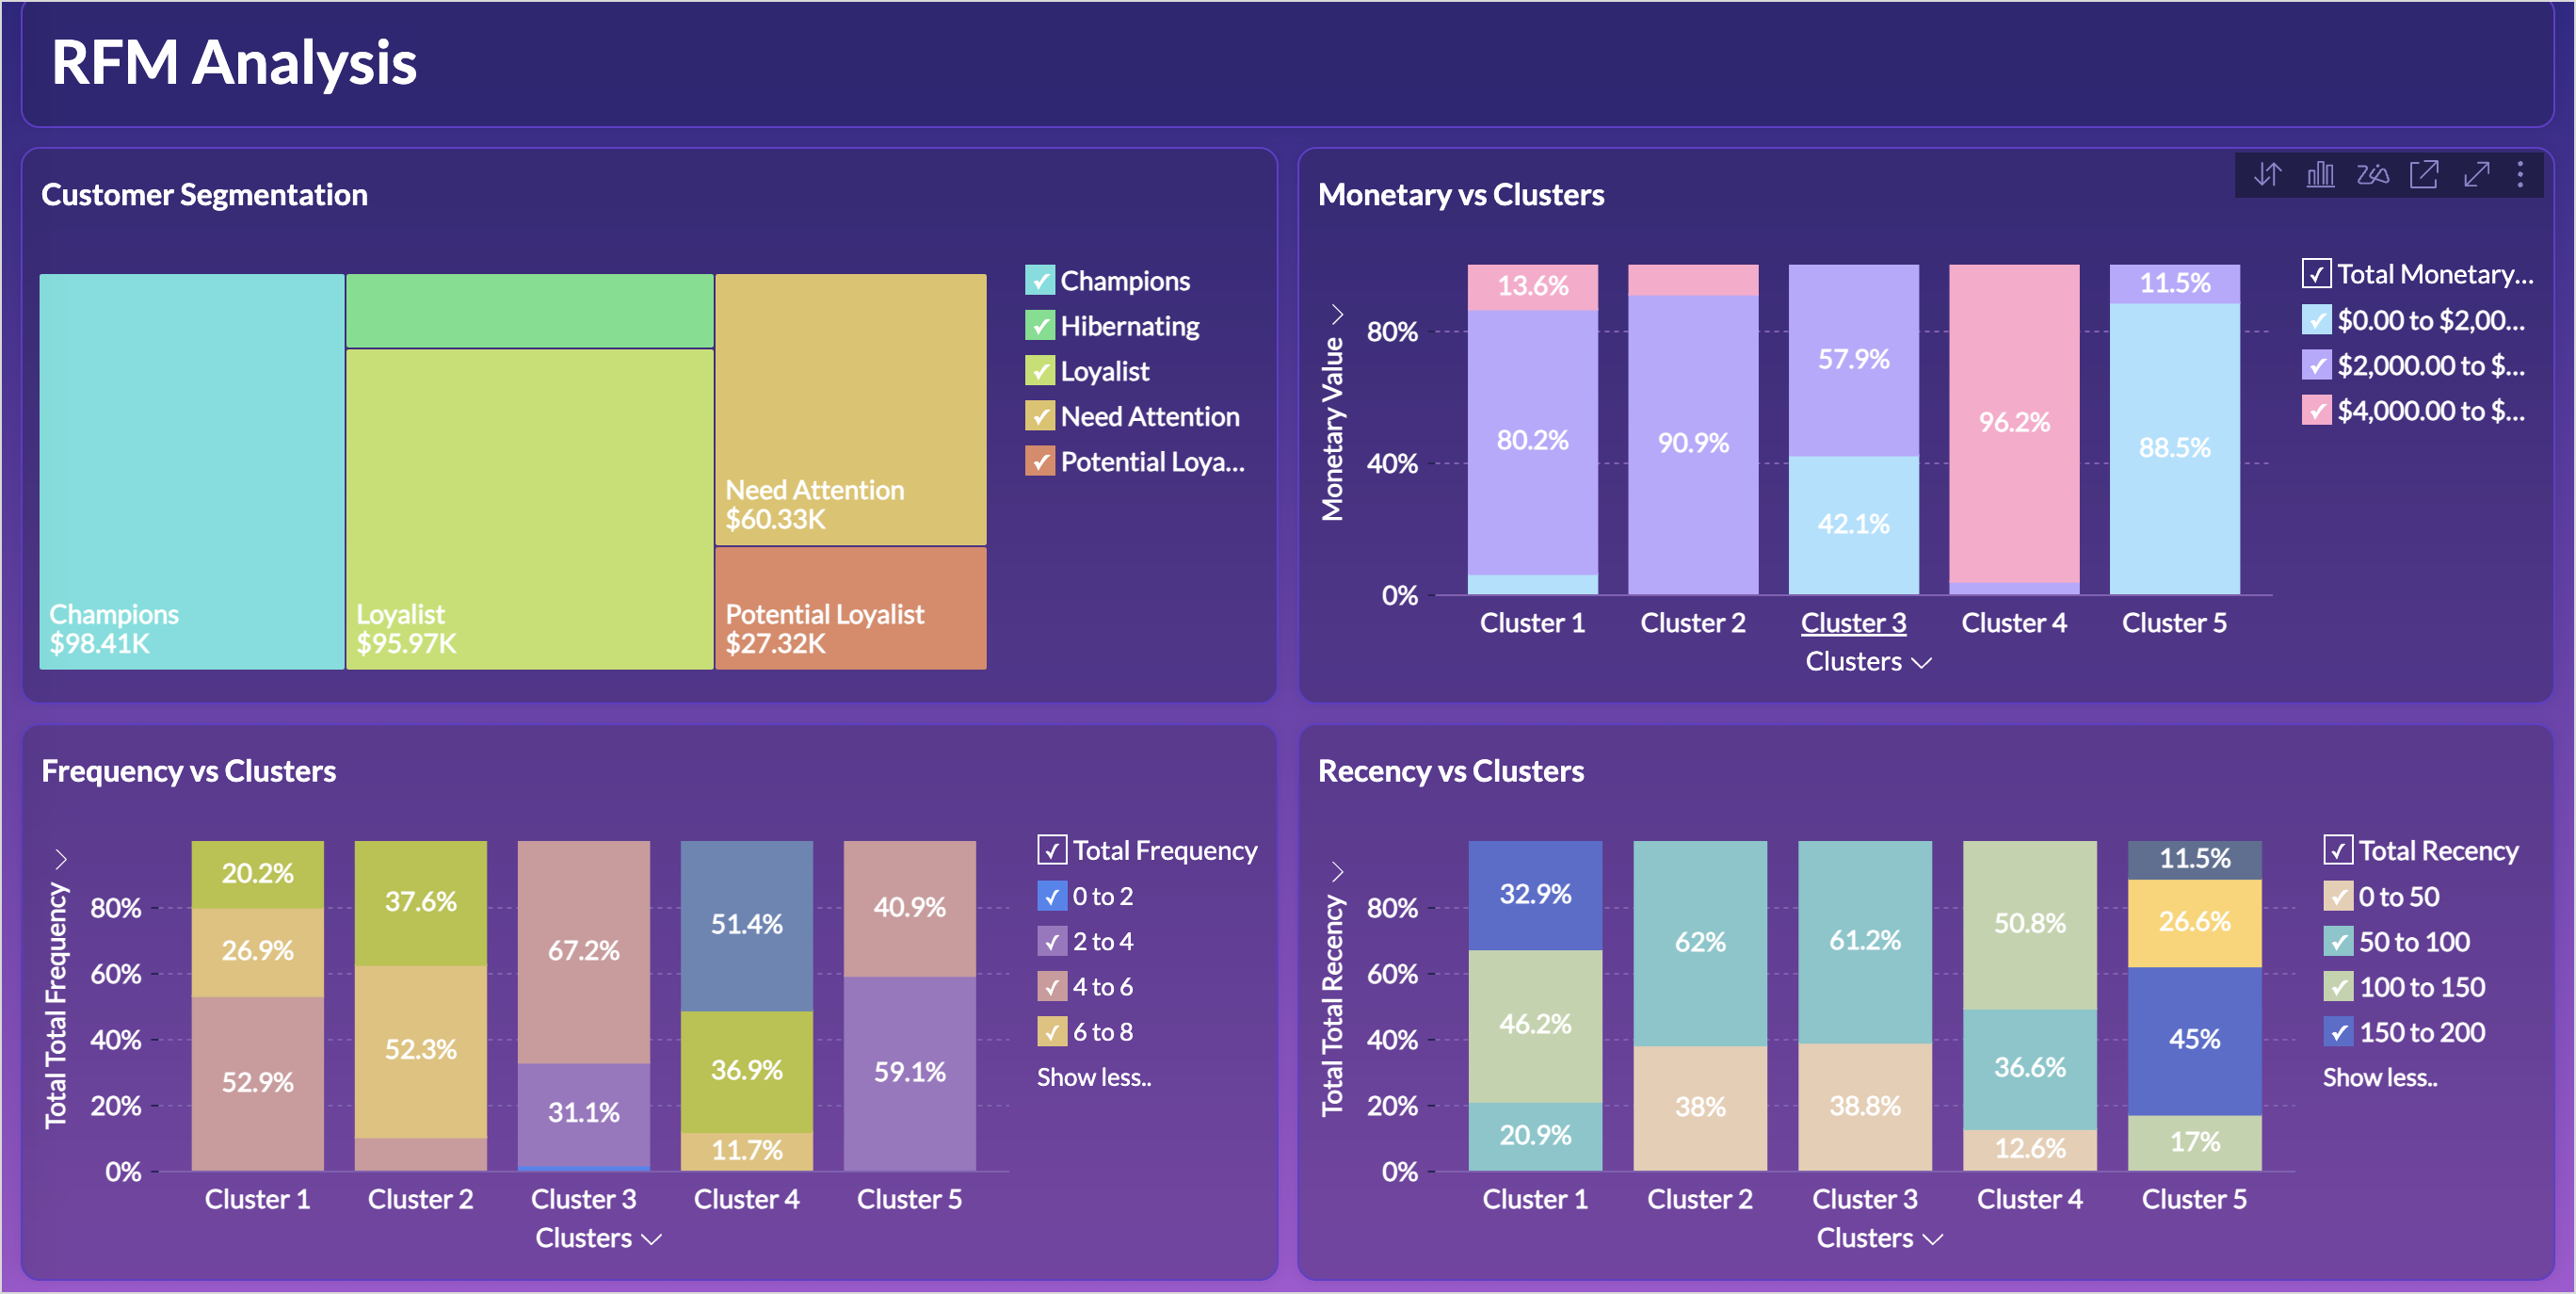
RFM Dashboard
Limitations & Considerations of RFM Analysis
While RFM analysis is a powerful customer segmentation tool, businesses should be aware of certain limitations and factors that can influence results:
- Data Freshness and Relevance: RFM analysis relies on transactional data, making the freshness and relevance of this data crucial for accurate customer segmentation. Setting up automated data imports ensures real-time updates, reducing the risk of working with stale data.
- Seasonal Variations: Customer purchasing behavior often fluctuates due to seasonal trends, holidays, and industry-specific cycles, which can impact RFM scores and lead to misleading segmentation if not accounted for properly. Instead of analyzing only recent months, compare customer behavior for the same period in previous years to detect true engagement patterns.
Topic Participants
Nisha Angel J
Hammer Group
Juan
Sticky Posts
What's New in Zoho Analytics - January 2026
Hello Users! We are starting the year with a strong lineup of updates, marking the beginning of many improvements planned to enhance your analytics experience. Explore the latest improvements built to boost performance, simplify analysis, and help youWhat's New in Zoho Analytics - November 2025
We're thrilled to announce a significant update focused on expanding your data connectivity, enhancing visualization capabilities, and delivering a more powerful, intuitive, and performant analytics experience. Here’s a look at what’s new. Explore What'sWhat's New in Zoho Analytics - October 2025
Hello Users! We're are back with a fresh set of updates and enhancements to make data analysis faster and more insightful. Take a quick look at what’s new and see how these updates can power up your reports and dashboards. Explore What's New! ExtremeWhat’s New in Zoho Analytics – September 2025
Hello Users!! In this month’s update, we’re raising the bar across multiple touchpoints, from how you bring in data, plan and track projects to how you design and brand your dashboards. We’ve added the all-new Gantt chart for project visualization, expandedAnnouncing Agentic AI - Ask Zia!
We are delighted to roll out the new agentic AI capabilities in Ask Zia, where every stage of the BI workflow is assisted by AI. With a human-in-the-loop approach, Ask Zia ensures that you’re in command of the decision, while AI handles the complexity.
Recent Topics
Reporting Tags
We've been using reporting tags for years (before itemizing was available) and now we are finding reporting these tags are impossible to track. Reports have changed in the customization and our columns of reporting tags no longer show up. We do not useConsumption based inventory
I am currently using Zoho Books for my hospitality business, which includes lodging and restaurant services. We purchase many items in bulk for storage and consumption as needed. I'd like these items to be recorded as inventory when purchased and categorizedSmarter Access Control: Role-Based Access vs. Responsibility-Based Profiles
Every business has roles, responsibilities, and workflows. While roles help define structure, responsibilities within those roles are rarely the same. As your team grows, some members need access to only a specific set of features. Others require visibilityPartner with HDFC And Sbi Bank.
Hdfc and sbi both are very popular bank if zoho books become partner with this banks then many of the zoho books users will benefit premium features of partnered banks.API in E-Invoice/GST portal
Hi, Do I have to change the api in gst/e-invoice portal as I use zoho e books for my e-invoicing. If yes, please confirm the process.Member role in zoho meeting
does a user with member role can see other users in the organizationHow to post more than 4 Images on Instagram?
Hi I read several articles to the topic od how to post more than 4 images on instagram, but i can't figure out how it works. I can't find the content editor and i installesd the z share extension for google chrome. Could someone please help me? ThanClone Recurring Expenses
Our bookkeeping practices make extensive use of the "clone" feature for bills, expenses, invoices, etc. This cuts down significantly on both the amount of typing that needs to be done manually and, more importantly, the mental overhead of choosing theZoho Books - How to Invoke a Custom Function in Schedulers
We have multiple schedulers that send emails to customers in batches. Currently, we are maintaining the same code across several schedulers. Is it possible to use a custom function inside a scheduler script? If yes, how can we invoke the custom functionSpecial characters (like â, â, æ) breaking when input in a field (encoding issue)
Hey everyone, We are currently dealing with a probably encoding issue when we populate a field (mostly but not exclusively, 'Last Name' for Leads and Contracts). If the user manually inputs special characters (like ä, â, á etc.) from Scandinavian languages,Set Custom Icon for Custom Modules in new Zoho CRM UI
Notes badge as a quick action in the list view
Hello all, We are introducing the Notes badge in the list view of all modules as a quick action you can perform for each record, in addition to the existing Activity badge. With this enhancement, users will have quick visibility into the notes associatedIs Zoho Live Chat compatible with WordPress CMS?
Hello, I have a website called www.jjrlab.com and I'm interested in using Zoho Chat on it. Does it support WordPress CMS? Thanks.Introducing spam detection for webforms: An additional layer of protection to keep your Zoho CRM clean and secure
Greetings all, One of the most highly anticipated feature launches—Spam Detection in webforms—has finally arrived! Webforms are a vital tool for record generation, but they're also vulnerable to submissions from unauthenticated or malicious sources, whichBring your CRM and Desk app inside SalesIQ with widgets
Have you ever been confused and frustrated with multiple open tabs and switching back and forth from SalesIQ to other apps to perform your business-specific operations? How effective would it be to have all the required tools and data of the apps youSpeak Your Customers' Language: SalesIQ's chatbots now support 30 languages 🤖
We're unveiling some major upgrades to our chatbot that are set to revolutionize your experience! Now SalesIQ support 30 languages for both Zobot and Answer bot. By speaking your customers' language, you can enhance engagement, improve customer satisfaction,Repeat Column merge in ZOHO writer columns doesn't allow to set max columns per row
I'm using ZOHO writer to merge data from a ZOHO CRM subform and I want it to make a table. We're using Insert Table for Column Repeat, because this is what we need. (Name of column (Teamname) and underneath that a list of names of teammembers). It worksPersisting email signals to contact timeline?
Hello there. Regarding the email signals that are logged when a contact opens an email, am I correct that these signals are not logged to a contact's timeline? Ideally, I would like to have this context available for future follow-ups, if the contactTrouble with using Apostrophe in Name of Customers and Vendors
We have had an ongoing issue with how the system recognizes an apostrophe in the name of customers and vendors. The search will not return any results for a name that includes the mark; ie one of our vendors names is "L'Heritage" and when entering theReally want the field "Company" in the activities module!
Hi team! Something we are really missing is able to see the field Company when working in the activities module. We have a lot of tasks and need to see what company it's related to. It's really annoying to not be able to see it.🙈 Thx!Upcoming update to Google Drive integration in Zoho Creator
Hello everyone, We're writing to inform you about an upcoming update to how Zoho Creator integrates with Google Drive. In Zoho Creator, during actions like importing files to create an app or attaching files to fields, you can choose files directly fromManaging Scheduled Replies
Communication is most effective when the intended message reaches the right person at the right time. However, this can be challenging when communication occurs across different time zones. By scheduling replies, businesses can ensure that responses reachShow price book list price
When using price books, once you add products to the price book in the Products related list you can display the Unit price which is the default list price; however, there is no option to show the price book list price. To see the price book list priceAllow Attaching Quartz Recordings to Existing Zoho Support Tickets
Hi Zoho Team, We would like to request an enhancement to how Zoho Quartz recordings integrate with Zoho Support tickets. Current Behavior: At the moment, each Quartz recording automatically creates a new support ticket. However, in many real-world scenarios:Can I hide empty Contact fields from view?
Some contacts have a lot of empty fields, others are mostly filled. Is there a way I can hide/show empty fields without changing the actual Layout? I would like to de-clutter my view, and also be able to add information later as I am able. I would beManage user roles and profiles from the Bigin app (iOS and macOS)
Hello everyone! We're happy to announce that you can manage user roles and profiles from the Bigin mobile app. The Users & Controls section has three subsections: Users, Profiles, and Roles. Users Employees who belong to your Bigin organization are calledSupport Bots and Automations in External Channels
Hello Zoho Cliq Team, How are you? We actively use Zoho Cliq for collaboration, including with our external developers. For this purpose, external channels are a key tool since they work seamlessly within the same interface as all of our other channelsForm to PDF template
I am looking to create a Form and when information is inputted, it will merge it into a PDF template we already have. There could be multiple lines in the form and each line inputs information into a new page of a PDF template.Please verify my account
Hi, We have just launched our website and received media coverage in our country. Hundreds of users are signing up for our platform every day. We would like to send them a welcome email, but we are unable to do so because our ZeptoMail account has notSubject character limit increase
We have an occasional user case where subject lines exceed 500 characters which is the ZeptoMail imposed limit. While I understand long subject lines are not "best practice", these are particular notification emails with specific information for clientAccount blocked
Yesterday I got my Zeptomail account blocked due to too many hard bounces. My account is used exclusively for sending transactional emails (eg. your order has been shipped, a form has been filled, etc) and the sudden blocking impacted hundreds of websitesNested notebooks
Dear Sir/Madam, I would like to know if it is possible to nest notebooks. It would be very helpful when there are too many, as it would improve organization. Thank you for your response. Best regards.Cannot see correct DNS config for mail after moving domain to another provider
I have moved my domain from one provider to another and after that zoho mail stopped working (expected). Problem is, zoho mail admin panel still shows (10 hours after move) that all records are correct while I haven't changed anything in my domain DNSProactive Alert for Existing Open Tickets per Contact / Account
Hello Zoho Desk Team, Greetings, and hope you’re doing well. We would like to submit a feature request aimed at improving agent awareness and efficiency when handling tickets in Zoho Desk. Use case When an agent opens a ticket (new or existing), it isTicket resolution field - can you add links, video, and images?
Seems like the ticket resolution fields is just a text field. Any plans to add the ability to add links, images...the same functionality in the problem description box? I would like to send the customer a link to a KB article, a link to our Wiki, embedTicket Resolution - Add rich formatting, screenshots and attachments
The resolution field only allows plain text at the moment. Many of our resolutions involve posting screenshots as evidence, it would be great for us to be able to have rich text formatting, be able to paste screenshots and add attachments in the solutionKaizen #140 - Integrating Blog feed scraping service into Zoho CRM Dashboard
Howdy Tech Wizards! Welcome to a fresh week of kaizen. This week, we will look at how to create a dashboard widget that displays the most recent blog post of your preferred products/services, updated daily at a specific time. We will leverage the potentialConvert Lead Automation Trigger
Currently, there is only a convert lead action available in workflow rules and blueprints. Also, there is a Convert Lead button available but it doesn't trigger any automations. Once the lead is converted to a Contact/Account the dataset that can be fetchedI'm getting this error when I try to link an email to a deal inside the Zohomail Zoho CRM extension.
When I click "Yes, associate," the system displays an "Oops!! Something went wrong" error message. I have attached a screenshot of the issue for reference.Zoho Sheet - Desktop App or Offline
Since Zoho Docs is now available as a desktop app and offline, when is a realistic ETA for Sheet to have the same functionality?I am surprised this was not laucned at the same time as Docs.Next Page