Visualize your data with a new set of charts: Treemap, Butterfly, Sankey, and Cluster charts in Zoho CRM
Dear customers,
When it comes to analytics, it's not just about the numbers; it's about understanding the story behind them.
With that philosophy in mind, we’re excited to introduce a line of representations to the existing array of chart types in Zoho CRM: Treemap, butterfly, sankey and cluster charts. Let's go!
Treemaps
Treemap charts are used to visually represent hierarchical datasets in a rectangular layout. It aligns its parent categories as larger tiles with their sub-categories nested within them. The size of each tile is proportional to its corresponding value, making it easy to compare different segments within the hierarchy.
This is how a treemap chart looks:

These structured data representations help you understand overall performance and contributions, as well as compare participating entities at a glance.
Unlike traditional bar charts or pie charts, treemaps can be used if your datasets are large and exhibit parent-child relationships.
Here are some examples to better understand their usage:
Comparing revenue distribution between functions
A company's revenue is distributed among its functions before it gets further disbursed to its employees. Treemap charts can be used to depict this distribution and compare it between functions. As you can see below, the hierarchy can be represented as a treemap to compare it directly with other functions:

The hierarchy at the top shows just the numbers and levels, but the treemap chart represents the numbers proportionally, allowing leaders to visualize the difference in distribution.
Interpretation: As you can easily see in the treemap, sales and marketing receive the same amount of revenue, while engineering is given significantly more than the other two.
Likewise, with treemap charts, you can:
- Compare popular lead sources with lead counts is the measure and lead source being the participating entity—a classic single-grouping configuration.
- View cost savings achieved across departments. With the departments as the grouping parameters and the cost saved as the measured amount, the chart lays out all the departments as tiles in proportion, based on money saved.
- Compare ad spends across channels, where channels are the parent grouping and ad spend is the measured unit.
Butterfly
Butterfly charts are used to compare two related datasets side-by-side, resulting in a representation that looks like a butterfly or tornado.
Now, how does it differ from bar charts?
The standard bar chart can compare two entities for a given measure. Say, you are comparing the performance of Mary and Charles. The two users' data is represented using bars, and the length will denote their performances. But, when it comes to comparing their performances over a period or their contribution across different stages, a bar chart is not sufficient.


With butterfly charts, you can:
- Compare revenue between two of your branches each month. With branches being compared for sum of sales revenue, grouped by closing date.
- Compare the performance of two reps in a given quarter. Compared between two users for average of amount of deals, grouped by closing date until today.
In addition to the user-based comparison above, butterfly charts are well-suited to visualizing other types of data comparisons, like:
- Picklist-based comparisons
- Duration-based comparisons
- Aggregate-based comparisons
Business scenario
Comparing the number of deals closed for each lead sources: Duration-based comparison
You can identify the productive lead source by comparing the number of deal closures for every lead source in your organization based on their closing week.

Analyzing effective sales methodology, inbound vs. outbound: Picklist-based comparison
Businesses use both inbound and outbound lead generation strategies, and each of these methods can reap different results based on the season and occasion. By comparing inbound versus outbound each month, you can identify which works best at what time.

Analyze the amount versus the expected revenue between accounts: Aggregate-based comparison
Expected revenue is a result of a deal's progression in the sales pipeline. Comparing the amount versus their expected revenue will not only help visualize the expected revenue of participating accounts but also indicate the accounts' stage in the sales pipeline.

Sankey
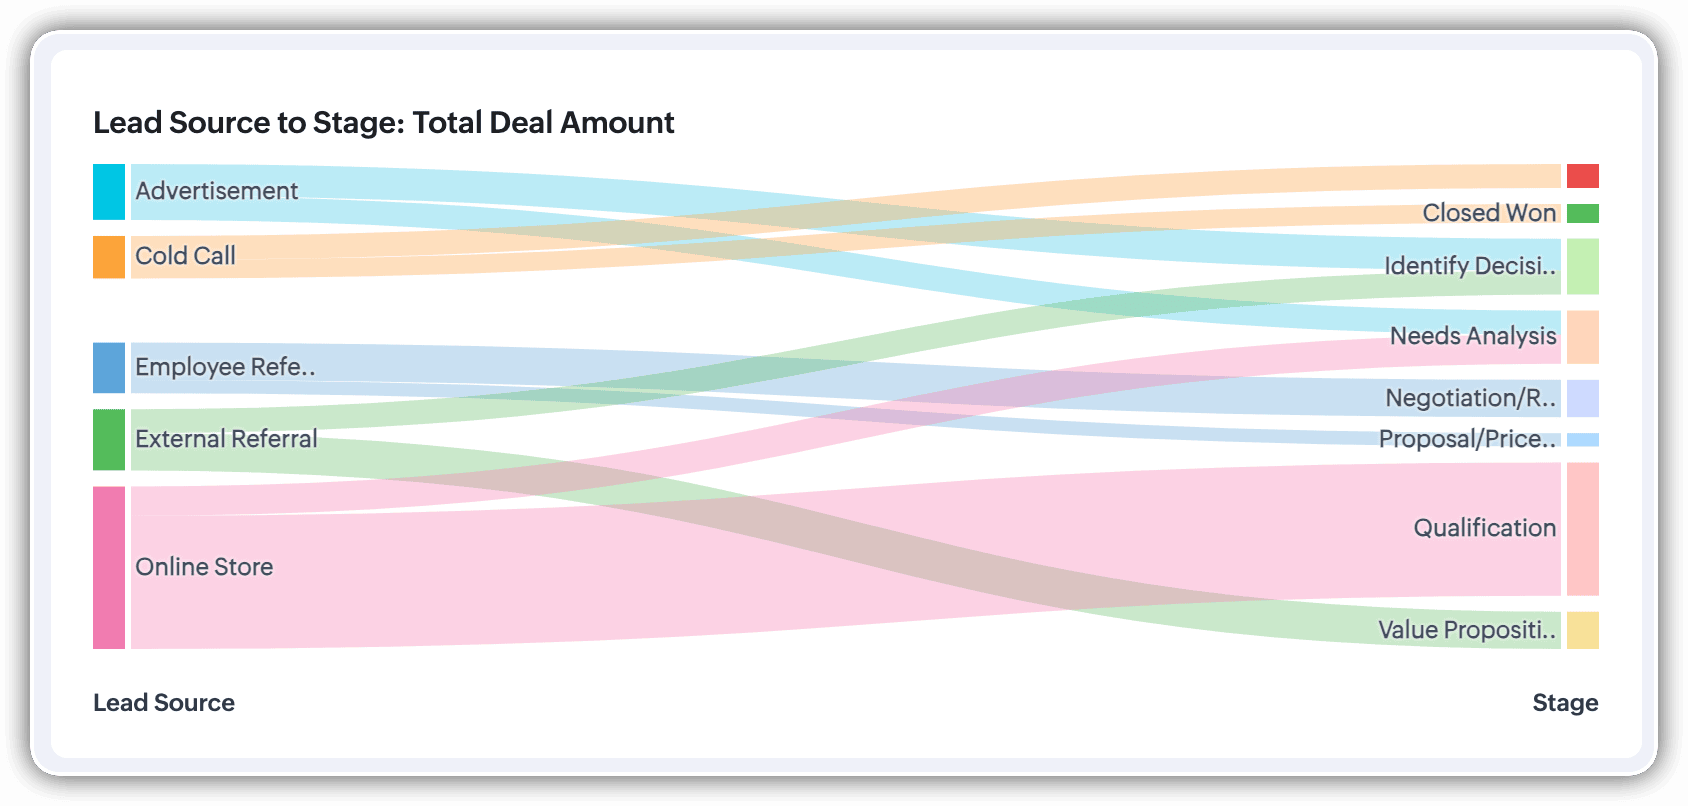
A Sankey Chart is designed to visualize the movement of data across different data groups. Unlike traditional charts—such as bar, column, pie, or donut—that mainly provide a static distribution of values, the Sankey Chart focuses on illustrating the flow between multiple segments or grouping fields. This makes it an ideal choice when you want to track how values (like lead counts, revenue, or deal statuses) move from one category to the next.

Key features
- Flow visualization: With the Sankey Chart, you can observe the movement of data between different groups.
- Multiple grouping fields: This chart works best when you have at least two grouping fields. You can go even further and add a third grouping to see an even more detailed mapping of your data flow.
- Simple configuration: The configuration for the Sankey Chart is as simple as any other chart type in Analytics.
Business scenarios:
Imagine you’re a sales manager trying to get a better handle on your team’s performance and your company’s pipeline. You want to understand not just how many deals are coming in, but also which sources are contributing the most value—and how those deals are progressing through different sales stages.
Let’s say you want to understand which lead sources are driving the most deal activity and how those deals progress through the pipeline. You can create a Sankey chart that maps the count of deals from Lead Source to Stage.

After analyzing the chart, you might notice that Online Store brings in a high volume of early-stage deals, while sources like External Referral contribute fewer deals that are more likely to reach advanced stages like Proposal or Negotiation.
This insight helps you prioritize nurturing the most profitable channels.
Sankey charts can also be helpful in other operational scenarios where understanding transitions across stages or teams is essential:
- Regional revenue distribution: Visualize how revenue flows across different regions, product categories, and their corresponding annual revenue. This helps you compare which regions contribute the most to each product line and where your high-value segments lie.
- Ticket handling flow: Visualize the flow of support tickets from their origin channel to internal departments and finally to resolution statuses. This can reveal workload imbalances or common points of delay in your support process.
Cluster
A cluster chart is similar to stacked column charts, but instead of stacking horizontally, the data is represented as vertical bars. As you create a column chart with multiple groupings, you can change the type of column chart to a cluster chart to achieve this representation.

In the above image, you can see the stacked column chart compares the number of lead conversions based on popular sources between countries. The stacks appearing on top of existing stacks ask you to calibrate the record count (y-axis) based on the previous stacks, which can lead to inaccurate interpretations. In this case, a cluster representation will paint a clearer picture of the analyses.
Other minor enhancements:
In addition to the three charts we mentioned above, we've also made the following minor changes:
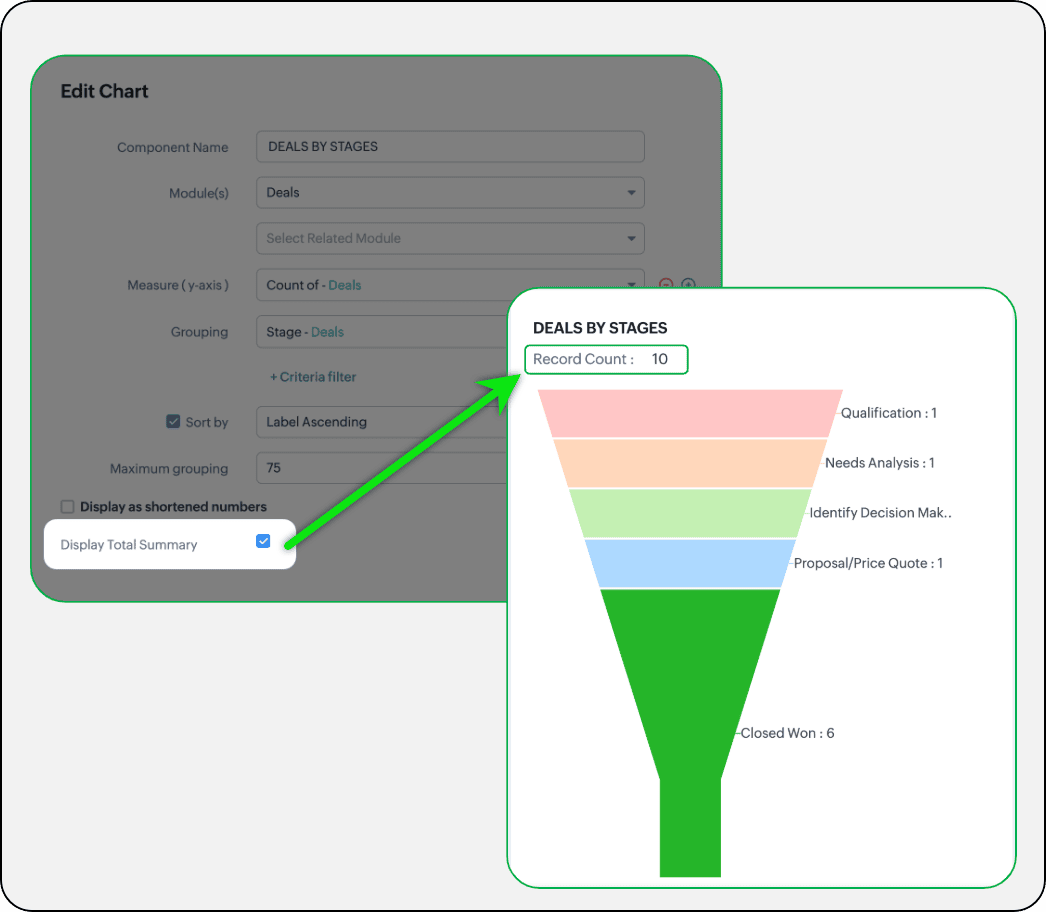
- Display total summary: Thus far, for all charts, each participating measure included labels. Now, to better understand overall contributions, a check box to display the total summary is provided under More options on the Chart Configuration page. Based on the configuration, the total revenue or the rolled-up quantities will be prominently displayed.
- Merge Y-axis: For charts that use two y-axis measurements, the intention is to view the progression of one entity against these two measures. Despite the scale, if the y-axis on the left is disproportionate to the values of the y-axis on the right, the plotted graph will result in a graphically and logically incorrect representation.
As you can see in the image below, the plot area of the sum of amount bar and the sum of expected revenue aligns close together, while, the difference between $700,000 and $40,500 is drastic, creating inaccurate interpretations.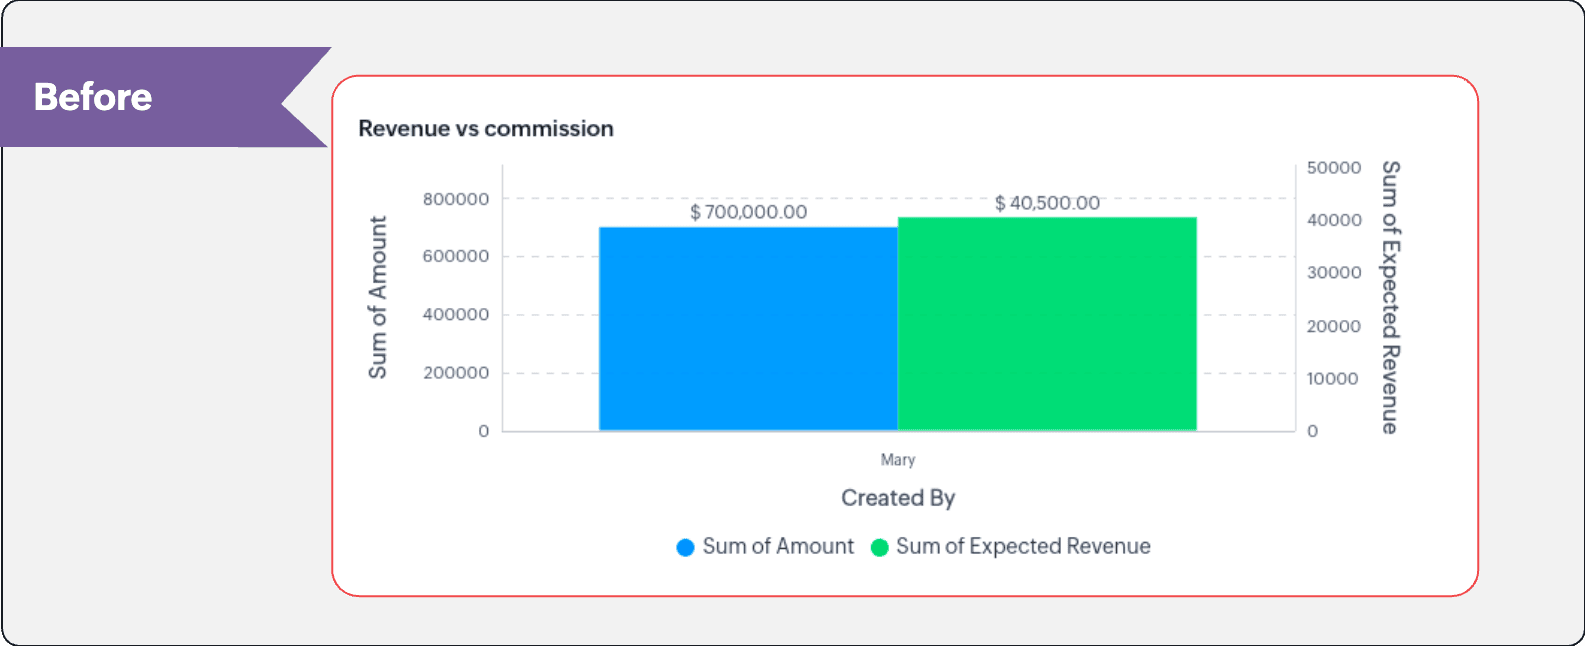
In this enhancement, we're allowing neighboring values of measures to merge so that the interpretation can be more visually accurate.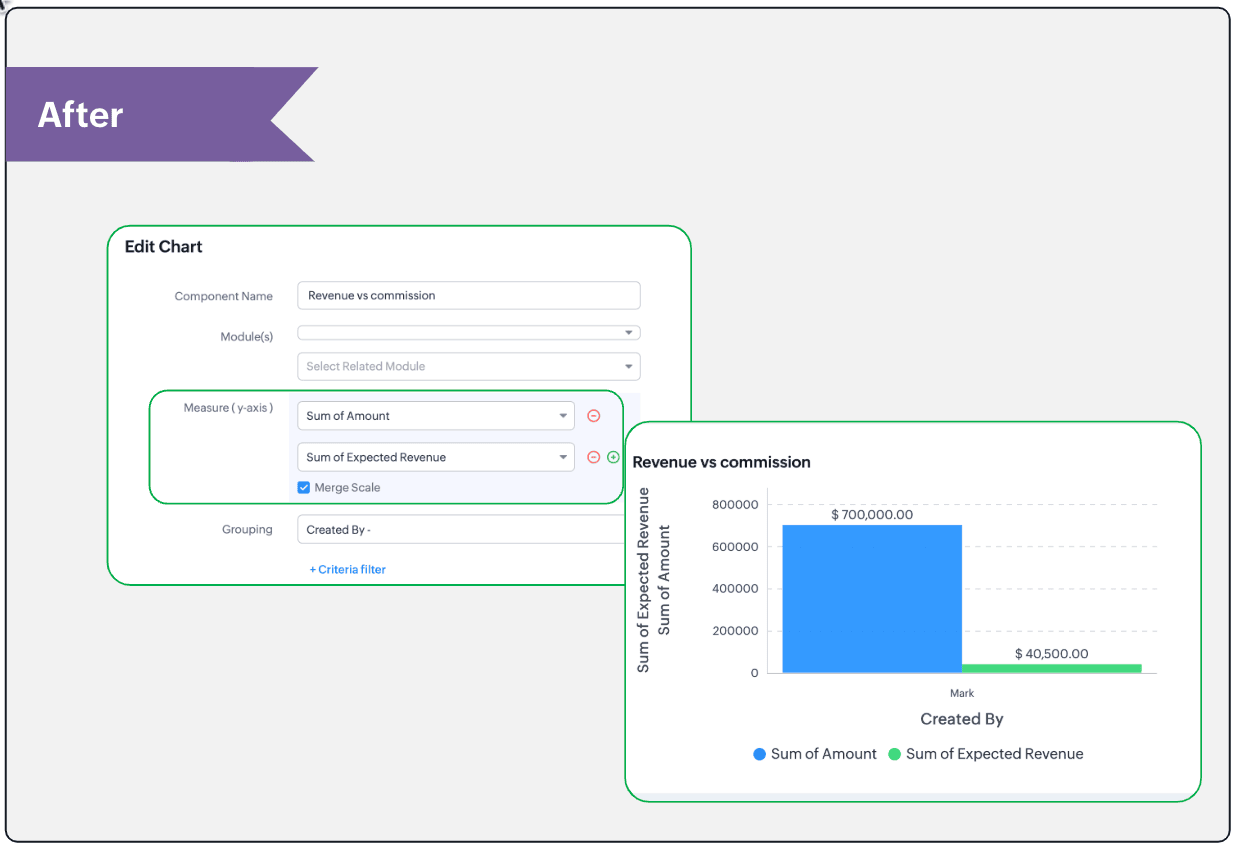
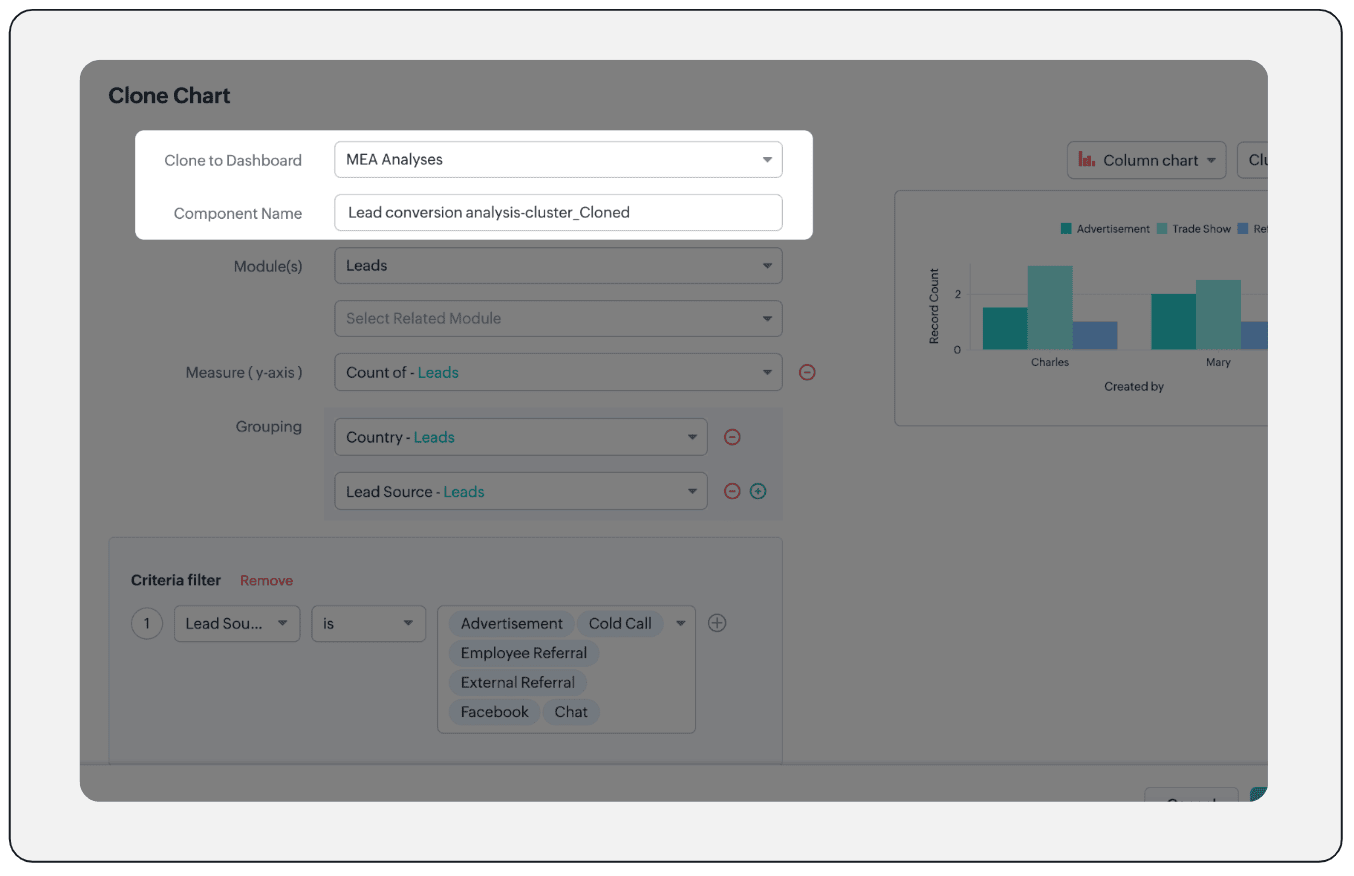
- Clone components to a different dashboard: Dashboards in Analytics serve in unique ways for various audiences—there can be separate dashboards for the sales team, marketing team, engineering team, and so on, and the chances of using the same measure for reference is common. Thus, when you clone a chart, you can now determine the target dashboard in which the cloned chart can be placed.
Resource: Help document
Thanks and have a good one!
Kind regards,
Saranya Balasubramanian
Saranya Balasubramanian
Topic Participants
Saranya Balasubramanian
Sticky Posts
Good news! Calendar in Zoho CRM gets a face lift
Dear Customers, We are delighted to unveil the revamped calendar UI in Zoho CRM. With a complete visual overhaul aligned with CRM for Everyone, the calendar now offers a more intuitive and flexible scheduling experience. What’s new? Distinguish activitiesCreate and populate a record in an instant: Introducing zero-shot field prompting to Zia's ICR
A couple of months ago, we upgraded our in-house AI image detection and validation tool, Zia Vision, with intelligent character recognition (ICR). By training Zia with sample images, you could create and enrich CRM records with data extracted from standardIn-person ZUG Meetups for Real Estate Professionals - US Q1 2026
The Real Estate Zoho User Group is going on a multi-city, in-person meetup tour across the US, and we’d love to see you there! These meetups are a great opportunity to: Connect with fellow real estate professionals using Zoho Share challenges and discoverNimble enhancements to WhatsApp for Business integration in Zoho CRM: Enjoy context and clarity in business messaging
Dear Customers, We hope you're well! WhatsApp for business is a renowned business messaging platform that takes your business closer to your customers; it gives your business the power of personalized outreach. Using the WhatsApp for Business integrationTwo new enhancements in Zoho CRM: Introducing new criteria for user fields and displaying group information in users page
Announcement moderated on 14th June, 2023. Dear All, These enhancements are opened for all users in all DCs. ------------------------------------------------------------------------------------- Dear All, Hope you're well! We are here with two useful
Recent Topics
How we cut CRM updates from ~20 minutes down to 2, our real workflow
Updating the Zoho CRM after every call used to be one of the biggest time sucks for our team. By the time you write your notes, clean them up, fill in the fields, and log everything properly… you’ve easily lost 15–20 minutes per call. We started experimentingAdd home page or dashboard in CRM customer portal
is it possible to add home page or dashboard in CRM customer portal?User Tips: How to change the the label display name of a system defined field
Most users know how to change field label names via Settings > Modules & Fields but if you want to change the name of a system defined field you can’t as there is no “edit properties” option. However with a simple hack you can edit any system definedSearch not working!
I have items in my notebook tagged but when I search for a tag nothing comes up! Any fix for this?Zoho Analytics Regex Support
When can we expect full regex support in Zoho Analytics SQL such as REGEXP_REPLACE? Sometimes I need to clean the data and using regex functions is the easiest way to achieve this.Zoho CRM Community Digest - October 2025 | Part 1
Hello Everyone! Here's a quick recap of first two weeks of October! Product Updates: Zoho CRM Android App Update: Surveys, Blueprints, and Smarter Mobile Features! Zoho CRM’s Android app just got a useful upgrade. You can now share records, upload yourAdd Custom Field Inside Parts Section
How to Add Custom Field Inside Parts Section in Workorder like Category and Sub- CategoryWhat is New in CRM Functions?
What is New in CRM Functions? Hello everyone! We're delighted to share that Functions in Zoho CRM have had a few upgrades that would happen in phases. Phase 1 An all new built-in editor for better user experience and ease of use. ETA: In a couple of days.Automate onboarding emails with CRM Workflow and Accounts module
We’re a B2B SaaS company selling to public-sector organisations. Each organisation is stored as an Account in Zoho CRM, and each organisation typically has multiple associated Contacts. Our backend syncs product-usage data (setup status, user activity,Using a CRM Client Script Button to create a Books Invoice
Hello, I need help handling error messages returned to my client script from a function. The scenario I have setup a client script button which is available from each Deal. This CS executes a crm function, which in turn creates an invoice based on theImportant update: Enhanced security measures for account operations in Zoho Cliq
Greetings from the Zoho Cliq team! We’d like to share an important security update that has an influence on some admin actions such as password reset, MFA reset, and MFA backup code generation. What’s changing? With our latest security enhancements, theseBoosting efficiency through faster ticket rendering
This enhancement will provide faster access for support teams and end-users, significantly boosting productivity for everyone. Get ready for a more efficient and satisfying experience! Immediate benefits Faster ticket rendering reduces wait times andRead webpage - MSXML2.ServerXMLHTTP
I have the following VBA script, put together from various sources (mainly zoho forum/help/support, so it once worked, I guess): private Sub GetListOfSheets() Dim url As String Dim xmlhttp As Object Dim parameters As String Dim html As String range("B1").valueSales Receipts Duplicating when I run reports why and how do we rectify this and any other report if this happens
find attached extract of my reportCan I execute two 'functions' when completing a mail merge from CRM?
Hi, I have set up a mail merge from CRM Deals to a template. I want a copy of this to be saved in Workdrive, and then a copy also saved back into the deal record from which the merge occurred. I can do both independent of each other, and managed to getNo Functional Autosave or Manual Save Button
Application : Zoho Notebook So I wanted to try Zoho Notebook(On Ubuntu) as an application, I installed the application and went solving my LeetCode problems visually(Drawing mode), at one point the app just stopped saving anything... Every time I triedEnterprise subscription support
My organization sells subscription services to enterprise customers, which is a different model from the consumer subscription model that Zoho Billing has been designed to support and I beleve this capability should be added. An enterprise subscriptionIssue with Creator's IF logic
Hi, I found the following code produces unexpected results: if(-1.0 < 0.0000000) { info "True"; } else { info "False"; } if(-1.0 < 0.000000) { info "True"; } else { info "False"; } The output returned is: False True However, theNeed option to send Package PDF in shipment email (Shipment PDF is missing Lot info)
Is there any way to automatically attach the Package PDF instead of (or alongside) the Shipment PDF in the notification emails? We really need this feature because the default Shipment PDF creates a blind spot for our customers. It does not display Batch/Lotzoho creator view is not present in the workspace and blank reports
Hi Support, Users who have "write" permissions keep getting this error for all of our embedded reports all of a sudden. See screen shot below: Meanwhile, my developer permissions account sees a blank screen in view and edit mode as shown in the screenshotsCustomize portal email template
Can i fetch only first name of the user in portal email template instead of the below code Hi ${User.FULL_NAME}Can't we let users decide which options they'd like to add at embed widget?
It seems embed widget DOES NOT offer a feature, where users can choose options upon subscribing plans. What Zoho has instead, is that admins have to manually create plan with options. How come no one in Zoho dev team never raised issue about usabilityReupload and rename from one field to another field (file upload)
Hi Everyone, Sorry, i have question to use invoke url for rename and reupload attachments file to another field. Tested on development mode. Zoho C6. Refer to https://www.zoho.com/creator/help/api/v2/upload-file.html look my error notification. Does anyonePrinting Multi-Page Reports (PDF Export)
Hi, I am moving a report from Google's Looker Studio to Zoho Analytics and trying to reproduce the Looker page by page dashboard editing experience. With Google, what you see is what you get when you print to PDF. But I can't seem to create the same experienceResume Harvester: New Enhancements for Faster Sourcing
We’re excited to share a set of enhancements to Resume Harvester that make sourcing faster and more flexible. These updates help you cut down on repetitive steps, manage auto searches more efficiently, and review candidate profiles with ease. Why we builtI NEED TO NUMBER TO TEXT NO HERE
=NUMBERTEXT NEEEDError: View is not present in the workspace
When saving a dashboard, user receives a popup with the following error. "View is not present in the workspace" What does this mean or refer to? There is no further insight given.Dear Zoho CEO: Business Growth is about how you prioritise!
All of us in business know that when you get your priorities right, your business grows. Zoho CRM and Zoho Books are excellent products, but sadly, Zoho Inventory continues to lag behind. Just this morning, I received yet another one-sided email aboutIs there any way to send an Excel received by email to Dataprep?
Every day I receive an email alert with an Excel file that I want to process through a Dataprep pipeline. To do this, I need to: -Save the file to disk -Open the pipeline -Run the pipeline -Update the source -Several clicks to select and open the savedBin Locations
Dear all, I am wondering if someone has the ability to develop the bin locations option for zoho inventory (integrated with zoho books) Regards, RyanCreate and populate a record in an instant: Introducing zero-shot field prompting to Zia's ICR
A couple of months ago, we upgraded our in-house AI image detection and validation tool, Zia Vision, with intelligent character recognition (ICR). By training Zia with sample images, you could create and enrich CRM records with data extracted from standardHow to Prevent Users From Skipping LMS Videos in Zoho People
How to Prevent Users From Skipping LMS Videos in Zoho People Hello Zoho Developers, In this blog, we will quickly look at how you can stop users from skipping or fast-forwarding videos in Zoho People LMS. Zoho People provides a feature called DisableSent mail sort by date disappeared
Hello, We used to be able to sort the emails by date in the sent folder, but this feature has recently disappeared. Can we bring it back?[Integration Edition] Deluge Learning Series – Custom API with Deluge | November 2025
We’re excited to conclude this four-month Integration Edition of the Deluge Learning Series: Session 1 – Integrating Zoho Apps with Deluge Using Built-In Integration Tasks Session 2 – Integrating Zoho Apps with Deluge Using invokeURL and invokeAPI SessionAutomate Backups
This is a feature request. Consider adding an auto backup feature. Where when you turn it on, it will auto backup on the 15-day schedule. For additional consideration, allow for the export of module data via API calls. Thank you for your consideration.Tips for Organizing Workflows and Improving Team Coordination in Zoho
Hi everyone, I’m looking for some general advice on how different teams are organizing their daily work within Zoho’s apps. Our team recently expanded, and we’re trying to streamline how tasks, discussions, and documents are shared so everything staysPrevent user from viewing all records?
I have a report that is meant to be used by vendors to view only the records that are assigned to them. All the vendor information is stored in a separate application, so I need to call a function to get the current user's ID (not the zoho user ID). The report settings criteria doesn't support using function calls, so instead I'm embedding the report in an html page like this: if (thisapp.Global.CurrentUserIs("Vendor")) { personID = common.getLoggedInPersonID(); query = "Assigned_Vendor.ID="Series Label in the Legend
My legend reads 'Series 1' and 'Series 2'. From everything I read online, Zoho is supposed to change the data names if it's formatted correctly. I have the proper labels on the top of the columns and the right range selected. I assume it's something inZoho Site pages not displaying in iframes
I simply want to show a Zoho Site page inside an iframe on another non Zoho website. When testing this across many browsers, the iframe content simply does not appear. IE reports that the host does not allow their content to be displayed in iframes. Very disappointing. Is there a way around this please? Here is the URL of the page I would like to appear in an iframe. http://ips-properties-to-rent.zohosites.comZoho Inventory as connector in Zoho Creator
Hello, It doesn't appear that Zoho Inventory is one of the many built in connectors in Zoho Creator? I see that there are non-Zoho inventory applications that have built in connectors such as Cin7, which leads me to believe that I'm missing somethingNext Page