Visualize your data with a new set of charts: Treemap, Butterfly, Sankey, and Cluster charts in Zoho CRM
Dear customers,
When it comes to analytics, it's not just about the numbers; it's about understanding the story behind them.
With that philosophy in mind, we’re excited to introduce a line of representations to the existing array of chart types in Zoho CRM: Treemap, butterfly, sankey and cluster charts. Let's go!
Treemaps
Treemap charts are used to visually represent hierarchical datasets in a rectangular layout. It aligns its parent categories as larger tiles with their sub-categories nested within them. The size of each tile is proportional to its corresponding value, making it easy to compare different segments within the hierarchy.
This is how a treemap chart looks:

These structured data representations help you understand overall performance and contributions, as well as compare participating entities at a glance.
Unlike traditional bar charts or pie charts, treemaps can be used if your datasets are large and exhibit parent-child relationships.
Here are some examples to better understand their usage:
Comparing revenue distribution between functions
A company's revenue is distributed among its functions before it gets further disbursed to its employees. Treemap charts can be used to depict this distribution and compare it between functions. As you can see below, the hierarchy can be represented as a treemap to compare it directly with other functions:

The hierarchy at the top shows just the numbers and levels, but the treemap chart represents the numbers proportionally, allowing leaders to visualize the difference in distribution.
Interpretation: As you can easily see in the treemap, sales and marketing receive the same amount of revenue, while engineering is given significantly more than the other two.
Likewise, with treemap charts, you can:
- Compare popular lead sources with lead counts is the measure and lead source being the participating entity—a classic single-grouping configuration.
- View cost savings achieved across departments. With the departments as the grouping parameters and the cost saved as the measured amount, the chart lays out all the departments as tiles in proportion, based on money saved.
- Compare ad spends across channels, where channels are the parent grouping and ad spend is the measured unit.
Butterfly
Butterfly charts are used to compare two related datasets side-by-side, resulting in a representation that looks like a butterfly or tornado.
Now, how does it differ from bar charts?
The standard bar chart can compare two entities for a given measure. Say, you are comparing the performance of Mary and Charles. The two users' data is represented using bars, and the length will denote their performances. But, when it comes to comparing their performances over a period or their contribution across different stages, a bar chart is not sufficient.


With butterfly charts, you can:
- Compare revenue between two of your branches each month. With branches being compared for sum of sales revenue, grouped by closing date.
- Compare the performance of two reps in a given quarter. Compared between two users for average of amount of deals, grouped by closing date until today.
In addition to the user-based comparison above, butterfly charts are well-suited to visualizing other types of data comparisons, like:
- Picklist-based comparisons
- Duration-based comparisons
- Aggregate-based comparisons
Business scenario
Comparing the number of deals closed for each lead sources: Duration-based comparison
You can identify the productive lead source by comparing the number of deal closures for every lead source in your organization based on their closing week.

Analyzing effective sales methodology, inbound vs. outbound: Picklist-based comparison
Businesses use both inbound and outbound lead generation strategies, and each of these methods can reap different results based on the season and occasion. By comparing inbound versus outbound each month, you can identify which works best at what time.

Analyze the amount versus the expected revenue between accounts: Aggregate-based comparison
Expected revenue is a result of a deal's progression in the sales pipeline. Comparing the amount versus their expected revenue will not only help visualize the expected revenue of participating accounts but also indicate the accounts' stage in the sales pipeline.

Sankey
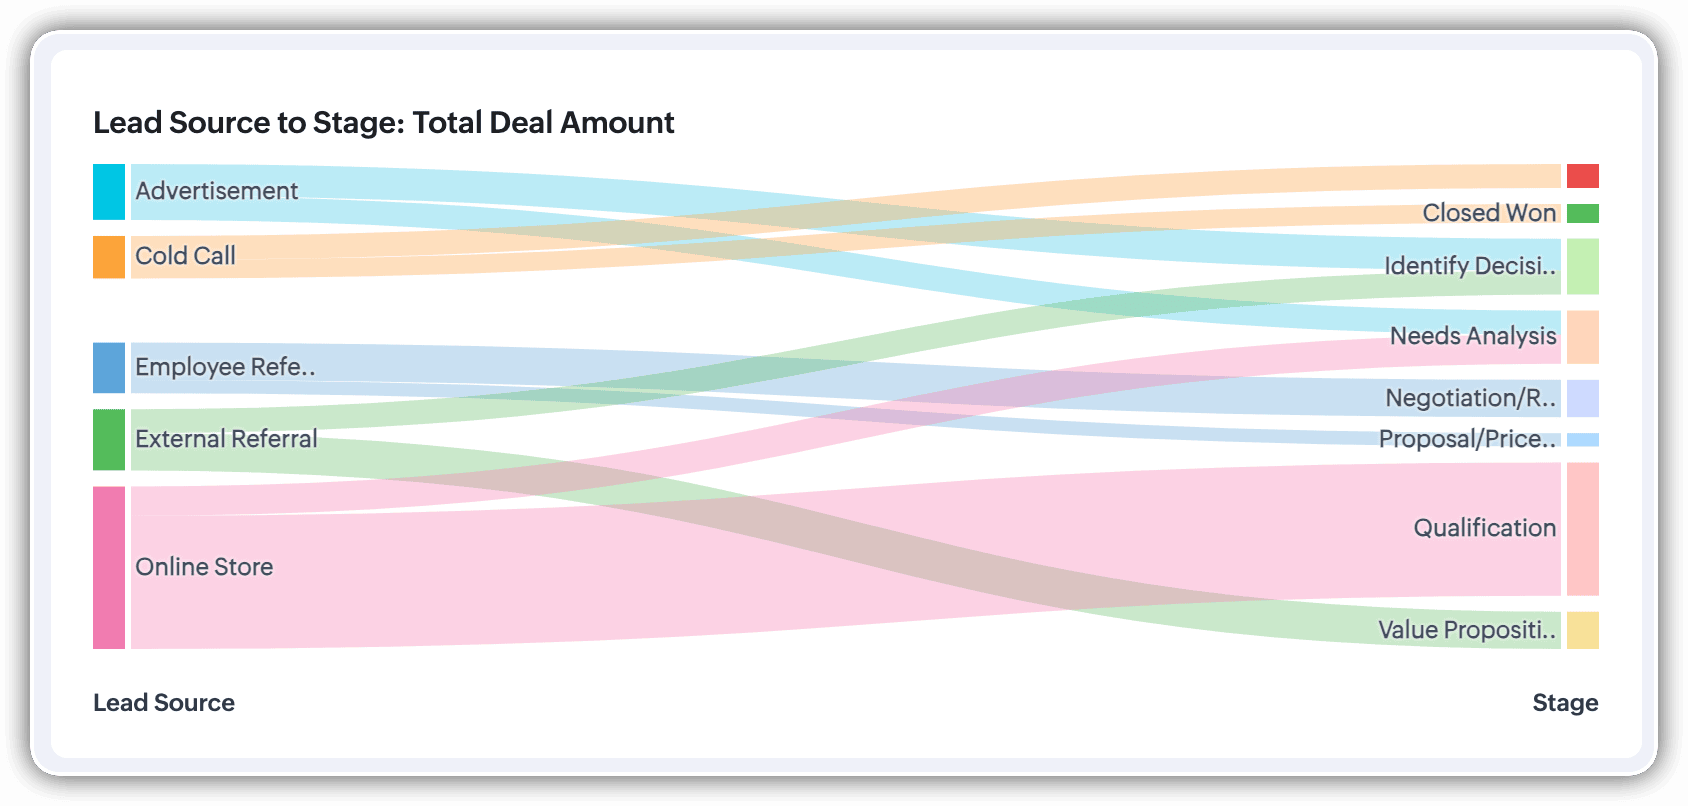
A Sankey Chart is designed to visualize the movement of data across different data groups. Unlike traditional charts—such as bar, column, pie, or donut—that mainly provide a static distribution of values, the Sankey Chart focuses on illustrating the flow between multiple segments or grouping fields. This makes it an ideal choice when you want to track how values (like lead counts, revenue, or deal statuses) move from one category to the next.

Key features
- Flow visualization: With the Sankey Chart, you can observe the movement of data between different groups.
- Multiple grouping fields: This chart works best when you have at least two grouping fields. You can go even further and add a third grouping to see an even more detailed mapping of your data flow.
- Simple configuration: The configuration for the Sankey Chart is as simple as any other chart type in Analytics.
Business scenarios:
Imagine you’re a sales manager trying to get a better handle on your team’s performance and your company’s pipeline. You want to understand not just how many deals are coming in, but also which sources are contributing the most value—and how those deals are progressing through different sales stages.
Let’s say you want to understand which lead sources are driving the most deal activity and how those deals progress through the pipeline. You can create a Sankey chart that maps the count of deals from Lead Source to Stage.

After analyzing the chart, you might notice that Online Store brings in a high volume of early-stage deals, while sources like External Referral contribute fewer deals that are more likely to reach advanced stages like Proposal or Negotiation.
This insight helps you prioritize nurturing the most profitable channels.
Sankey charts can also be helpful in other operational scenarios where understanding transitions across stages or teams is essential:
- Regional revenue distribution: Visualize how revenue flows across different regions, product categories, and their corresponding annual revenue. This helps you compare which regions contribute the most to each product line and where your high-value segments lie.
- Ticket handling flow: Visualize the flow of support tickets from their origin channel to internal departments and finally to resolution statuses. This can reveal workload imbalances or common points of delay in your support process.
Cluster
A cluster chart is similar to stacked column charts, but instead of stacking horizontally, the data is represented as vertical bars. As you create a column chart with multiple groupings, you can change the type of column chart to a cluster chart to achieve this representation.

In the above image, you can see the stacked column chart compares the number of lead conversions based on popular sources between countries. The stacks appearing on top of existing stacks ask you to calibrate the record count (y-axis) based on the previous stacks, which can lead to inaccurate interpretations. In this case, a cluster representation will paint a clearer picture of the analyses.
Other minor enhancements:
In addition to the three charts we mentioned above, we've also made the following minor changes:
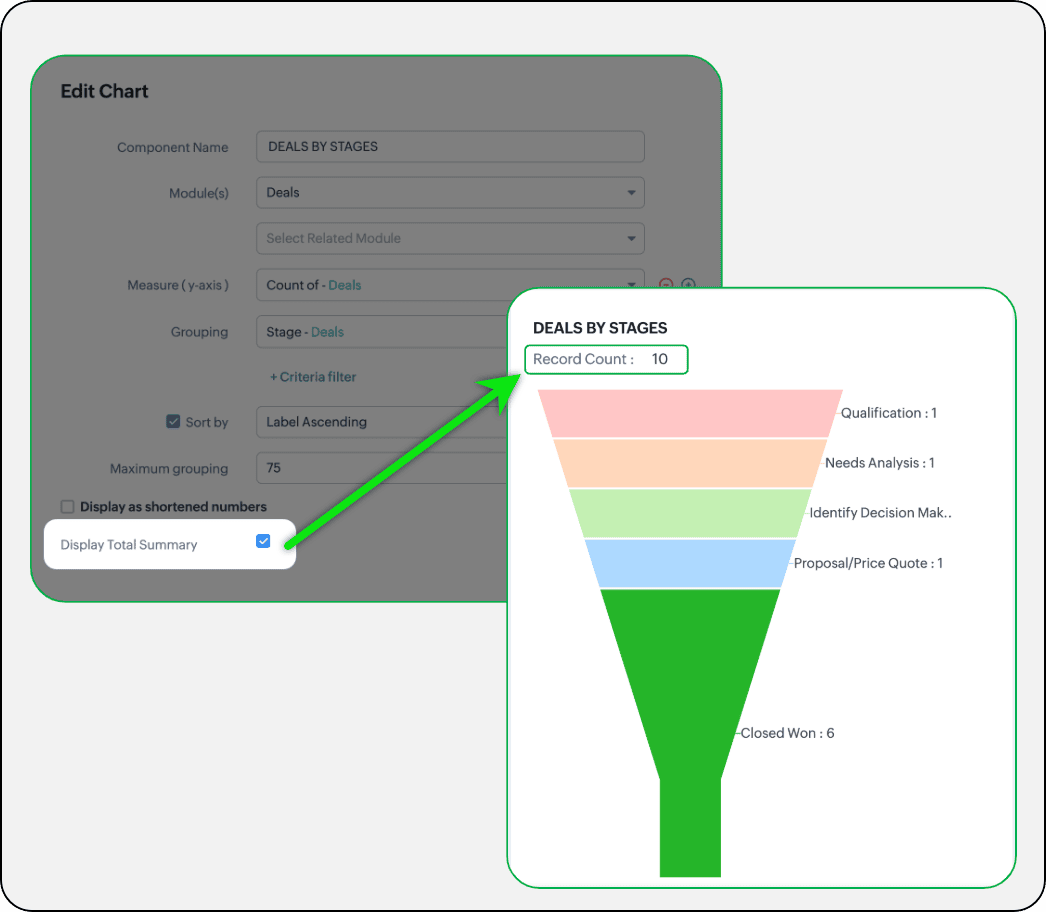
- Display total summary: Thus far, for all charts, each participating measure included labels. Now, to better understand overall contributions, a check box to display the total summary is provided under More options on the Chart Configuration page. Based on the configuration, the total revenue or the rolled-up quantities will be prominently displayed.
- Merge Y-axis: For charts that use two y-axis measurements, the intention is to view the progression of one entity against these two measures. Despite the scale, if the y-axis on the left is disproportionate to the values of the y-axis on the right, the plotted graph will result in a graphically and logically incorrect representation.
As you can see in the image below, the plot area of the sum of amount bar and the sum of expected revenue aligns close together, while, the difference between $700,000 and $40,500 is drastic, creating inaccurate interpretations.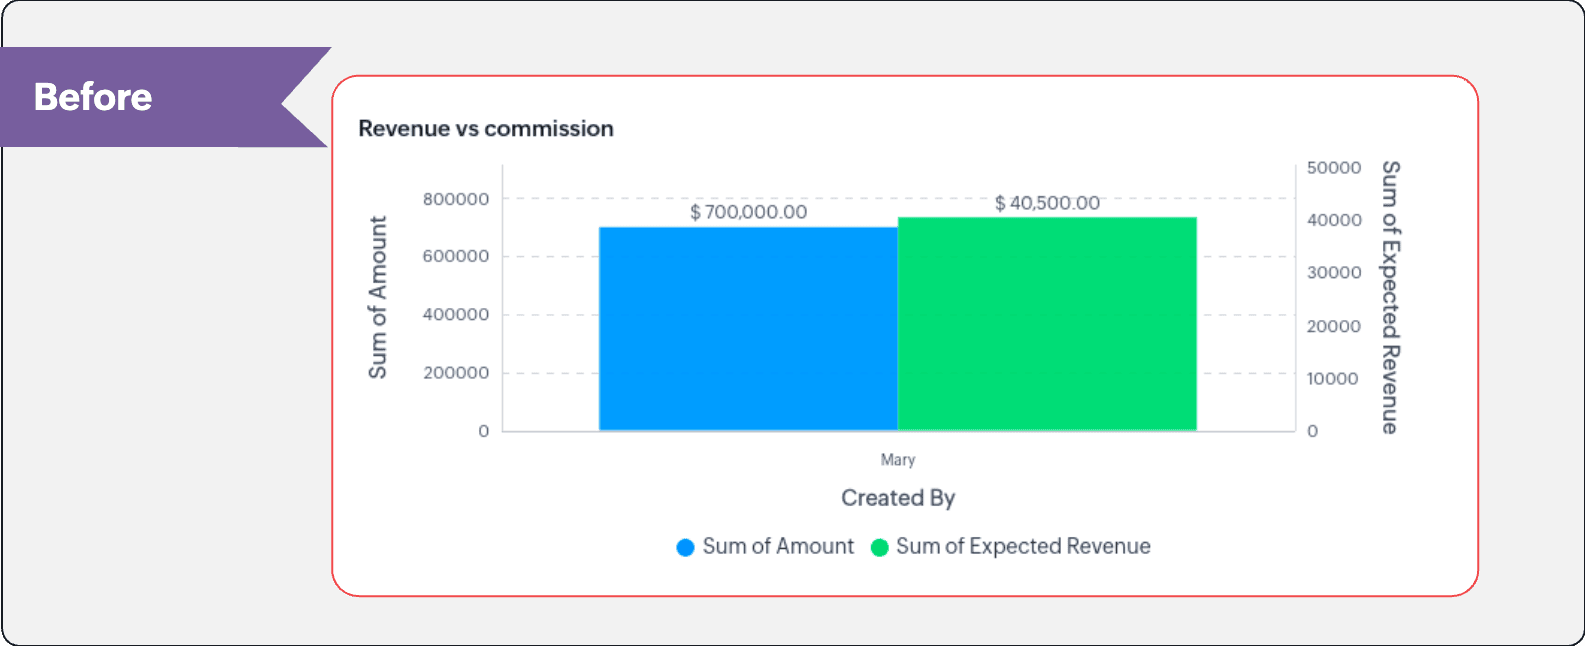
In this enhancement, we're allowing neighboring values of measures to merge so that the interpretation can be more visually accurate.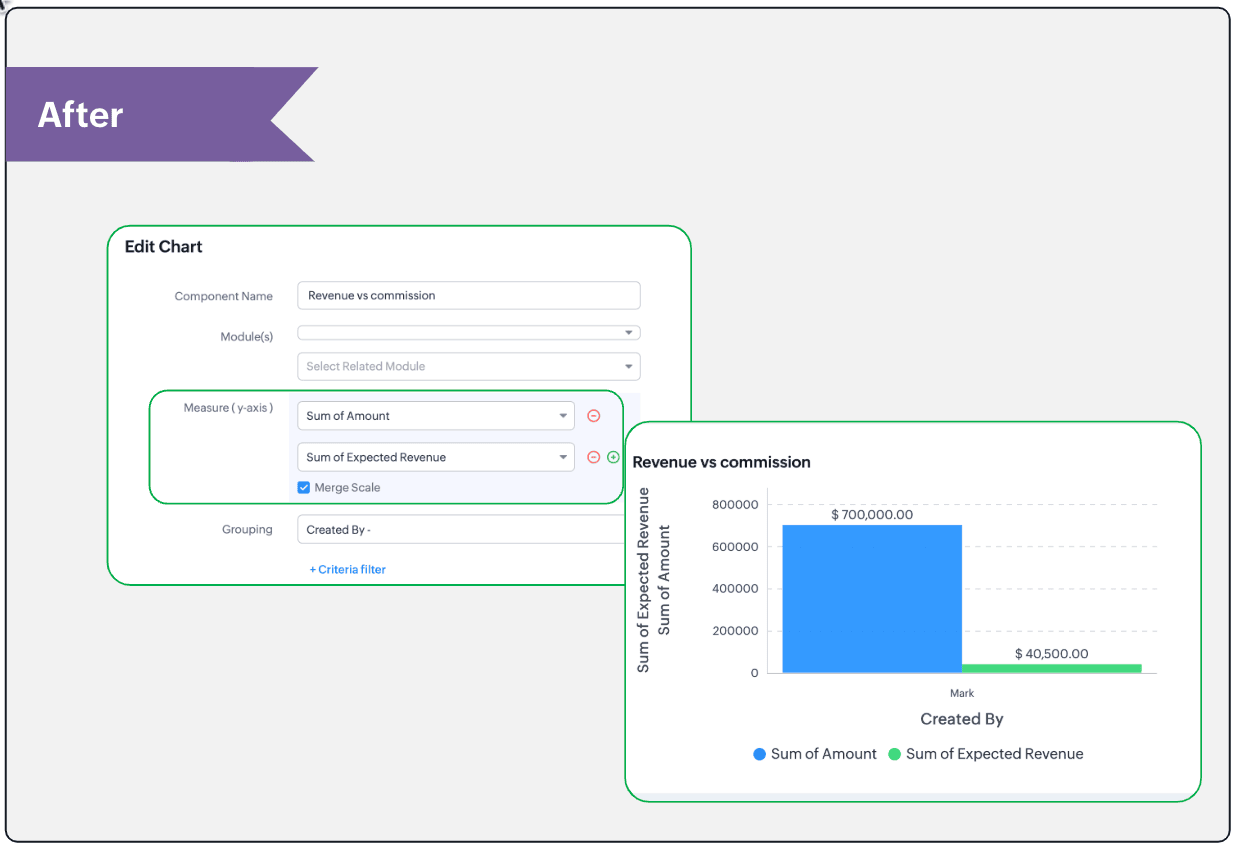
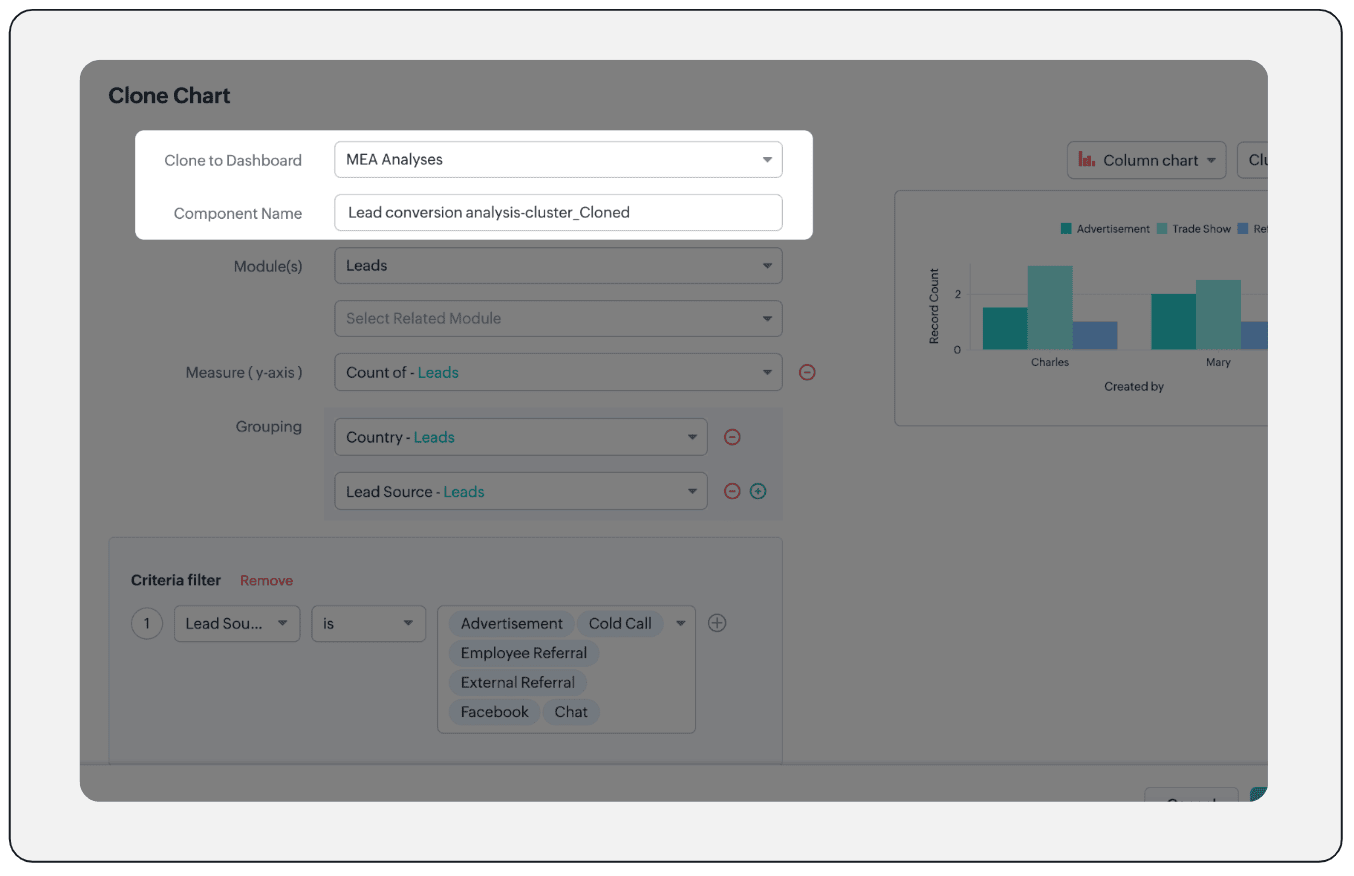
- Clone components to a different dashboard: Dashboards in Analytics serve in unique ways for various audiences—there can be separate dashboards for the sales team, marketing team, engineering team, and so on, and the chances of using the same measure for reference is common. Thus, when you clone a chart, you can now determine the target dashboard in which the cloned chart can be placed.
Resource: Help document
Thanks and have a good one!
Kind regards,
Saranya Balasubramanian
Saranya Balasubramanian
Topic Participants
Saranya Balasubramanian
Sticky Posts
Good news! Calendar in Zoho CRM gets a face lift
Dear Customers, We are delighted to unveil the revamped calendar UI in Zoho CRM. With a complete visual overhaul aligned with CRM for Everyone, the calendar now offers a more intuitive and flexible scheduling experience. What’s new? Distinguish activitiesCreate and populate a record in an instant: Introducing zero-shot field prompting to Zia's ICR
A couple of months ago, we upgraded our in-house AI image detection and validation tool, Zia Vision, with intelligent character recognition (ICR). By training Zia with sample images, you could create and enrich CRM records with data extracted from standardIn-person ZUG Meetups for Real Estate Professionals - US Q1 2026
The Real Estate Zoho User Group is going on a multi-city, in-person meetup tour across the US, and we’d love to see you there! These meetups are a great opportunity to: Connect with fellow real estate professionals using Zoho Share challenges and discoverNimble enhancements to WhatsApp for Business integration in Zoho CRM: Enjoy context and clarity in business messaging
Dear Customers, We hope you're well! WhatsApp for business is a renowned business messaging platform that takes your business closer to your customers; it gives your business the power of personalized outreach. Using the WhatsApp for Business integrationTwo new enhancements in Zoho CRM: Introducing new criteria for user fields and displaying group information in users page
Announcement moderated on 14th June, 2023. Dear All, These enhancements are opened for all users in all DCs. ------------------------------------------------------------------------------------- Dear All, Hope you're well! We are here with two useful
Recent Topics
Send Zoho Forms Link using Zoho CRM Email Templates
I have set up Zoho Forms and CRM integration to pre-populate data from Zoho CRM to Zoho Forms. The setup is working fine. I have also created an email template in the Zoho CRM deals module to send Zoho forms links. So when I send an email using that templateMy go to On Load Client Script - Fast, efficient, and works for ALL profiles; Hides everything except initial fields
This is my on Load client script that I use for Create pages. I use a modified version for Edit and Display pages which you can create yourself using the same basic structure that I will give you below. First up, the script. Below that will be an explanationCRM x WorkDrive: File storage for new CRM signups is now powered by WorkDrive
Availability Editions: All DCs: All Release plan: Released for new signups in all DCs. It will be enabled for existing users in a phased manner in the upcoming months. Help documentation: Documents in Zoho CRM Manage folders in Documents tab Manage filesZoho Books Finance Modules Not Accessible in Zoho CRM Mobile App
We have integrated Zoho CRM with Zoho Books using the Zoho Finance Suite integration. In the CRM web version, we can see the Finance modules (Estimates/Quotes, Invoices, Sales Orders, Items, Payments) and are able to create invoices and quotes directlyCustom Search using HTM+CSS Snippet
Suppose I wanted to create my own list view using HTML and CSS snippets inside a Page with a custom search input at the top of the list (not the Search snippet). Without Javascript, is there a way to retrieve a user's entry from that search input andCliq iOS can't see shared screen
Hello, I had this morning a video call with a colleague. She is using Cliq Desktop MacOS and wanted to share her screen with me. I'm on iPad. I noticed, while she shared her screen, I could only see her video, but not the shared screen... Does Cliq iOS is able to display shared screen, or is it somewhere else to be found ? RegardsMass Update of Lookup Fields not possible
Hello List I've created a custom field for Leads and Contacts 'Current Campaign'. This is very Handy as I can filter leads and then related them to a campaign. Everything ready, but then I realized that mass update doesn't work for lookup fields... aZoho CRM Kiosk Upload Files
Hello all, We are trying out Kiosks at the moment to see where it can fit best in our business. We are still a bit off in the application but lets say we will sort this out. My question is the following - when I create a Kiosk I can add "File Upload"Double opt-in notifications and customizable confirmation messages for your webforms
Dear CRM Community, We are excited to announce a major upgrade to our Webforms feature. You can now customize the confirmation message shown to your users who double opt-in from your webform and also customize your confirmation emails when they submitHas Anyone successfully integrated Zoho and Sage Intact?
Hey all, We’re evaluating Zoho One + Sage Intacct and I’m trying to connect with anyone who has actually implemented the two together.Specifically, I’d love to know: -- Which functions you kept in Zoho vs. Intacct (e.g., Product Catalog, AR/AP, invoicing,Introducing Image Upload Field
Hello everyone, In this post we will discuss about the benefits and usage of the Image upload field. The field is available for standard and custom modules. Usage: This field can be used to upload a gallery of images to a record and share the record with peers or customers. The record can be made accessible to users outside of Zoho CRM via Portals, where they can upload the necessary images. Preview, editing, and deleting images: The uploaded images can be directly edited and saved from the recordTrigger a Workflow Function if an Attachment (Related List) has been added
Hello, I have a Case Module with a related list which is Attachment. I want to trigger a workflow if I added an attachment. I've seen some topics about this in zoho community that was posted few months ago and based on the answers, there is no triggerFree webinar alert on November 19 - Email driven strategies - Master personality based styles
Hello Zoho Community! Want to make email management easier, smarter, and more you? We’ve got just the session for you! Join our interactive, game-based webinar to discover how Zoho Mail adapts to your personality and work style. Learn practical hacks,Associate emails from both primary and secondary contacts to deal
We need to associate emails from multiple contacts to a deal. Please advise how this can be achieved. At present, only emails from primary contacts can be associated. ThanksSubform edits don't appear in parent record timeline?
Is it possible to have subform edits (like add row/delete row) appear in the Timeline for parent records? A user can edit a record, only edit the subform, and it doesn't appear in the timeline. Is there a workaround or way that we can show when a userAI generated meeting notes associated to Account or Deal
As our organization works to improve efficiency we are looking for a solution to leverage AI to generate meeting notes and then add those notes to a CRM record such as an Account or Deal. I see Zoho has a Notebook AI offering that talks about the abilitydue date on cheue
how to handle cheque in zoho books for customers and vendors including due dateZoho CRM Portal Field Level Permission Issue
Hi Support Team, I am using the Zoho CRM Portal and configuring field-level editing permissions. However, we are unable to restrict portal users from editing certain fields. We have created a portal and provided View and Edit (Shared Only) access forWebDAV / FTP / SFTP protocols for syncing
I believe the Zoho for Desktop app is built using a proprietary protocol. For the growing number of people using services such as odrive to sync multiple accounts from various providers (Google, Dropbox, Box, OneDrive, etc.) it would be really helpful if you implemented standard protocols such as WebDAV / FTP / SFTP so that alternative inc clients can be used.'Statement of Accounts does not exist' error received, when creating PO using api in Zoho Inventory
Here is request json -- JSONString = { "date": "2019-09-24", "purchaseorder_number": "PO-6-1", "delivery_date": null, "delivery_org_address_id": 36221200000056XXX, "vendor_id": 362212000000564XXX, "attention": "Testing", "line_items": [{ "unit": "Pieces", "account_id": 36221200000003XXX, "quantity": 1, "item_id": 362212000000049XXX, "tax_type": "", "tax_name": "", "name": "One HD", "purchase_rate": 85, "tax_percentage": 0, "item_total": 85.00, "tax_id": "", "warehouse_id": 362212000000564XXX }] }Zoho Projects API 100 requests/2 min. Limit
Hi Requesting clarification on the API documentation. "You can invoke or call an API for 100 times in a span of two minutes. If you invoke more than 100 times, the particular API request will be locked for the next 30 minutes. " Does this limit applyUnveiling Zoho Sites 2.0 - A new dimension in website building
Dear Zoho Sites Users, We are thrilled to announce the launch of Zoho Sites 2.0 today! This refresh represents a significant step forward in the capabilities of Zoho Sites and is crucial for creating a lasting and positive impact on our customers' businesses.Integrate your Outlook/ Office 365 inbox with Zoho CRM via Graph API
Hello folks, In addition to the existing IMAP and POP options, you can now integrate your Outlook/Office 365 inbox with Zoho CRM via Graph API. Why did we add this option? Microsoft Graph API offers a single endpoint to access data from across Microsoft’sZoho Projects - Attachments added to Task and Bug emails are not saved
Hi Projects team, I have been experimenting with emails into projects to create tasks and bugs. I have noticed that attachments added to the emails are not saved to the task or bug. Is this normal behaviour? Thanks, AshleyZoho Inventory's latest shipping integration updates at a glance.
Hello Users, We would like to share some important news about our latest improvements in the Shipping integration capabilities of Zoho Inventory that we achieved in 2024 with some of our major integration partners in key editions across APAC, North America,Identify long running sync jobs/tables
My sync process causes strain on my production database and I'd love some tools/alerts to help me identify which tables are taking the longest. The current screen only shows 3 tables at a time and truncates the last fetch time so that it is very cumbersomeSorting a list of record acquired from the zoho.crm.searchRecords function.
This is something for which I'm trying to figure out a straightforward way to do. The searchRecords does a great job fetching me the records that I want. However, in some cases, where it returns multiple records, I want it to sort the returned list by date of creation of that record, so that when I do records.get(0), I get the most recent record. As an example, here's my sample pseudo code: records = zoho.crm.searchRecords("Clients", "Office_Number:equals:123456"); Now the "records" list above containsZoho Inventory Custom Field Update
Hello All, In this post I am describing how can we Update the Custom Field Value in Zoho Inventory. // Get Org ID orgid = organization.get("organization_id"); // Field Value resvp = ifnull(item.get("purchase_rate"),null); // Record ID iid = item.get("item_id");Deprecation of the Zoho OAuth connector
Hello everyone, At Zoho, we continuously evaluate our integrations to ensure they meet the highest standards of security, reliability, and compliance. As part of these ongoing efforts, we've made the decision to deprecate the Zoho OAuth default connectorAlphabetically
How can i arrange alphabetically - (Manage Manufacturer) Field in Item MasterSpotlight series #6: The Show app for Android TV has a new look!
Hello everyone! We are delighted to introduce our revamped and redesigned Show app for Android TV. Smart TVs are exploding in popularity. Android TV alone has over 110 million active monthly devices. Zoho Show, as part of a constant effort to improveCan i set a default value for country and state in address field in zoho creator?
Can i set a default value for country and state in address field in zoho creator?Using gift vouchers
We would like to be able to offer a limited number of gift vouchers, of varying values, to our customers, and are looking for the best way to do this. We have looked at Coupons and Gift Certificates, but neither seem to fit the bill perfectly. Coupons:Convert HTML to PDF & Send as Email Attachments in Zoho Creator (Deluge)
This approach is useful for sending welcome letters, instructions, or promotional offers after order creation. // 1. Define the variables using the submitted input customerName = input.Customer_Name1; orderID = input.ID; customerEmail = input.Email_Address; //Redirect after submission is not working after a few submission
I have setup redirect url correctly and everything works as expected. However, it seems that there's a limit to the number of submissions before the redirect stops working. After the "limit" is reached, the page redirects to a seemingly zoho hosted page,Enhancement Request for Multi-Asset Work Order Feature
Hello Latha, Thank you for your continued support. The multi-asset Work Order feature is extremely helpful. I did some testing based on our requirements, and during the process, I noticed a few areas where we need your team’s support to improve the featureMarketing Tip #8: Run limited-time offers
Exclusive offers that don't last long make shoppers purchase right away instead of waiting. Run a flash sale or limited-time discount to convert interest into sales. Try this today: Set up a "Buy X Get Y" coupon in Zoho Commerce valid for a limited timeAdd Option to Mass Dispatch by User
Hello! We are using the dispatch console to dispatch service appointments to our service ressources. Right now, the process is our dispatcher verifies each ressource's route for the day and dispatches it after validation. Sadly, there doesn't seem toFree webinar: Zoho Sign unwrapped – 2025 in review
Hey there! 2025 is coming to an end, and this year has been all about AI. Join our exclusive year-end webinar, where we'll walk you through the features that went live in 2025, provide answers to your questions, and give you a sneak peek on what to expectZoho Projects - Email notification relabelling of modules not present on default templates
Hi Projects Team, I noticed that in the default email template notification, the word "bug" was not renamed to the lable I am using in my system. As many users may used the Bugs modules for various purposes including Changes, Revisions, Issues, etc...Next Page