Visualize your data with a new set of charts: Treemap, Butterfly, Sankey, and Cluster charts in Zoho CRM
Dear customers,
When it comes to analytics, it's not just about the numbers; it's about understanding the story behind them.
With that philosophy in mind, we’re excited to introduce a line of representations to the existing array of chart types in Zoho CRM: Treemap, butterfly, sankey and cluster charts. Let's go!
Treemaps
Treemap charts are used to visually represent hierarchical datasets in a rectangular layout. It aligns its parent categories as larger tiles with their sub-categories nested within them. The size of each tile is proportional to its corresponding value, making it easy to compare different segments within the hierarchy.
This is how a treemap chart looks:

These structured data representations help you understand overall performance and contributions, as well as compare participating entities at a glance.
Unlike traditional bar charts or pie charts, treemaps can be used if your datasets are large and exhibit parent-child relationships.
Here are some examples to better understand their usage:
Comparing revenue distribution between functions
A company's revenue is distributed among its functions before it gets further disbursed to its employees. Treemap charts can be used to depict this distribution and compare it between functions. As you can see below, the hierarchy can be represented as a treemap to compare it directly with other functions:

The hierarchy at the top shows just the numbers and levels, but the treemap chart represents the numbers proportionally, allowing leaders to visualize the difference in distribution.
Interpretation: As you can easily see in the treemap, sales and marketing receive the same amount of revenue, while engineering is given significantly more than the other two.
Likewise, with treemap charts, you can:
- Compare popular lead sources with lead counts is the measure and lead source being the participating entity—a classic single-grouping configuration.
- View cost savings achieved across departments. With the departments as the grouping parameters and the cost saved as the measured amount, the chart lays out all the departments as tiles in proportion, based on money saved.
- Compare ad spends across channels, where channels are the parent grouping and ad spend is the measured unit.
Butterfly
Butterfly charts are used to compare two related datasets side-by-side, resulting in a representation that looks like a butterfly or tornado.
Now, how does it differ from bar charts?
The standard bar chart can compare two entities for a given measure. Say, you are comparing the performance of Mary and Charles. The two users' data is represented using bars, and the length will denote their performances. But, when it comes to comparing their performances over a period or their contribution across different stages, a bar chart is not sufficient.


With butterfly charts, you can:
- Compare revenue between two of your branches each month. With branches being compared for sum of sales revenue, grouped by closing date.
- Compare the performance of two reps in a given quarter. Compared between two users for average of amount of deals, grouped by closing date until today.
In addition to the user-based comparison above, butterfly charts are well-suited to visualizing other types of data comparisons, like:
- Picklist-based comparisons
- Duration-based comparisons
- Aggregate-based comparisons
Business scenario
Comparing the number of deals closed for each lead sources: Duration-based comparison
You can identify the productive lead source by comparing the number of deal closures for every lead source in your organization based on their closing week.

Analyzing effective sales methodology, inbound vs. outbound: Picklist-based comparison
Businesses use both inbound and outbound lead generation strategies, and each of these methods can reap different results based on the season and occasion. By comparing inbound versus outbound each month, you can identify which works best at what time.

Analyze the amount versus the expected revenue between accounts: Aggregate-based comparison
Expected revenue is a result of a deal's progression in the sales pipeline. Comparing the amount versus their expected revenue will not only help visualize the expected revenue of participating accounts but also indicate the accounts' stage in the sales pipeline.

Sankey
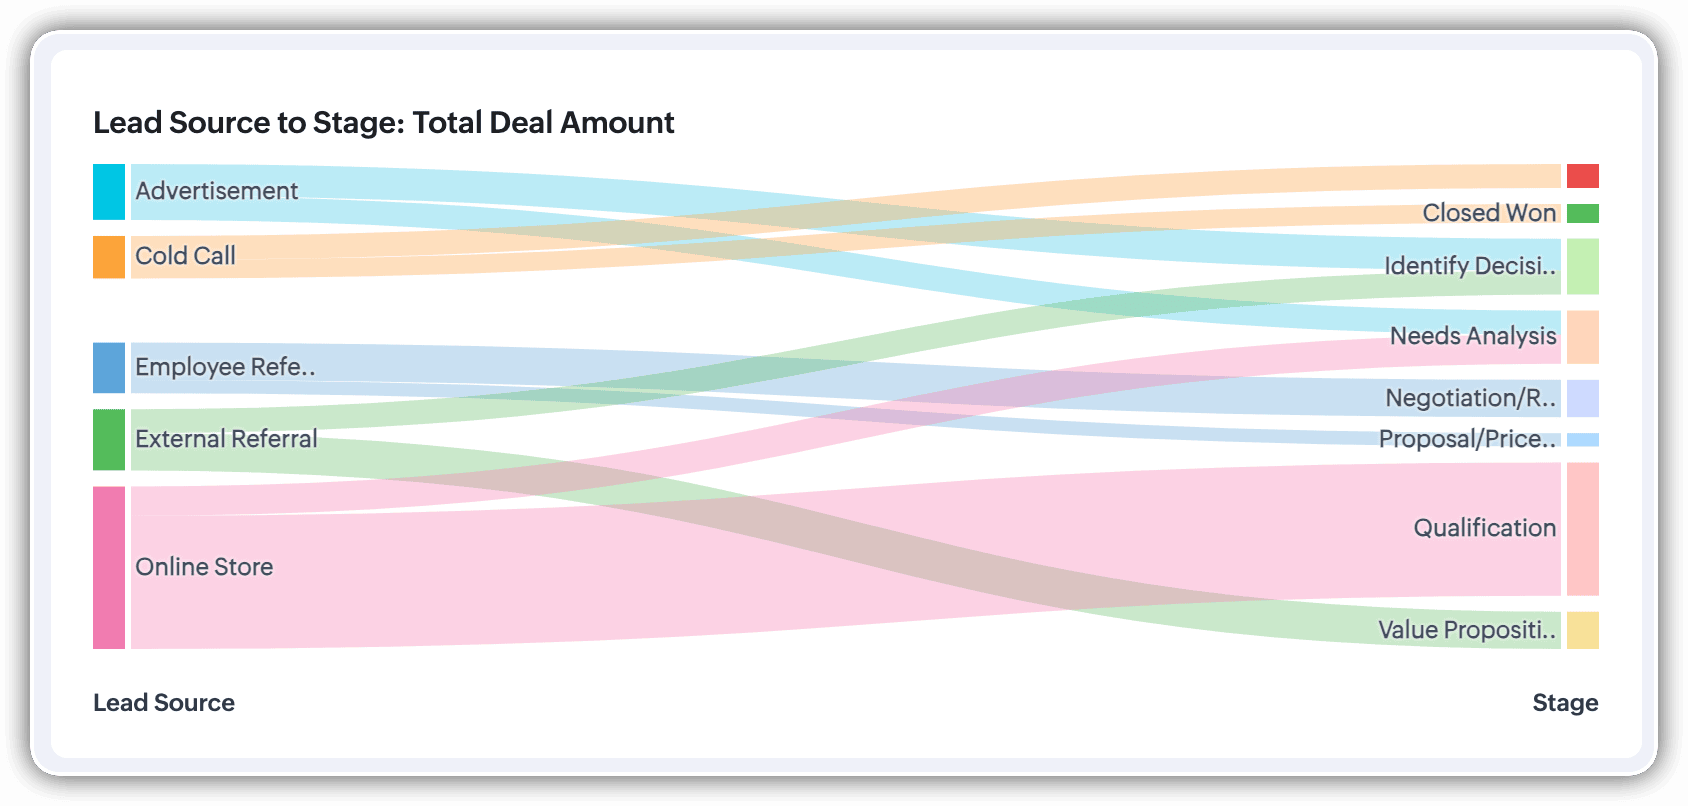
A Sankey Chart is designed to visualize the movement of data across different data groups. Unlike traditional charts—such as bar, column, pie, or donut—that mainly provide a static distribution of values, the Sankey Chart focuses on illustrating the flow between multiple segments or grouping fields. This makes it an ideal choice when you want to track how values (like lead counts, revenue, or deal statuses) move from one category to the next.

Key features
- Flow visualization: With the Sankey Chart, you can observe the movement of data between different groups.
- Multiple grouping fields: This chart works best when you have at least two grouping fields. You can go even further and add a third grouping to see an even more detailed mapping of your data flow.
- Simple configuration: The configuration for the Sankey Chart is as simple as any other chart type in Analytics.
Business scenarios:
Imagine you’re a sales manager trying to get a better handle on your team’s performance and your company’s pipeline. You want to understand not just how many deals are coming in, but also which sources are contributing the most value—and how those deals are progressing through different sales stages.
Let’s say you want to understand which lead sources are driving the most deal activity and how those deals progress through the pipeline. You can create a Sankey chart that maps the count of deals from Lead Source to Stage.

After analyzing the chart, you might notice that Online Store brings in a high volume of early-stage deals, while sources like External Referral contribute fewer deals that are more likely to reach advanced stages like Proposal or Negotiation.
This insight helps you prioritize nurturing the most profitable channels.
Sankey charts can also be helpful in other operational scenarios where understanding transitions across stages or teams is essential:
- Regional revenue distribution: Visualize how revenue flows across different regions, product categories, and their corresponding annual revenue. This helps you compare which regions contribute the most to each product line and where your high-value segments lie.
- Ticket handling flow: Visualize the flow of support tickets from their origin channel to internal departments and finally to resolution statuses. This can reveal workload imbalances or common points of delay in your support process.
Cluster
A cluster chart is similar to stacked column charts, but instead of stacking horizontally, the data is represented as vertical bars. As you create a column chart with multiple groupings, you can change the type of column chart to a cluster chart to achieve this representation.

In the above image, you can see the stacked column chart compares the number of lead conversions based on popular sources between countries. The stacks appearing on top of existing stacks ask you to calibrate the record count (y-axis) based on the previous stacks, which can lead to inaccurate interpretations. In this case, a cluster representation will paint a clearer picture of the analyses.
Other minor enhancements:
In addition to the three charts we mentioned above, we've also made the following minor changes:
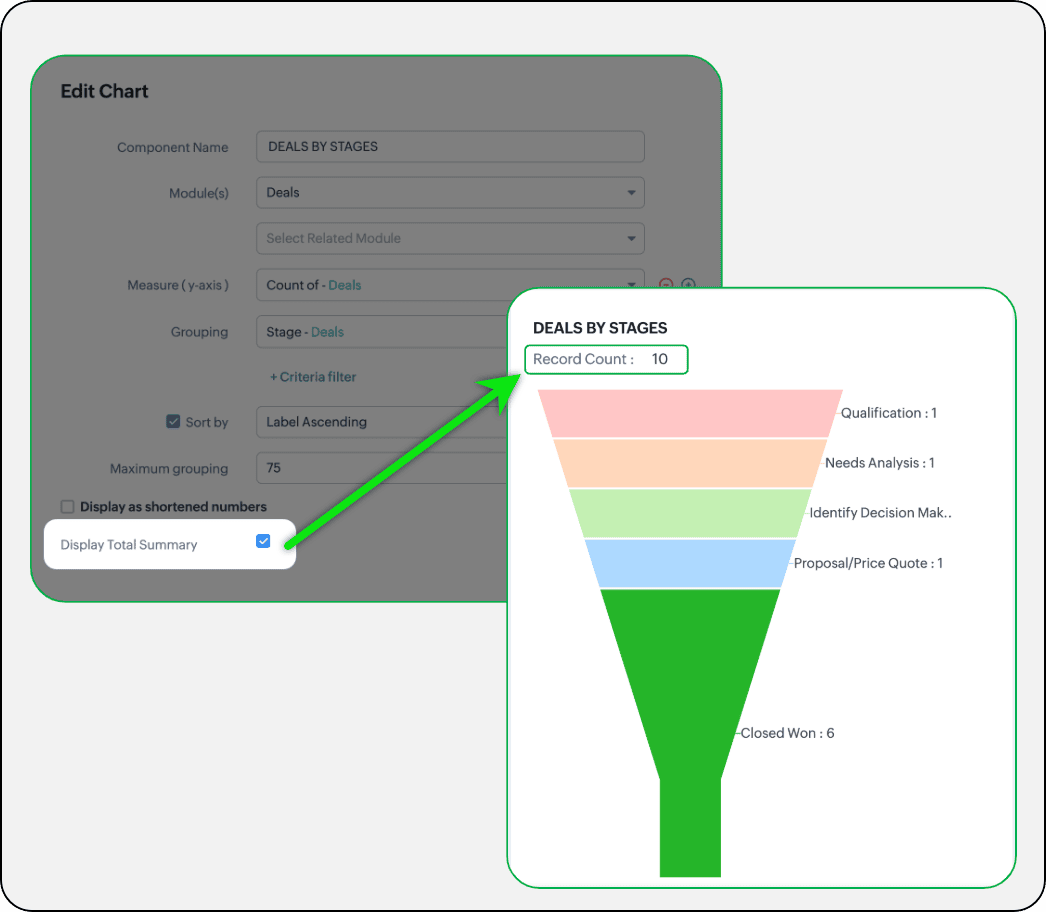
- Display total summary: Thus far, for all charts, each participating measure included labels. Now, to better understand overall contributions, a check box to display the total summary is provided under More options on the Chart Configuration page. Based on the configuration, the total revenue or the rolled-up quantities will be prominently displayed.
- Merge Y-axis: For charts that use two y-axis measurements, the intention is to view the progression of one entity against these two measures. Despite the scale, if the y-axis on the left is disproportionate to the values of the y-axis on the right, the plotted graph will result in a graphically and logically incorrect representation.
As you can see in the image below, the plot area of the sum of amount bar and the sum of expected revenue aligns close together, while, the difference between $700,000 and $40,500 is drastic, creating inaccurate interpretations.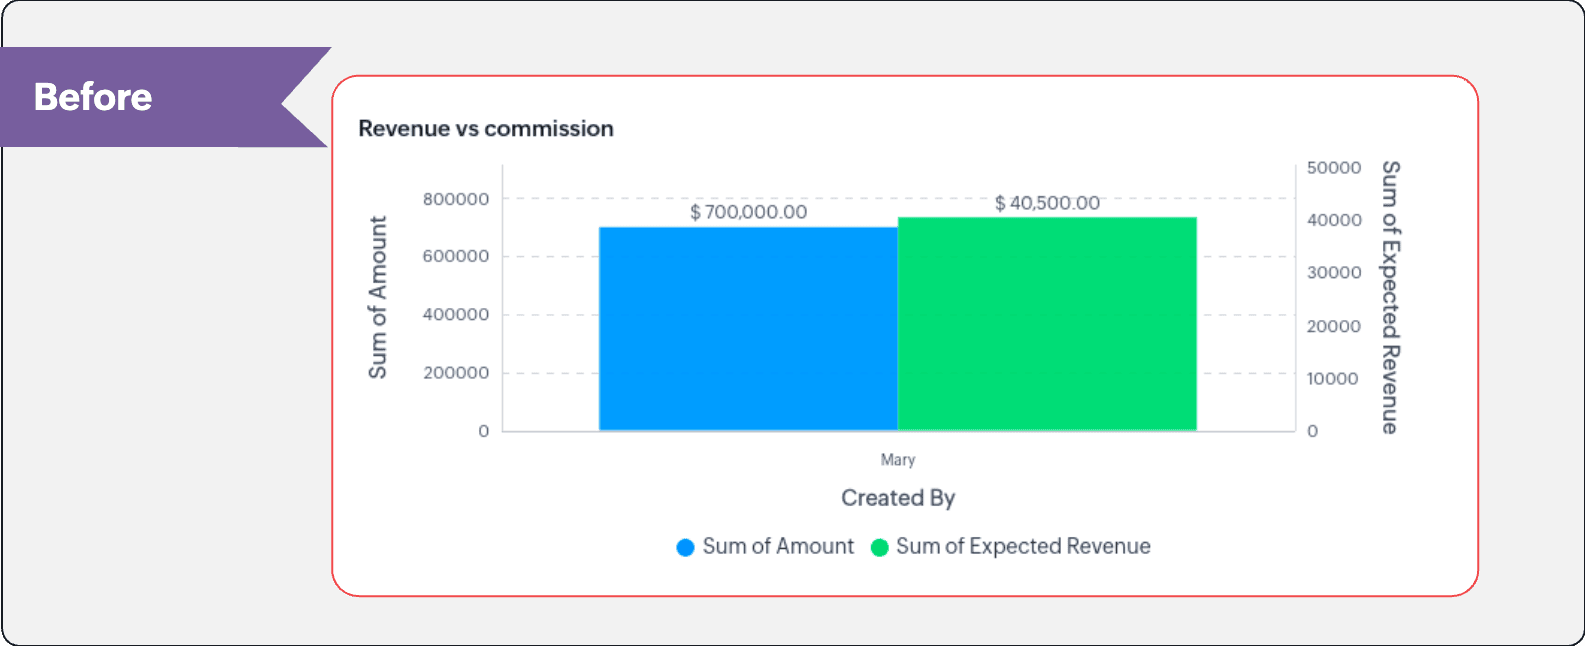
In this enhancement, we're allowing neighboring values of measures to merge so that the interpretation can be more visually accurate.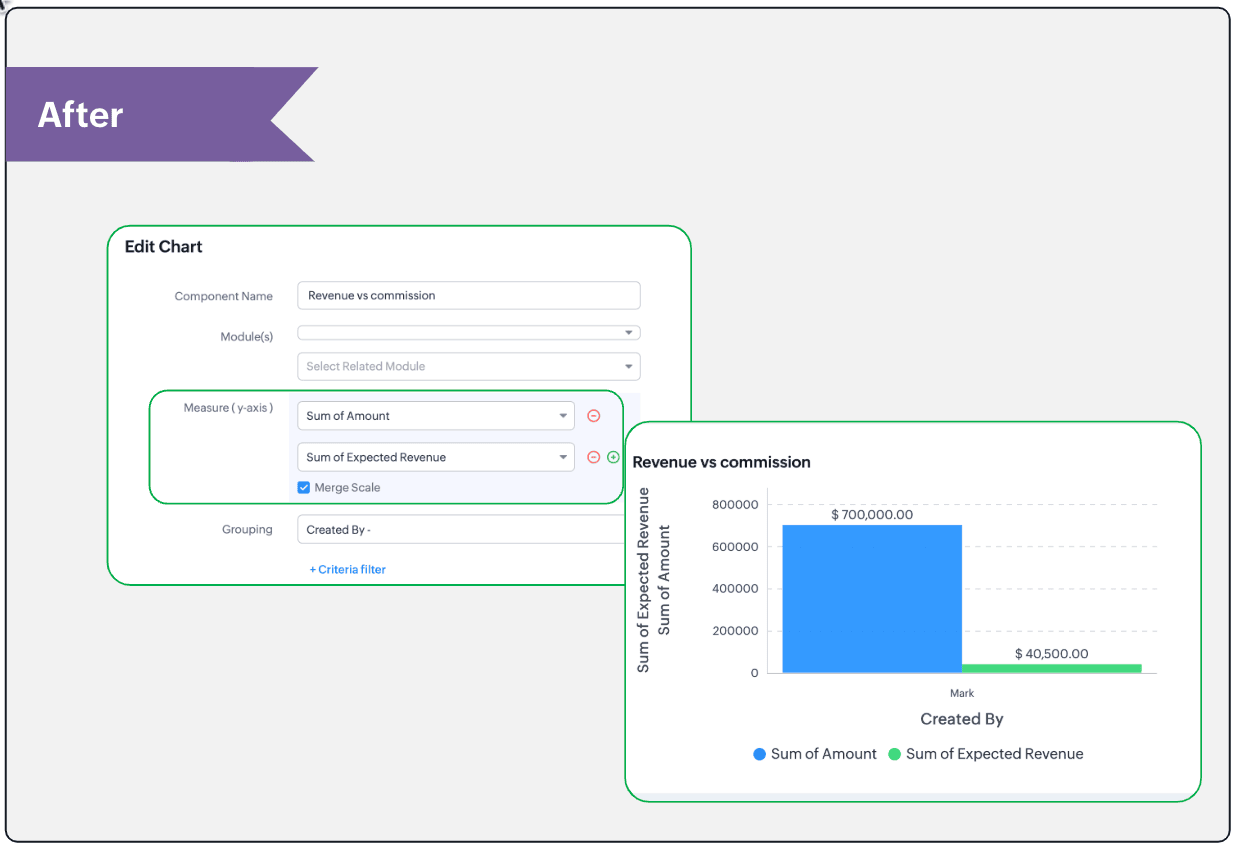
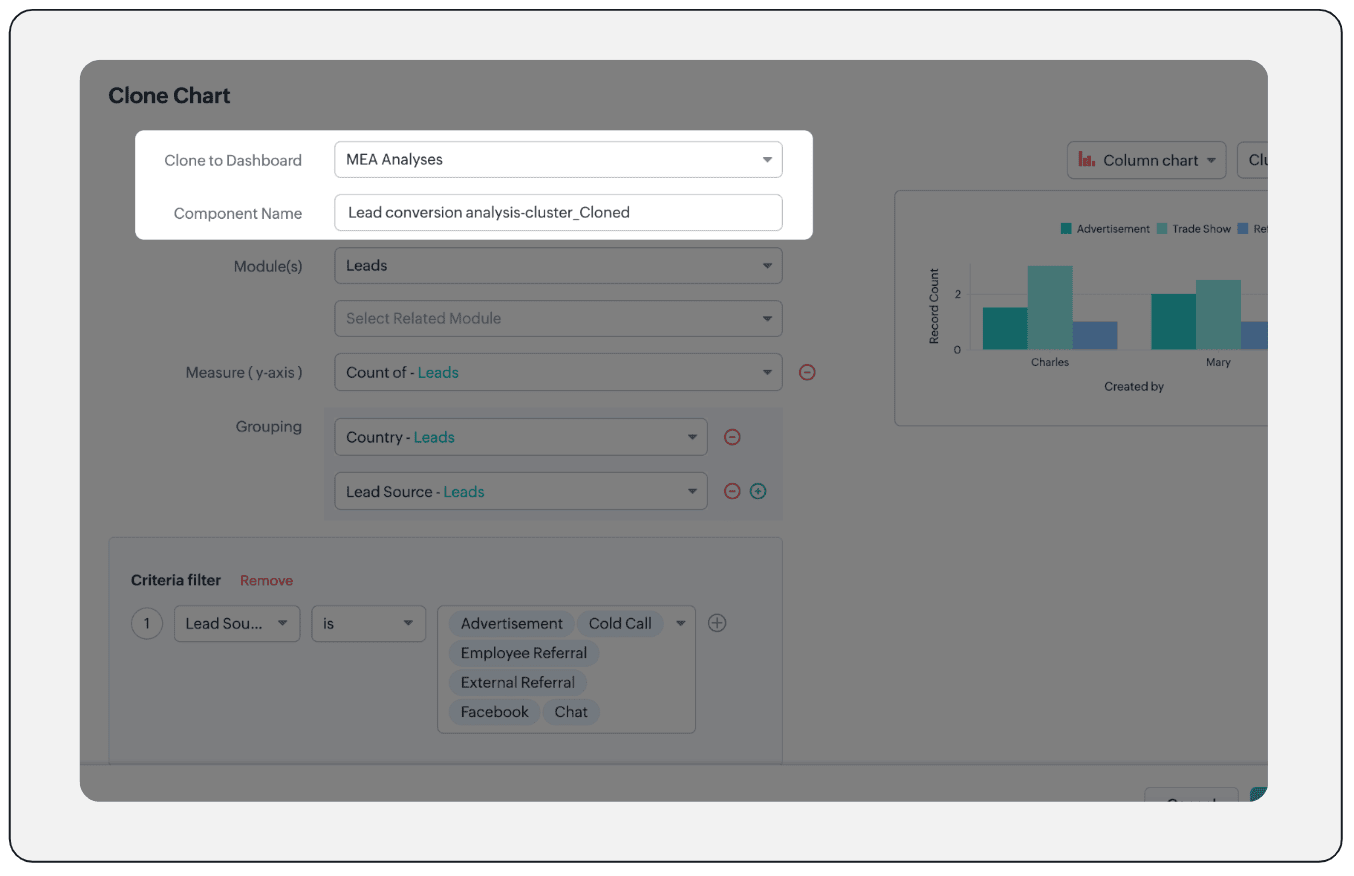
- Clone components to a different dashboard: Dashboards in Analytics serve in unique ways for various audiences—there can be separate dashboards for the sales team, marketing team, engineering team, and so on, and the chances of using the same measure for reference is common. Thus, when you clone a chart, you can now determine the target dashboard in which the cloned chart can be placed.
Resource: Help document
Thanks and have a good one!
Kind regards,
Saranya Balasubramanian
Saranya Balasubramanian
Topic Participants
Saranya Balasubramanian
Sticky Posts
Good news! Calendar in Zoho CRM gets a face lift
Dear Customers, We are delighted to unveil the revamped calendar UI in Zoho CRM. With a complete visual overhaul aligned with CRM for Everyone, the calendar now offers a more intuitive and flexible scheduling experience. What’s new? Distinguish activitiesCreate and populate a record in an instant: Introducing zero-shot field prompting to Zia's ICR
A couple of months ago, we upgraded our in-house AI image detection and validation tool, Zia Vision, with intelligent character recognition (ICR). By training Zia with sample images, you could create and enrich CRM records with data extracted from standardIn-person ZUG Meetups for Real Estate Professionals - US Q1 2026
The Real Estate Zoho User Group is going on a multi-city, in-person meetup tour across the US, and we’d love to see you there! These meetups are a great opportunity to: Connect with fellow real estate professionals using Zoho Share challenges and discoverNimble enhancements to WhatsApp for Business integration in Zoho CRM: Enjoy context and clarity in business messaging
Dear Customers, We hope you're well! WhatsApp for business is a renowned business messaging platform that takes your business closer to your customers; it gives your business the power of personalized outreach. Using the WhatsApp for Business integrationTwo new enhancements in Zoho CRM: Introducing new criteria for user fields and displaying group information in users page
Announcement moderated on 14th June, 2023. Dear All, These enhancements are opened for all users in all DCs. ------------------------------------------------------------------------------------- Dear All, Hope you're well! We are here with two useful
Recent Topics
Zoho Projects - Email notification relabelling of modules not present on default templates
Hi Projects Team, I noticed that in the default email template notification, the word "bug" was not renamed to the lable I am using in my system. As many users may used the Bugs modules for various purposes including Changes, Revisions, Issues, etc...Publish to LinkedIn via API
Hi, Is it possible to publish a job opening to LinkedIn (paid job slots) if creating a job opening via api / deluge function? Or is the user required to manually publish via the job boards process? Many Thanks AdrianIs there a way to automatically add Secondary Contacts (CCs) when creating a new ticket for specific customers?
Some of our customers want multiple contacts to receive all notifications from our support team. Is there a way to automatically add secondary contacts to a ticket when our support team opens a new ticket and associates it with an account? This wouldInclude the "Added Email ID" to the Filters of a Report
Hi, With a Report and lots of entries, a normal thing is to filter entries by the submitter, but that is not included in the Auto Filter of Reports and you can't add a custom filter to a Report without specifying the actual value. I would like to be ableLoops in Deluge
Hi, Can someone tell me how I do a simple loop in deluge? For example, if i have a variable "X" containing a number of loops to perform, i would like to perform an action X amount of times. X = 10; do while (Y < X){ // ... do something } to further explain, the equivalent in PHP of what i am trying to acheive would be: $X = 20; for($Y = 1; $Y < $X; $Y++ ){ // ... do something } ThanksI am facing a problem with an if-else condition
If I use if, else if, and else conditions in Deluge with the same variable name, sometimes the variable causes an error because the same variable name is present in every blockZoho Projects - Reply by email to @ mentions posted on the Feed.
When mentioning someone on the Feed (Status), it would be great if that mentioned person could reply to the email notification to update the Feed thread.Zoho Analytics Bulk Api Import json Data
HI, I’m trying to bulk-update rows in Zoho Analytics, and below are the request and response details. I’d like to understand the required parameters for constructing a bulk API request to import or update data in a table using Deluge. Any guidance onRecord Overseas Transactions Along with CC charges
Hi All, We receive payments via stripe in multiple currencies and stripe takes around 2.5% fees. The amount is settled in INR into our local bank. What should be the currency of the income account used for Stripe payments? Here is a sample flow that weProduct Updates in Zoho Workplace applications | October 2025
Hello Workplace Community, Let’s take a look at the new features and enhancements that went live across all Workplace applications this October. Zoho Mail Create Signature from Compose window You can now effortlessly create a Signature using the CreateSubform data to Sheets
I have been trying to setup a Zoho Flow automation to bring any Subform input to a Zoho Sheets but it seems impossible to post the subform entries to a Zoho Sheet. Is there any way to do it via Zoho Sheet API? https://www.zoho.com/sheet/help/api/v2/#CONTENT-Insert-row-with-JSON-dataE-Invoicing in Belgium with Zoho Books
Starting January 1, 2026, Belgium is introducing mandatory electronic invoices (e-invoicing) for all B2B transactions between VAT-registered businesses. This means that invoices and credits notes must be exchanged in a prescribed digital format. How E-InvoicingEdit Contact Roles in the Potentials Mod
New to ZOHO so I need some help. I work the same people on different projects concurrency. Their contact info remains the same but their role changes from project to project. In the Potential Mod you can pick contacts and assign a Role to them. I knowIs there a way to disable the Activity Reminders Pop-Up Window every time I log in?
Just wondering if there is a setting to disable the window from opening every time I open my CRM? Thanks ChrisAuto-sync field of lookup value
This feature has been requested many times in the discussion Field of Lookup Announcement and this post aims to track it separately. At the moment the value of a 'field of lookup' is a snapshot but once the parent lookup field is updated the values diverge.Hide fields only for creation
Hello, I'd like to hide some fields only during the creation of a contact in Zoho CRM. In fact I have some fields that are automatically calculated thanks to an automation, so when my users create a contact I don't want them to fill those fields. I knowRich-text fields in Zoho CRM
Hello everyone, We're thrilled to announce an important enhancement that will significantly enhance the readability and formatting capabilities of your information: rich text options for multi-line fields. With this update, you can now enjoy a more versatileFont Size 11 - Zoho CRM Email Templates
Our company communicates with our vendors exclusively using Calibri Font Size 11, as this is the standard formatting for professional emails. Since the CRM only allows for the selection of font sizes 10 & 12, we have been unable to utilize the CRM emailError 400 Booking
Added a custom domain to Booking. Am Getting a SSL Error that has some other domain on the SSL and giving a 400 error. Followed instructions and it stated it verified our domain.. However it is not working. Please Help!Error AS101 when adding new email alias
Hi, I am trying to add apple@(mydomain).com The error AS101 is shown while I try to add the alias.How do I change a form's name? Why isn't this more intuitive?
Can someone please let me know how to change a form's name?Link Purchase Order to Deal
Zoho Books directly syncs with contacts, vendors and products in Zoho CRM including field mapping. Is there any way to associate vendor purchase orders with deals, so that we can calculate our profit margin for each deal with connected sales invoicesRecruit paid support?
Hi all, Could anyone who has paid support package advise if it provides value for money with regards to support response times? Exploring the idea as unfortunately when we have faced issues with Recruit it has been a 7+ day timescale from reporting toZoho Projects - Unread Comment Icon
Hi Projects Team, It would be great if there was a notification I con on the comments icon so it's easy to see which tasks have new comments. Something like a red circle with a number of unread comments would be great. Thanks for considering my feedE-Invoicing in Belgium with Zoho Billing
Starting January 1, 2026, Belgium is introducing mandatory electronic invoices (e-invoicing) for all B2B transactions between VAT-registered businesses. Invoices and credits notes must be exchanged in a prescribed digital format. How E-Invoicing worksZoho Projects - Email Notifications for Feed Updates
Hi Projects Team, I'm working with a client who wants a simple way to communicate with their customers on projects. Getting the customer to add comments to Tasks or Bug records is not ideal, as we need a way which is easy with minimal training, and hasZoho Analytics Export API
Hi Team, I’m working on some integration tasks and wanted to confirm if it’s possible to retrieve a Zoho Analytics table as JSON data using a Deluge script. I’ve already stored my custom data from multiple sources and combined it into a single source.Loading Project Balances in ZOHO Books for each project
Hello, What is the best method for loading project balances actual and budget into ZOHO books to provide tracking to our project managers. We have projects and federal awards (also treated as projects) which span multiple years. We are converting fromWeekly Tips : Make collaboration effortless with Whiteboard in Zoho Mail
Working with your team often means switching between emails, notes, and other applications just to explain an idea. Maybe you are trying to sketch a layout, plan a workflow, or quickly brainstorm ideas—with text alone, things can get confusing. So howZoho Projects - Update Feed via API
Hi Projects Team, Please consider adding an API to allow update and retrieval of messages to the Feed. Thank youZoho Sites "pages" management page
I have 80 plus pages on zoho sites. When I go to the "pages" link to view and edit pages, They are not in any kind of order, so I spend lots of time searching for pages when I need to edit or create new. How can I change the view order of all my pagesIntroducing the all-new email parser!
Greetings, We are pleased to introduce to you, a brand-new, upgraded version of the Zoho CRM Email Parser, which is packed with fresh features and has been completely redesigned to meet latest customers needs and their business requirements. On that note,Zoho Projects - Refine Access to Collaboration Menu
Hi Projects Team, I noticed that Calendar, Chat and Meeting menu options in the Collaboration section are visible to client users, even when they don't have access to the features. This could be confusing and frustrating, because if it's there you expectZoho Projects - Add Feed to Project Tabs
Hi Projects Team, I'm working on a lightweight communications requirement for one of my customers in relation to communicating with their client users via Zoho Projects. I noticed that the Feed is only available in the Collaboration section, but you canKaizen #217 - Actions APIs : Tasks
Welcome to another week of Kaizen! In last week's post we discussed Email Notifications APIs which act as the link between your Workflow automations and you. We have discussed how Zylker Cloud Services uses Email Notifications API in their custom dashboard.Connecting zoho creator to zoho writer to send prefilled documents
i will paste the worflow below // Get user's submitted data from the form userSalary = input.Current_Salary; userCIBIL = input.CIBIL_Score; userEmail = input.Email; userName = input.Name; // You need to get the Document ID from the URL of your Zoho WriterExtracting Images from a Zoho Creator Report into a Pages
If you’ve uploaded images in a form and can see them in your report, you might also want to display those same images inside a Page (custom HTML page). This is useful for dashboards, profile pages, or any place where images should be visible dynamicallyZoho is blocking emails I subscribe to from one sender
About 4 months ago I stopped receiving newsletters that I subscribe to from @thedispatch.com. They tell me that zoho's server is blocking them. I've added them to my contacts list, but they're not even reaching my inbox. I don't know how to troubleshootIntroducing Formula Fields for performing dynamic calculations
Greetings, With the Formula Field, you can generate numerical calculations using provided functions and available fields, enabling you to derive dynamic data. You can utilize mathematical formulas to populate results based on the provided inputs. ThisInactive Items - Make Less Prominent by Default
Currently, when one marks an Item as "Inactive", it really doesn't do much of anything to hide it or get it out of the way. Search and reporting within Finance should, by default, hide inactive Items from standard reports, searches, etc. If one specificallyNext Page