Visualize your data with a new set of charts: Treemap, Butterfly, Sankey, and Cluster charts in Zoho CRM
Dear customers,
When it comes to analytics, it's not just about the numbers; it's about understanding the story behind them.
With that philosophy in mind, we’re excited to introduce a line of representations to the existing array of chart types in Zoho CRM: Treemap, butterfly, sankey and cluster charts. Let's go!
Treemaps
Treemap charts are used to visually represent hierarchical datasets in a rectangular layout. It aligns its parent categories as larger tiles with their sub-categories nested within them. The size of each tile is proportional to its corresponding value, making it easy to compare different segments within the hierarchy.
This is how a treemap chart looks:

These structured data representations help you understand overall performance and contributions, as well as compare participating entities at a glance.
Unlike traditional bar charts or pie charts, treemaps can be used if your datasets are large and exhibit parent-child relationships.
Here are some examples to better understand their usage:
Comparing revenue distribution between functions
A company's revenue is distributed among its functions before it gets further disbursed to its employees. Treemap charts can be used to depict this distribution and compare it between functions. As you can see below, the hierarchy can be represented as a treemap to compare it directly with other functions:

The hierarchy at the top shows just the numbers and levels, but the treemap chart represents the numbers proportionally, allowing leaders to visualize the difference in distribution.
Interpretation: As you can easily see in the treemap, sales and marketing receive the same amount of revenue, while engineering is given significantly more than the other two.
Likewise, with treemap charts, you can:
- Compare popular lead sources with lead counts is the measure and lead source being the participating entity—a classic single-grouping configuration.
- View cost savings achieved across departments. With the departments as the grouping parameters and the cost saved as the measured amount, the chart lays out all the departments as tiles in proportion, based on money saved.
- Compare ad spends across channels, where channels are the parent grouping and ad spend is the measured unit.
Butterfly
Butterfly charts are used to compare two related datasets side-by-side, resulting in a representation that looks like a butterfly or tornado.
Now, how does it differ from bar charts?
The standard bar chart can compare two entities for a given measure. Say, you are comparing the performance of Mary and Charles. The two users' data is represented using bars, and the length will denote their performances. But, when it comes to comparing their performances over a period or their contribution across different stages, a bar chart is not sufficient.


With butterfly charts, you can:
- Compare revenue between two of your branches each month. With branches being compared for sum of sales revenue, grouped by closing date.
- Compare the performance of two reps in a given quarter. Compared between two users for average of amount of deals, grouped by closing date until today.
In addition to the user-based comparison above, butterfly charts are well-suited to visualizing other types of data comparisons, like:
- Picklist-based comparisons
- Duration-based comparisons
- Aggregate-based comparisons
Business scenario
Comparing the number of deals closed for each lead sources: Duration-based comparison
You can identify the productive lead source by comparing the number of deal closures for every lead source in your organization based on their closing week.

Analyzing effective sales methodology, inbound vs. outbound: Picklist-based comparison
Businesses use both inbound and outbound lead generation strategies, and each of these methods can reap different results based on the season and occasion. By comparing inbound versus outbound each month, you can identify which works best at what time.

Analyze the amount versus the expected revenue between accounts: Aggregate-based comparison
Expected revenue is a result of a deal's progression in the sales pipeline. Comparing the amount versus their expected revenue will not only help visualize the expected revenue of participating accounts but also indicate the accounts' stage in the sales pipeline.

Sankey
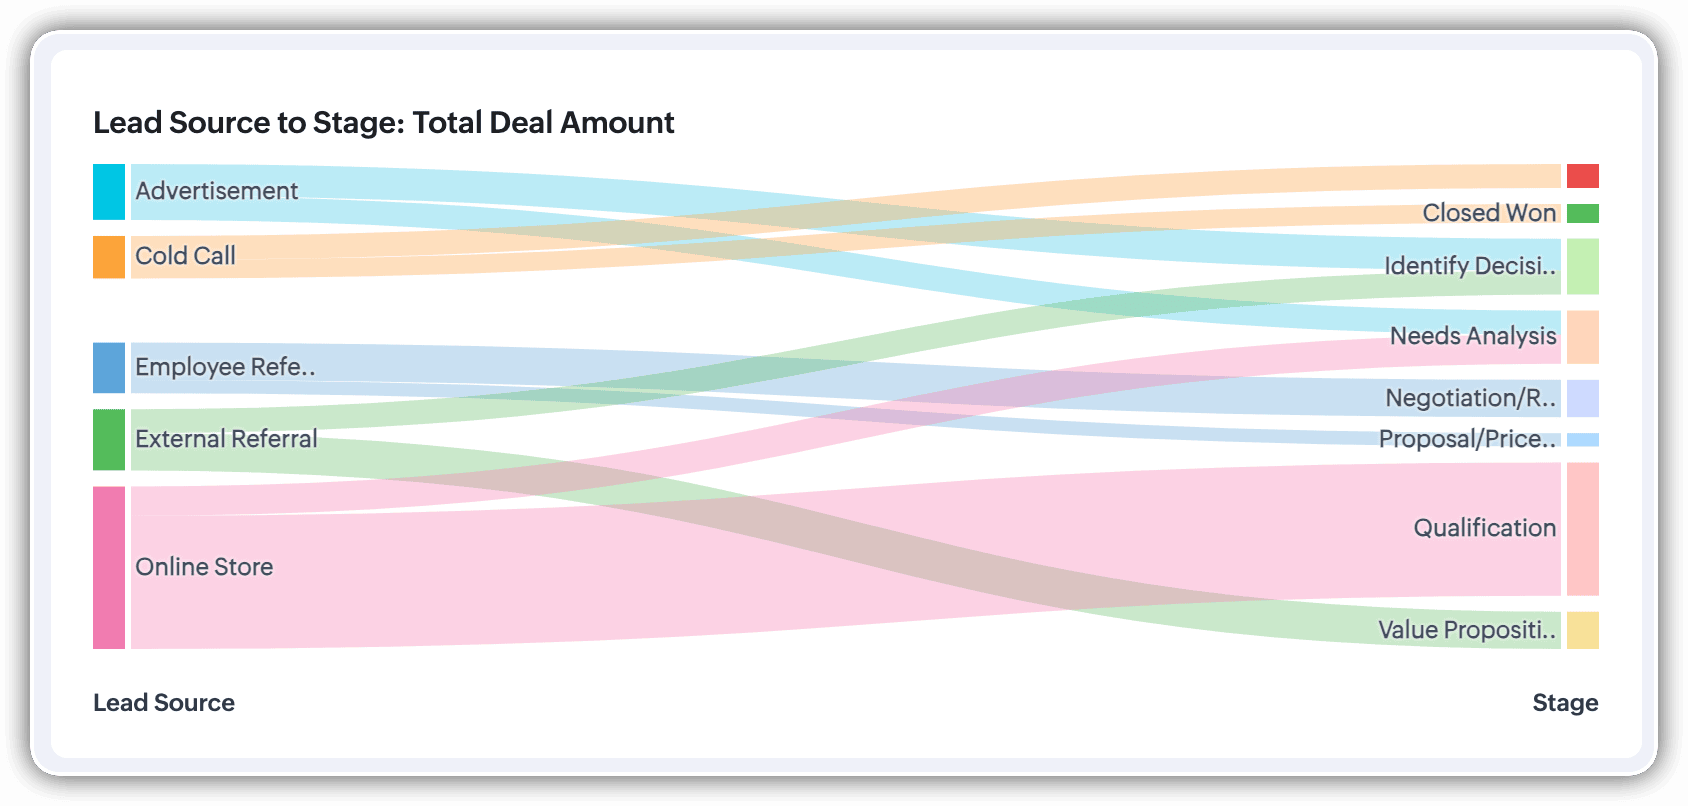
A Sankey Chart is designed to visualize the movement of data across different data groups. Unlike traditional charts—such as bar, column, pie, or donut—that mainly provide a static distribution of values, the Sankey Chart focuses on illustrating the flow between multiple segments or grouping fields. This makes it an ideal choice when you want to track how values (like lead counts, revenue, or deal statuses) move from one category to the next.

Key features
- Flow visualization: With the Sankey Chart, you can observe the movement of data between different groups.
- Multiple grouping fields: This chart works best when you have at least two grouping fields. You can go even further and add a third grouping to see an even more detailed mapping of your data flow.
- Simple configuration: The configuration for the Sankey Chart is as simple as any other chart type in Analytics.
Business scenarios:
Imagine you’re a sales manager trying to get a better handle on your team’s performance and your company’s pipeline. You want to understand not just how many deals are coming in, but also which sources are contributing the most value—and how those deals are progressing through different sales stages.
Let’s say you want to understand which lead sources are driving the most deal activity and how those deals progress through the pipeline. You can create a Sankey chart that maps the count of deals from Lead Source to Stage.

After analyzing the chart, you might notice that Online Store brings in a high volume of early-stage deals, while sources like External Referral contribute fewer deals that are more likely to reach advanced stages like Proposal or Negotiation.
This insight helps you prioritize nurturing the most profitable channels.
Sankey charts can also be helpful in other operational scenarios where understanding transitions across stages or teams is essential:
- Regional revenue distribution: Visualize how revenue flows across different regions, product categories, and their corresponding annual revenue. This helps you compare which regions contribute the most to each product line and where your high-value segments lie.
- Ticket handling flow: Visualize the flow of support tickets from their origin channel to internal departments and finally to resolution statuses. This can reveal workload imbalances or common points of delay in your support process.
Cluster
A cluster chart is similar to stacked column charts, but instead of stacking horizontally, the data is represented as vertical bars. As you create a column chart with multiple groupings, you can change the type of column chart to a cluster chart to achieve this representation.

In the above image, you can see the stacked column chart compares the number of lead conversions based on popular sources between countries. The stacks appearing on top of existing stacks ask you to calibrate the record count (y-axis) based on the previous stacks, which can lead to inaccurate interpretations. In this case, a cluster representation will paint a clearer picture of the analyses.
Other minor enhancements:
In addition to the three charts we mentioned above, we've also made the following minor changes:
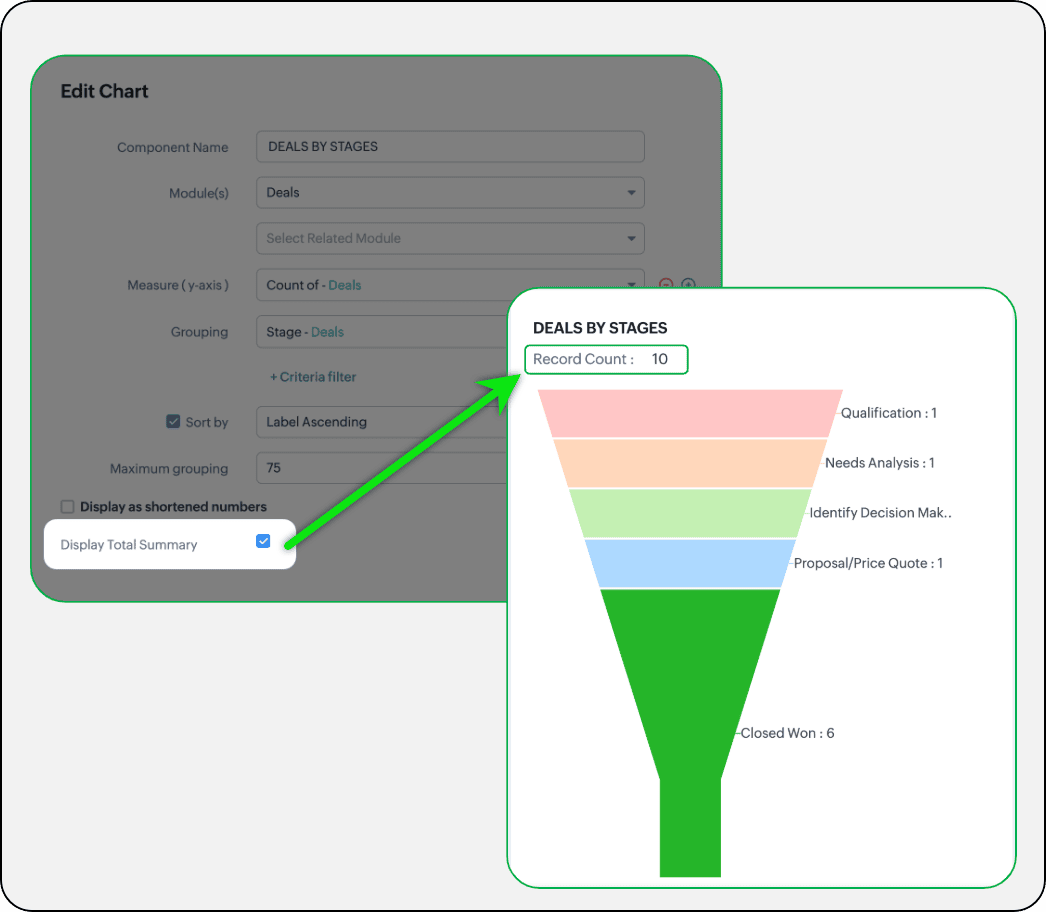
- Display total summary: Thus far, for all charts, each participating measure included labels. Now, to better understand overall contributions, a check box to display the total summary is provided under More options on the Chart Configuration page. Based on the configuration, the total revenue or the rolled-up quantities will be prominently displayed.
- Merge Y-axis: For charts that use two y-axis measurements, the intention is to view the progression of one entity against these two measures. Despite the scale, if the y-axis on the left is disproportionate to the values of the y-axis on the right, the plotted graph will result in a graphically and logically incorrect representation.
As you can see in the image below, the plot area of the sum of amount bar and the sum of expected revenue aligns close together, while, the difference between $700,000 and $40,500 is drastic, creating inaccurate interpretations.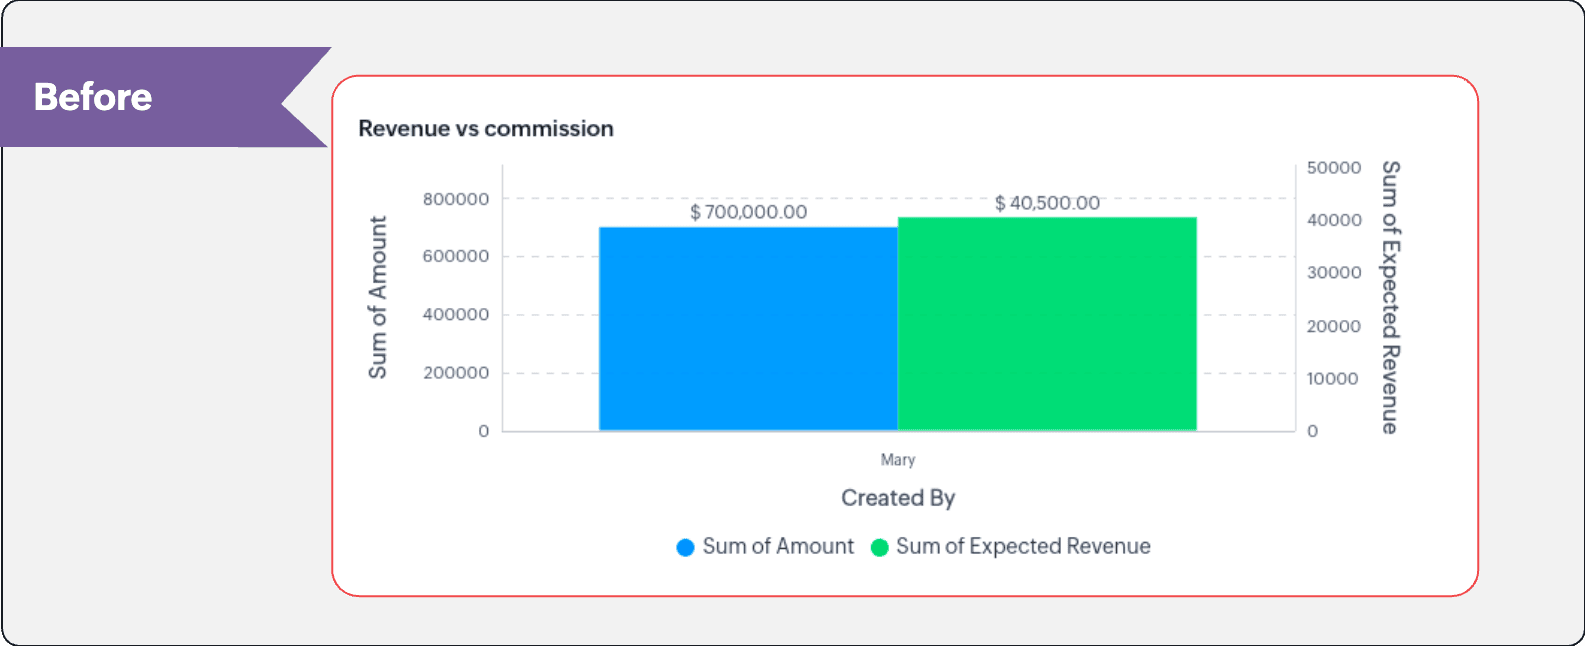
In this enhancement, we're allowing neighboring values of measures to merge so that the interpretation can be more visually accurate.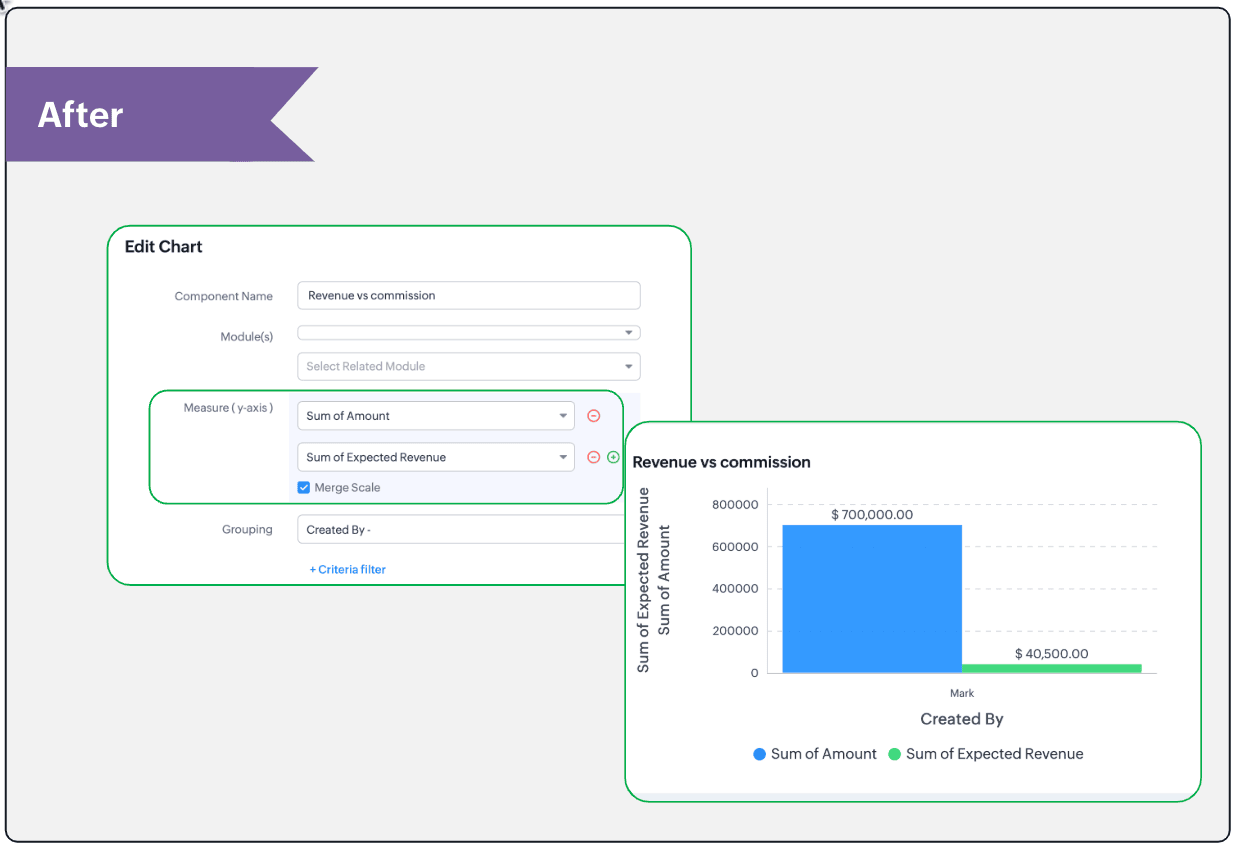
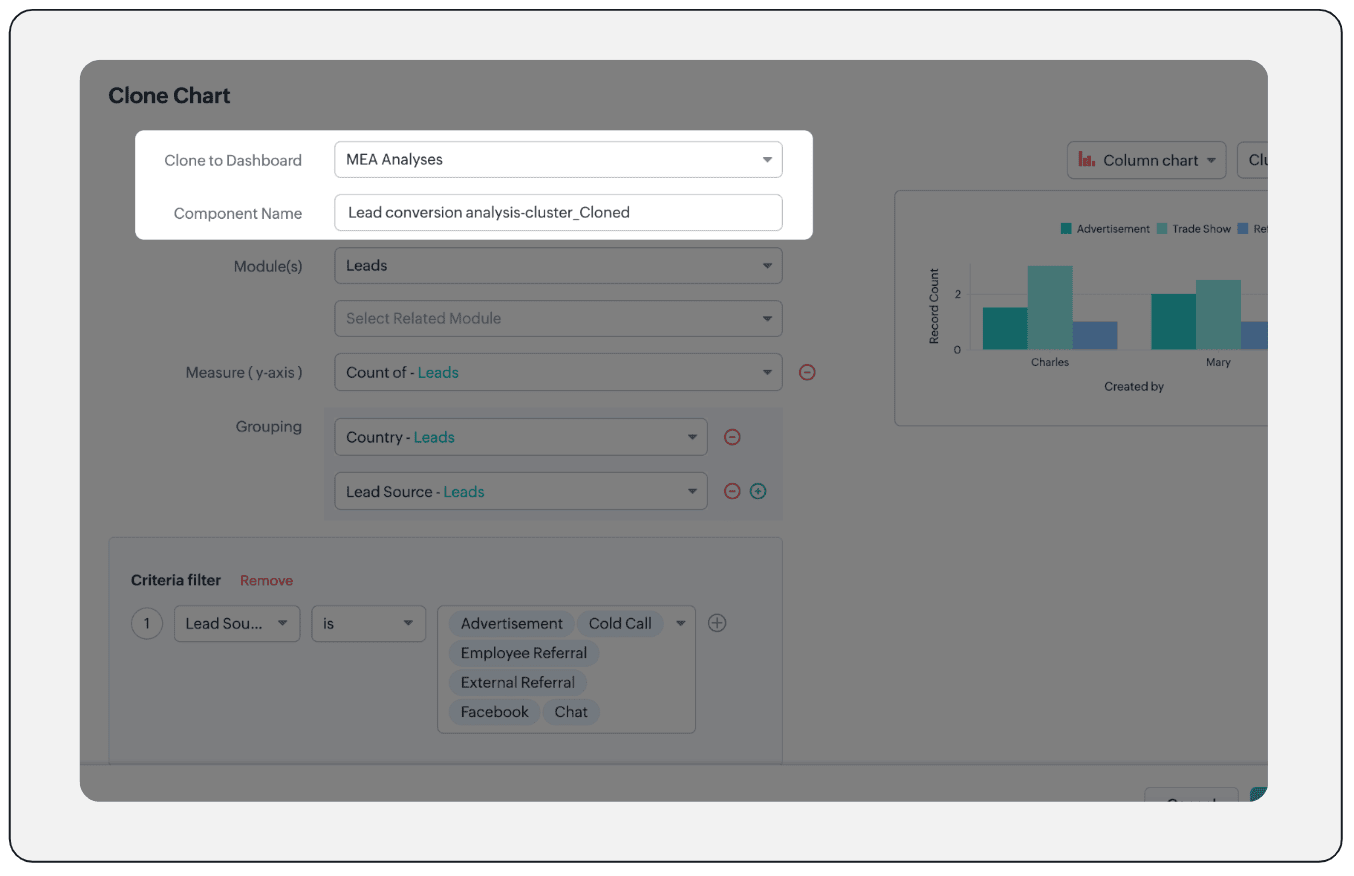
- Clone components to a different dashboard: Dashboards in Analytics serve in unique ways for various audiences—there can be separate dashboards for the sales team, marketing team, engineering team, and so on, and the chances of using the same measure for reference is common. Thus, when you clone a chart, you can now determine the target dashboard in which the cloned chart can be placed.
Resource: Help document
Thanks and have a good one!
Kind regards,
Saranya Balasubramanian
Saranya Balasubramanian
Topic Participants
Saranya Balasubramanian
Sticky Posts
Good news! Calendar in Zoho CRM gets a face lift
Dear Customers, We are delighted to unveil the revamped calendar UI in Zoho CRM. With a complete visual overhaul aligned with CRM for Everyone, the calendar now offers a more intuitive and flexible scheduling experience. What’s new? Distinguish activitiesVoC in Zoho CRM is now data savvy: Explore response drilldown, summary components and participation in CRM criteria
VoC has all the goods when it comes to customer intelligence—which is why we're constantly enhancing it. We recently added the following: A customer drilldown component that shows you the list of prospects and customers behind a chart's attribute ExpandedWrapping up 2025 on a high note: CRM Release Highlights of the year
Dear Customers, 2025 was an eventful year for us at Zoho CRM. We’ve had releases of all sizes and impact, and we are excited to look back, break it down, and rediscover them with you! Before we rewind—we’d like to take a minute and sincerely thank youPresenting ABM for Zoho CRM: Expand and retain your customers with precision
Picture this scenario: You're a growing SaaS company ready to launch a powerful business suite, and are looking to gain traction and momentum. But as a business with a tight budget, you know acquiring new customers is slow, expensive, and often deliversCreate and populate a record in an instant: Introducing zero-shot field prompting to Zia's ICR
A couple of months ago, we upgraded our in-house AI image detection and validation tool, Zia Vision, with intelligent character recognition (ICR). By training Zia with sample images, you could create and enrich CRM records with data extracted from standard
Recent Topics
What's new in Zoho Sheet: Simplify data entry and collaboration
Hello, Zoho Sheet community! Last year, our team was focused on research and development so we could deliver updates that enhance your spreadsheet experience. This year, we’re excited to deliver those enhancements—but we'll be rolling them out incrementally#7 Tip of the week: Delegating approvals in Zoho People
With Zoho People, absences need not keep employees waiting with their approval requests. When you are not available at work, you can delegate approvals that come your way to your fellow workmate and let them take care of your approvals temporarily. Learn more!Admin Tip: Manage sub-domain emails using sub-domain stripping
As an admin, you may need separate domains for different departments such as sales, support, and marketing. While this approach offers flexibility, creating and managing multiple domains can quickly become overwhelming, especially since each domain requiresBring Zoho Shifts Capabilities into Zoho People Shift Module
Hello Zoho People Product Team, After a deep review of the Zoho People Shift module and a direct comparison with Zoho Shifts, we would like to raise a feature request and serious concern regarding the current state of shift management in Zoho People.Quick Copy Column Name
Please add the ability to quickly copy the name of a column in a Table or Query View. When you right-click the column there should be an option to copy the name, or if you left-click the column and use the Ctrl+C keyboard shortcut it should copy theAbility to Edit YouTube Video Title, Description & Thumbnail After Publishing
Hi Zoho Social Team, How are you? We would like to request an enhancement to Zoho Social that enables users to edit YouTube video details after the video has already been published. Your team confirmed that while Zoho Social currently allows editing theHow do I remove a data source from Zoho Analytics?
I am unable to find a delte option on a datasource that i put in the system as an error. On teh web it refers to a setup icon but I do not see that on my interface?Add Employee Availability Functionality to Zoho People Shift Module
Hello Zoho People Product Team, Greetings and hope you are doing well. We would like to submit a feature request to enhance the Zoho People Shift module by adding employee availability management, similar to the functionality available in Zoho Shifts.Bigin, more powerful than ever on iOS 26, iPadOS 26, macOS Tahoe, and watchOS 26.
Hot on the heels of Apple’s latest OS updates, we’ve rolled out several enhancements and features designed to help you get the most from your Apple devices. Enjoy a refined user experience with smoother navigation and a more content-focused Liquid GlassReally want the field "Company" in the activities module!
Hi team! Something we are really missing is able to see the field Company when working in the activities module. We have a lot of tasks and need to see what company it's related to. It's really annoying to not be able to see it.🙈 Thx!Delay in rendering Zoho Recruit - Careers in the ZappyWorks
I click on the Careers link (https://zappyworks.zohorecruit.com/jobs/Careers) on the ZappyWorks website expecting to see the job openings. The site redirects me to Zoho Recruit, but after the redirect, the page just stays blank for several seconds. I'mIs Desk Down?
Across department - always an error. [Status Mode] - error [Table View and the rest] - workingWe Asked, Zoho Delivered: The New Early Access Program is Here
For years, the Zoho Creator community has requested a more transparent and participatory approach to beta testing and feature previews. Today, I'm thrilled to highlight that Zoho has delivered exactly what we asked for with the launch of the Early AccessCan the Product Image on the Quote Template be enlarged
Hello, I am editing the Quote Template and added ${Products.Product Image} to the line item and the image comes up but it is very tiny. Is there anyway that you can resize this to be larger? Any help would be great! ThanksHow do I change the wording of the tile of SignForm?
When my user opens a SignForm url, the title that is presented is always "SignForm signer Information" and a form is displayed asking for the username and email address. This can be confusing to the end user. How can I change the title at least (Or atHow to link tickets to a Vendor/Vendor Contact (not Customer) for Accounting Department?
Hi all, We’re configuring our Accounting department to handle tickets from both customers and vendors (our independent contractors). Right now, ticket association seems to be built around linking a ticket to a Customer / Customer Contact, but for vendor-originatedProblem with CRM Connection not Refreshing Token
I've setup a connection with Zoom in the CRM. I'm using this connection to automate some registrations, so my team doesn't have to manually create them in both the CRM and Zoom. Connection works great in my function until the token expires. It does not refresh and I have to manually revoke the connection and connect it again. I've chatted with Zoho about this and after emailing me that it couldn't be done I asked for specifics on why and they responded. "The connection is CRM is not a feature toAutomatic Matching from Bank Statements / Feeds
Is it possible to have transactions from a feed or bank statement automatically match when certain criteria are met? My use case, which is pretty broadly applicable, is e-commerce transactions for merchant services accounts (clearing accounts). In theseClone Recurring Expenses
Our bookkeeping practices make extensive use of the "clone" feature for bills, expenses, invoices, etc. This cuts down significantly on both the amount of typing that needs to be done manually and, more importantly, the mental overhead of choosing theUnify Overlapping Functionalities Across Zoho Products
Hi Zoho One Team, We would like to raise a concern about the current overlap of core functionalities across various Zoho applications. While Zoho offers a rich suite of tools, many applications include similar or identical features—such as shift management,Automation #7 - Auto-update Email Content to a Ticket
This is a monthly series where we pick some common use cases that have been either discussed or most asked about in our community and explain how they can be achieved using one of the automation capabilities in Zoho Desk. Email is one of the most commonlyTicket to article and Ticket to template
Hello! I would like to know if it is possible (and how) to do the following actions: 1. To generate an article from a ticket (reply + original message) 2. Easy convert an answer to an email templateIs there API Doc for Zoho Survey?
Hi everyone, Is there API doc for Zoho Survey? Currently evaluating a solution - use case to automate survey administration especially for internal use. But after a brief search, I couldn't find API doc for this. So I thought I should ask here. ThanWindows Desktop App - request to add minimization/startup options
Support Team, Can you submit the following request to your development team? Here is what would be optimal in my opinion from UX perspective: 1) In the "Application Menu", add a menu item to Exit the app, as well as an alt-key shortcut for these menusCreating Parent Child relationship in Accounts
We have customers with multiple locations, I setup the HQ as an account, then I setup the different sites marking the HQ as the parent to that location. If I then do a Deal for one of the locations, is there a way to show by looking at the parent accountKaizen #225 - Making Query-based Custom Related Lists Actionable with Lookups and Links
Hello everyone! Welcome back to another post in the Kaizen series! This week, we will discuss an exciting enhancement in Queries in Zoho CRM. In Kaizen #190, we discussed how Queries bridge gaps where native related lists fall short and power custom relatedWebDAV / FTP / SFTP protocols for syncing
I believe the Zoho for Desktop app is built using a proprietary protocol. For the growing number of people using services such as odrive to sync multiple accounts from various providers (Google, Dropbox, Box, OneDrive, etc.) it would be really helpfulCRM x WorkDrive: We're rolling out the WorkDrive-powered file storage experience for existing users
Release plan: Gradual rollout to customers without file storage add-ons, in this order: 1. Standalone CRM 2. CRM Plus and Zoho One DCs: All | Editions: All Available now for: - Standalone CRM accounts in Free and Standard editions without file storageNon-responsive views in Mobile Browser (iPad)
Has anyone noticed that the creator applications when viewed in a mobile browser (iPad) lost its responsiveness? It now appears very small font size and need to zoom into to read contents. Obviously this make use by field staff quite difficult. This is not at all a good move, as lots of my users are depending on accessing the app in mobile devices (iPads), and very challenging and frustrating.[Free Webinar] Learning Table Series - AI-Enhanced Logistics Management in Zoho Creator
Hello Everyone! We’re excited to invite you to another edition of Learning Table Series, where we showcase how Zoho Creator empowers industries with innovative and automated solutions. About Learning Table Series Learning Table Series is a free, 45-60Learner transcript Challenges.
Currently i am working on a Learner Transcript app for my employer using Zoho Creator. The app is expected to accept assessment inputs from tutors, go through an approval process and upon call up, displays all assessments associated with a learner inCustomizable UI components in pages | Theme builder
Anyone know when these roadmap items are scheduled for release? They were originally scheduled for Q4 2025. https://www.zoho.com/creator/product-roadmap.htmlFeature Request - Set Default Values for Meetings
Hi Zoho CRM Team, I would be very useful if we could set default values for meeting parameters. For example, if you always wanted Reminder 1 Day before. Currently you need to remember to choose it for every meeting. Also being able to use merge tags toAnalytics <-> Invoice Connection DELETED by Zoho
Hi All, I am reaching out today because of a big issue we have at the moment with Zoho Analytics and Zoho Invoice. Our organization relies on Zoho Analytics for most of our reporting (operationnal teams). A few days ago we observed a sync issue with theHow to use Rollup Summary in a Formula Field?
I created a Rollup Summary (Decimal) field in my module, and it shows values correctly. When I try to reference it in a Formula Field (e.g. ${Deals.Partners_Requested} - ${Deals.Partners_Paid}), I get the error that the field can’t be found. Is it possibleZoho Creator to Zoho CRM Images
Right now, I am trying to setup a Notes form within Zoho Creator. This Notes will note the Note section under Accounts > Selected Account. Right now, I use Zoho Flow to push the notes and it works just fine, with text only. Images do not get sent (thereCRM gets location smart with the all new Map View: visualize records, locate records within any radius, and more
Hello all, We've introduced a new way to work with location data in Zoho CRM: the Map View. Instead of scrolling through endless lists, your records now appear as pins on a map. Built on top of the all-new address field and powered by Mappls (MapMyIndia),Error Logs / Failure logs for Client Scripts Functions
Hi Team, While we are implementing client scripts for the automation, it is working fine in few accounts but not working for others. So, it would be great if we can have error Logs for client scripts also just like custom functions. Is there any way thatAutomate pushing Zoho CRM backups into Zoho WorkDrive
Through our Zoho One subscription we have both Zoho CRM and Zoho WorkDrive. We have regular backups setup in Zoho CRM. Once the backup is created, we are notified. Since we want to keep these backups for more than 7 days, we manually download them. TheyZoho Books blocks invoicing without VeriFactu even though it is not mandatory until 2027
I would like to highlight a very serious issue in Zoho Books for Spain. 1. The Spanish government has postponed the mandatory start of VeriFactu to January 1st, 2027. This means that during all of 2026 businesses are NOT required to transmit invoicesNext Page