Dashboards in Zoho Apptics
Overview
Apptics provides multiple dashboards to help you monitor application performance and usage at different levels.
- The home dashboard provides an organization-level overview across all or selected projects.
- The project dashboard provides detailed project-specific insights based on selected date ranges, platforms, and filters.
- The real-time dashboard provides live insights into application activity from the last one hour.
Home dashboard
The home page is where you can get an overview of all the projects that are a part of the organization. The home page dashboard displays high-level metrics across your organization for all or selected projects. It helps you monitor overall project performance.
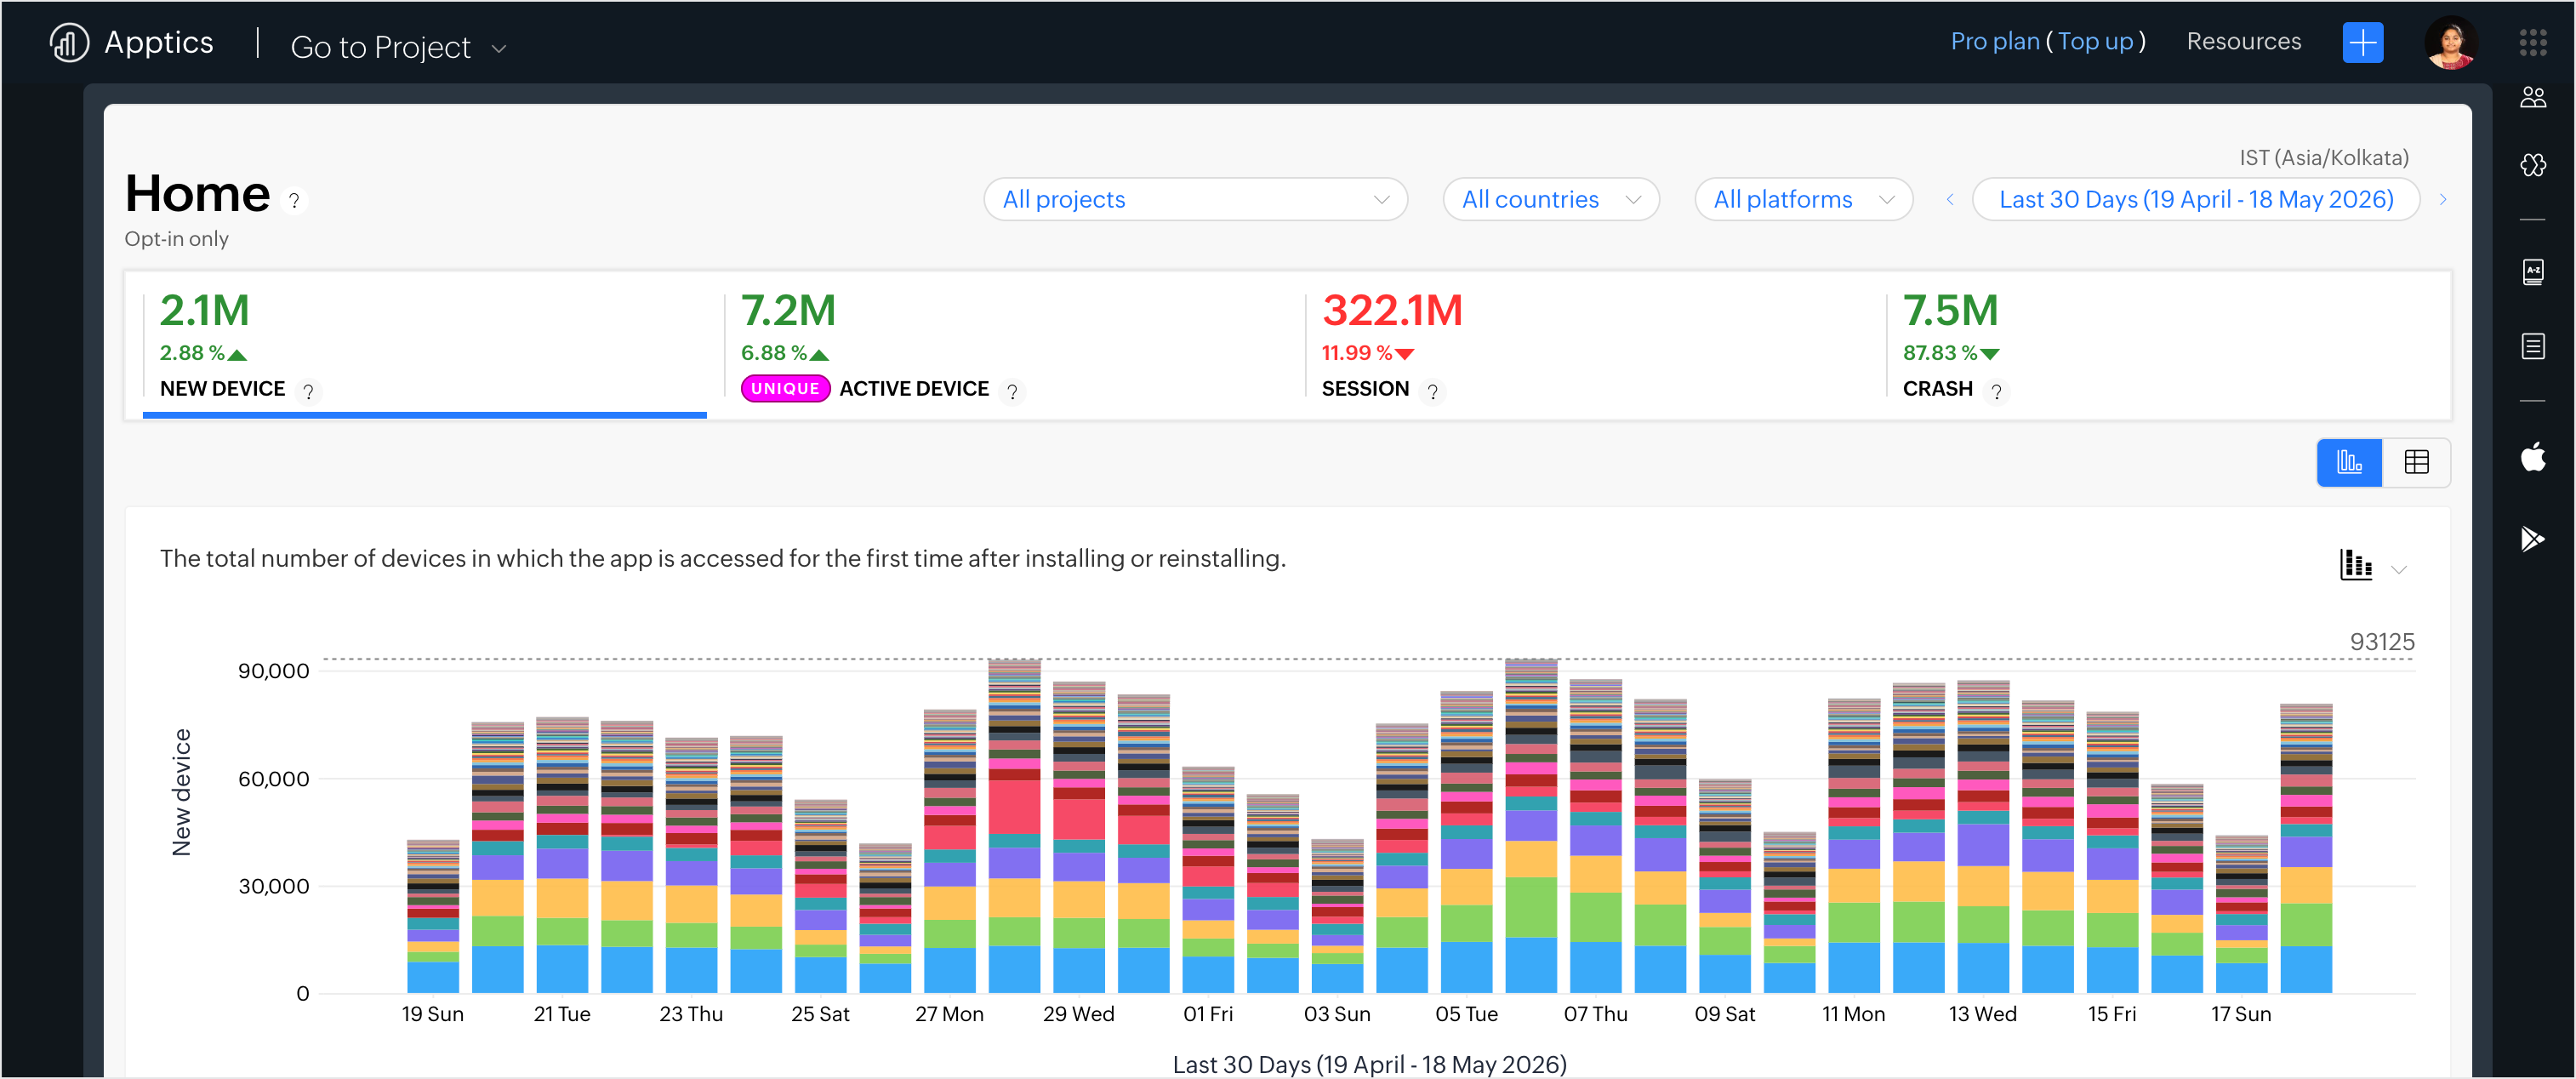
The dashboard includes aggregated metrics such as:
- Sessions
- Active devices
- New devices
- Crashes
Project dashboard
Once you navigate from home page drop down to an individual project, you can see the Project dashboard displaying metrics specific to the individual project. You can analyze application performance using selected date ranges, platforms and common filters.
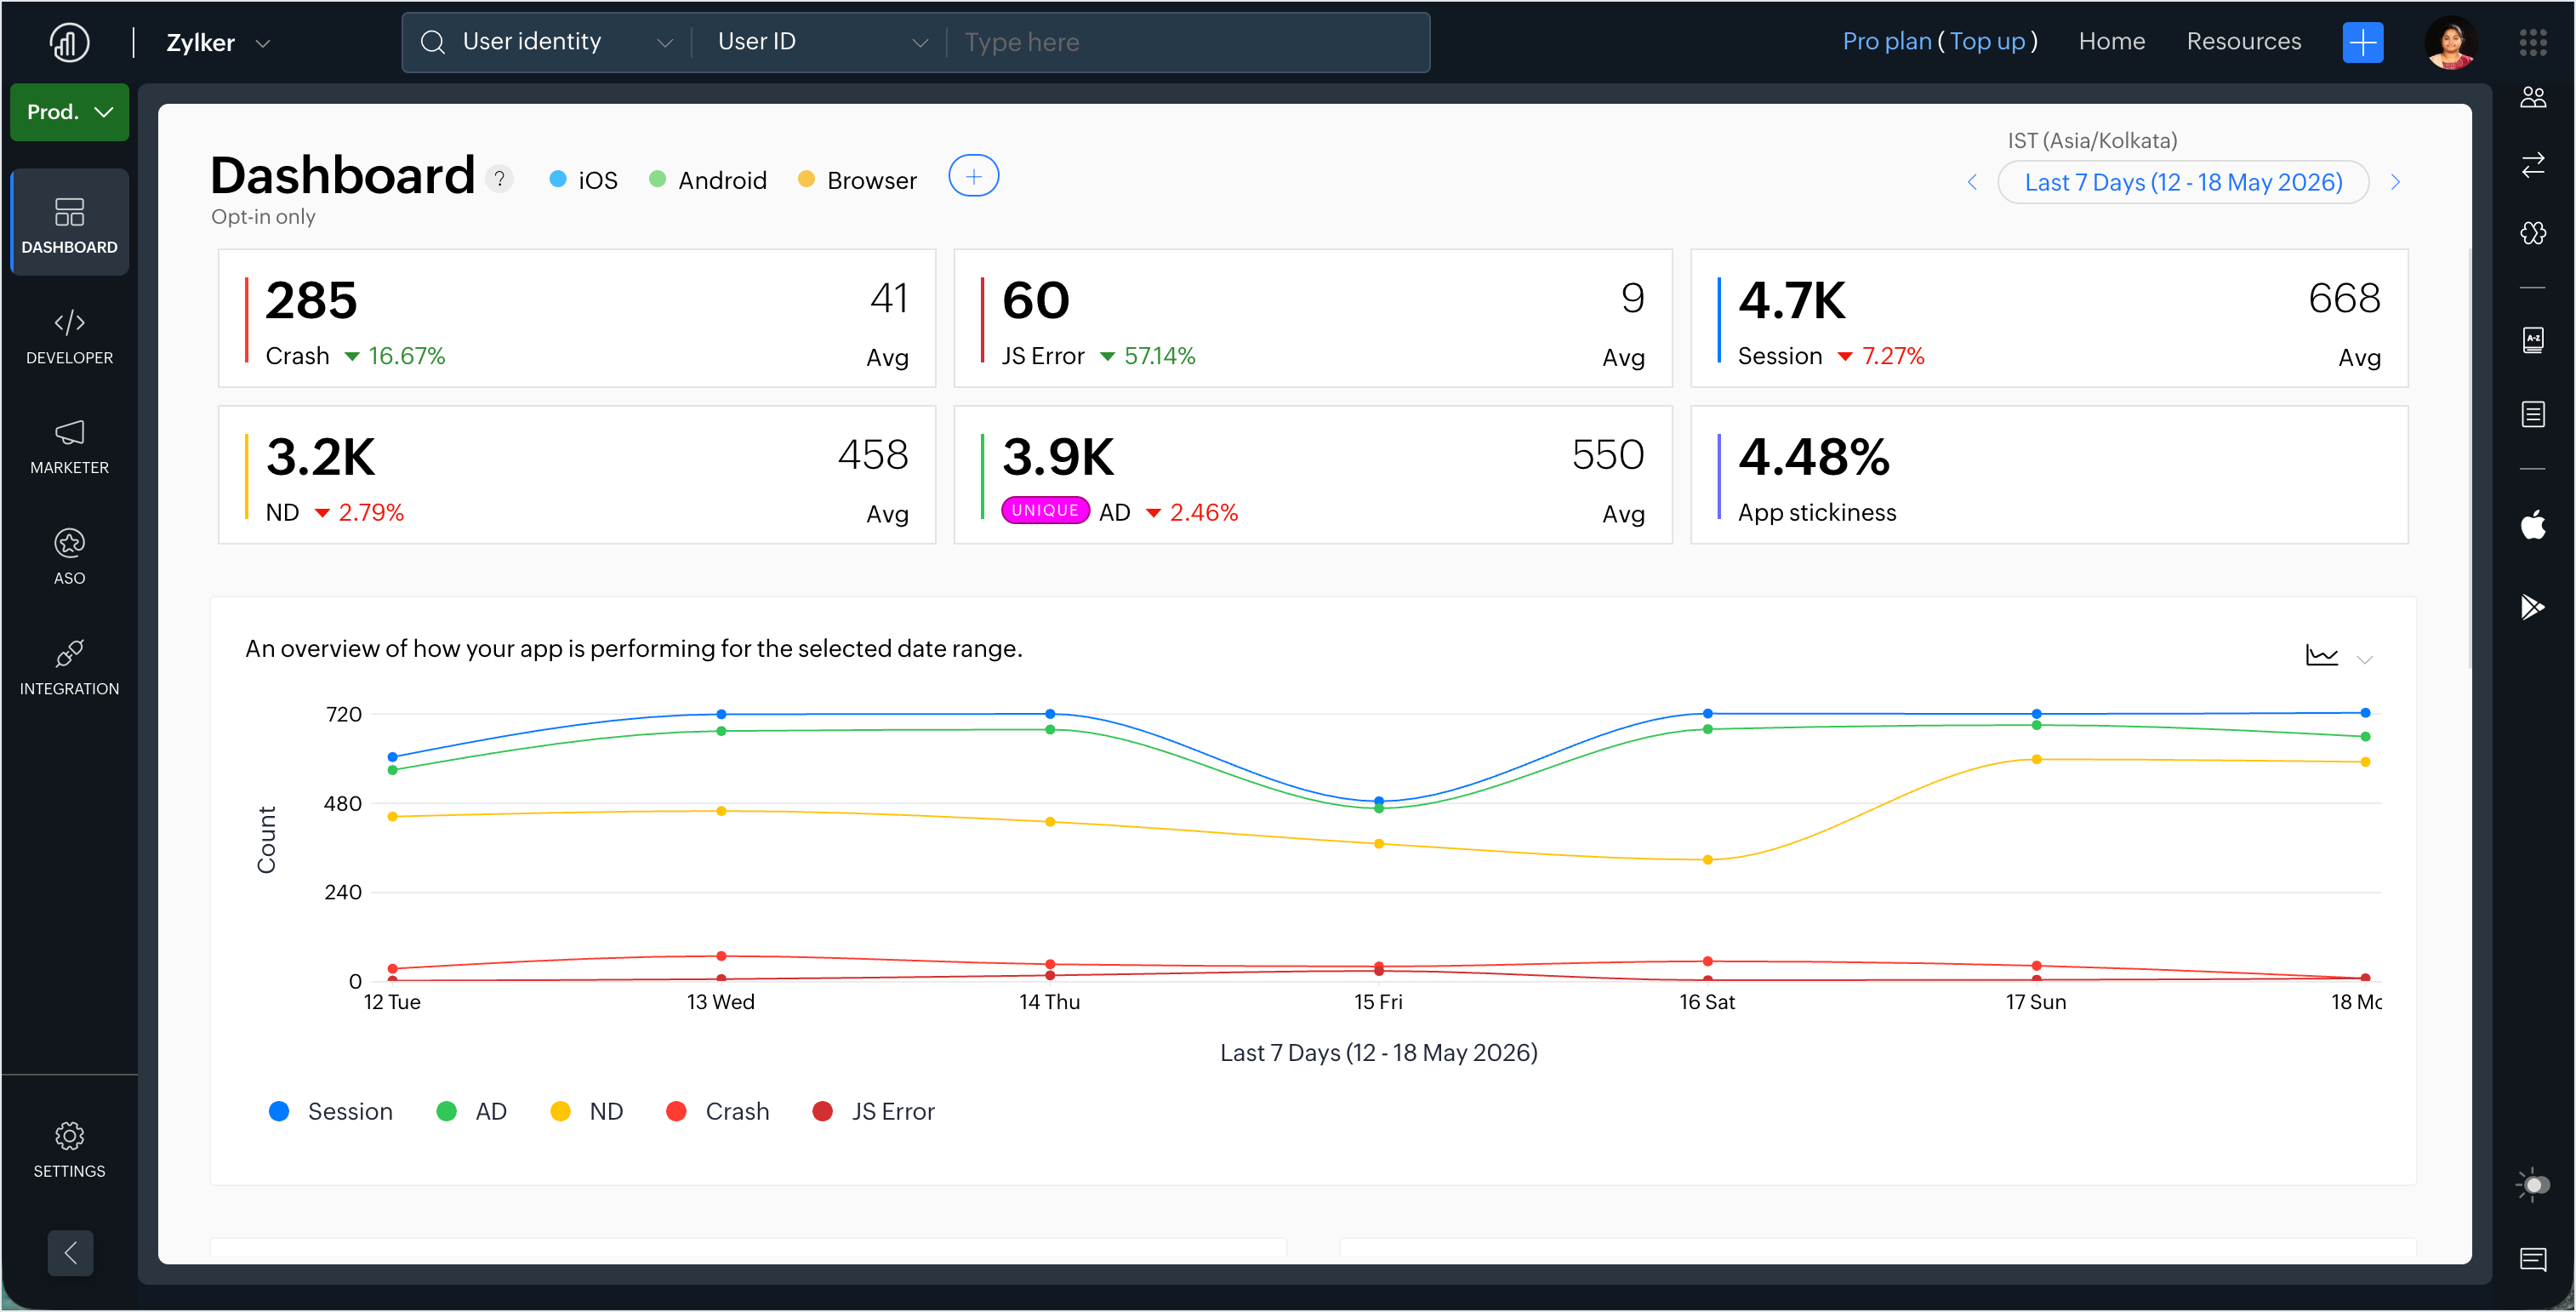
This dashboard provides detailed project-level insights for monitoring application health and user activity over time and helps you perform cross-platform analysis in a single place. The stats include:
- Sessions: A session in Zoho Apptics includes the time between app opened in foreground till it is closed or goes to the background. What ever happens from when the app was opened to when it was closed is known as session context and can be seen as user session details in Apptics console.
- New devices: The devices in which the app was installed/re-installed and opened for the first time.
- Active devices: The devices in which at least on active session happened in the selected date range. The unique count for includes the unique active devices for that particular day. For example, if the same device has accessed the app more than once in a single day it will still be counted as one.
- Crashes: The app crashes that happened during the selected date range, making the app to forcefully quit or hang while using it.
- JS errors: The errors reported for web (JavaScript) apps in the selected date range.
- App stickiness: The percentage of unique active devices that engaged with the app regularly over the last 30 days. It is calculated by taking the ratio of (average of daily active devices) / (total number of unique active devices over the last 30 days) x 100.
- Top events: Top five user actions that were performed within apps and tracked as in-app events in Apptics console.
- Top screens: Top five screens/views/pages that were accessed within apps and tracked as screens in Apptics console.
Real-time dashboard
Navigate to Developer > Real-time and you will see the real-time dashboard that displays live application metrics collected during the last one hour. Unlike the home and project dashboards, which display historical trends based on selected filters and date ranges, the real-time dashboard focuses on current application activity.
You can use real-time dashboard to:
- Monitor live traffic after a deployment
- Detect spikes in crashes or JS errors
- Track user engagement during campaigns or launches
- Validate event, API, and screen tracking
- Observe live application usage trends
Real-time metrics
The Real-time dashboard refreshes automatically and displays the remaining time for the next refresh. You can view real-time stats of metrics such as crashes, sessions, new devices, active devices, APIs, top events, and top screens for the last hour.

Note: The data will be available in the real-time dashboard is only for the last 1 hour and refreshes every 30 seconds.