Forecast UI improvements
Hi
I have two improvement requests for the UI in the Forecast function.
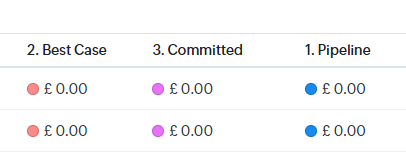
Can you add the ability to reorganise the Pipeline, Committed and Best Case columns on the Forecast? I thought they were in alphabetical order, so we renamed them so that we could have the order go from Pipeline (40%+ probability), Committed (80%+) and Best Case (95%). Only renaming them didn't change the order. Now, I might have missed something but the current order isn't sorted at all; it's alphabetical but not on the renamed field names, it's not going from least likely to most likely order, or vicaversa.
A column arrangement option would be great, or just order them by name.
Also, in the Hierarchy screen of the Forecast there are some great graphs. However, you can't reorganise them and, in particular, you can't resize them and they are squished on one row. Being able to view larger versions, or to have a dashboard style ability to resize them would be great. Great data there, just hard to see.
The graphs there also default to daily, which is odd if you are viewing a quarterly forecast, and the graph is the size of a postcard. You get A LOT of data points in a very small area. If Zoho could remember my choice (daily, weekly, monthly etc) so that when I went back to that page it remembered, that would be great, or have the default choice match the period (quarterly should probably show monthly data points by default, for example).
A great set of data but not fully accessible.
Topic Participants
Oliverma Marshall
Pheranda Nongpiur
Sticky Posts
Introducing Multiple Sandbox Types and Support for Module's Data Population
Register here for the upcoming Focus Group webinar on Multiple Sandbox | Help documentation to learn more about the new enhancements Hello everyone, Sandbox in CRM is a testing environment for users to create and test new configurations like workflowGood news! Calendar in Zoho CRM gets a face lift
Dear Customers, We are delighted to unveil the revamped calendar UI in Zoho CRM. With a complete visual overhaul aligned with CRM for Everyone, the calendar now offers a more intuitive and flexible scheduling experience. What’s new? Distinguish activitiesVoC in Zoho CRM is now data savvy: Explore response drilldown, summary components and participation in CRM criteria
VoC has all the goods when it comes to customer intelligence—which is why we're constantly enhancing it. We recently added the following: A customer drilldown component that shows you the list of prospects and customers behind a chart's attribute ExpandedWrapping up 2025 on a high note: CRM Release Highlights of the year
Dear Customers, 2025 was an eventful year for us at Zoho CRM. We’ve had releases of all sizes and impact, and we are excited to look back, break it down, and rediscover them with you! Before we rewind—we’d like to take a minute and sincerely thank youPresenting ABM for Zoho CRM: Expand and retain your customers with precision
Picture this scenario: You're a growing SaaS company ready to launch a powerful business suite, and are looking to gain traction and momentum. But as a business with a tight budget, you know acquiring new customers is slow, expensive, and often delivers
Recent Topics
URGENT: Deluge issue with Arabic text Inbox
Dear Deluge Support, We are facing an issue that started on 12/Feb/2026 with custom functions written using Deluge within Qntrl platform. Currently, custom functions do not accept Arabic content; it is replaced with (???) characters. Scenario 1: If weFile Conversion from PDF to JPG/PNG
Hi, I have a question did anyone every tried using custom function to convert a PDF file to JPG/PNG format? Any possibility by using the custom function to achieve this within zoho apps. I do know there are many third parties API provide this withNow in Zoho One: Orchestrate customer journeys across apps with Zoho CommandCenter
Hello Zoho One Community! We’re excited to introduce Zoho CommandCenter as a new capability available in Zoho One. For the whole customer journey As Zoho One customers adopt more apps across sales, marketing, finance, and support, a common challenge emerges:annualy customer report
we need a report per customer that looks like this invoic number cleaning laundry repair management 01 january xxx euro xx euro xx euro xxx euro 02 february xxx euro xxx euro x euro xxxx euro and so on the years 12 months is that possible to make andTotals for Sales Tax Report
On the sales tax report, the column totals aren't shown for any column other than Total Tax. I can't think of a good reason that they shouldn't be included for the other columns, as well. It would help me with my returns, for sure. It seems ludicrousFree Webinar: Zoho Sign for Zoho Projects: Automate tasks and approvals with e-signatures
Hi there! Handling multiple projects at once? Zoho Projects is your solution for automated and streamlined project management, and with the Zoho Sign extension, you can sign, send, and manage digital paperwork directly from your project workspace. JoinExported Report File Name
Hi, We often export reports for information. It is time consuming to rename all the reports we export on a weekly basis, as when exported their default name is a seemingly random string of numbers. These numbers may be important, I'm not sure, but I amAutomatic Refresh on Page?
Hi everyone, We use a page as a dashboard which shows data for the laboratory and tasks pending etc. Is there a way to set the page to automatically refresh on a X time? Many thanks TOGHow do I edit the Calendar Invite notifications for Interviews in Recruit?
I'm setting up the Zoho Recruit Interview Calendar system but there's some notifications I don't have any control over. I've turned off all Workflows and Automations related to the Calendar Scheduling and it seems that it's the notification that is sentAdd RTL and Hebrew Support for Candidate Portal (and Other Zoho Recruit Portals)
Dear Zoho Recruit Team, I hope you're doing well. We would like to request the ability to set the Candidate Portal to be Right-to-Left (RTL) and in Hebrew, similar to the existing functionality for the Career Site. Currently, when we set the Career SiteCRM x WorkDrive: File storage for new CRM signups is now powered by WorkDrive
Availability Editions: All DCs: All Release plan: Released for new signups in all DCs. It will be enabled for existing users in a phased manner in the upcoming months. Help documentation: Documents in Zoho CRM Manage folders in Documents tab Manage filesIntroducing Workqueue: your all-in-one view to manage daily work
Hello all, We’re excited to introduce a major productivity boost to your CRM experience: Workqueue, a dynamic, all-in-one workspace that brings every important sales activity, approval, and follow-up right to your fingertips. What is Workqueue? SalesDefault Reminder Time in New Tasks or New Event?
Any way to change this from 1:00am? Thanks, Gary Moderation Update (February 2026): With the Calendar preferences, the default reminder time for Meetings, Appointments and All-Day Meetings can be set. Read more: Calendar preferences in Zoho CRM RegardingDynamic Field Folders in OneDrive
Hi, With the 2 options today we have either a Dynamic Parent Folder and lots of attachments all in that one folder with only the ability to set the file name (Which is also not incremented so if I upload 5 photos to one field they are all named the sameRight Shift key not sending to Zoho Assist environments
I'm unable to use Right Shift key in Zoho environments. Zoho environments are Win10. Computer I access from is Win 11. Issue started when I changed to Win 11. Have tried: - Multiple browsers - web client AND desktop client - 3rd party mapping tools toUnable to Filter Retail Sales Orders & Need Paid/Unpaid Filter – Zoho Books
Hi Zoho Team, Recently you introduced Retail – Standard and Retail – Premium templates for Sales Orders. However, in the Sales Order module we still cannot filter or segregate Retail Sales Orders separately from normal B2B sales orders. Because of this,About Meetings (Events module)
I was working on an automation to cancel appointments in zoho flow , and in our case, we're using the Meetings module (which is called Events in API terms). But while working with it, I'm wondering what information I can display in the image where thePDF Annotation is here - Mark Up PDFs Your Way!
Reviewing PDFs just got a whole lot easier. You can now annotate PDFs directly in Zoho Notebook. Highlight important sections, add text, insert images, apply watermarks, and mark up documents in detail without leaving your notes. No app switching. NoAbility to assign Invoice Ownership through Deluge in FSM
Hi, As part of our process, when a service appointment is completed, we automated the creation of the invoice based on a specific business logic using Deluge. When we do that, the "Owner" of the invoice in Zoho FSM is defaulted to the SuperAdmin. ThisHow do you do ticket add ons in Backstage?
Hi Everyone, If you wanted to have general admin tickets and allow for add ons, like camping, or car or Carbon offset. What would you do? Peace RobinFrom Zoho CRM to Paper : Design & Print Data Directly using Canvas Print View
Hello Everyone, We are excited to announce a new addition to your Canvas in Zoho CRM - Print View. Canvas print view helps you transform your custom CRM layouts into print-ready documents, so you can bring your digital data to the physical world withvalidation rules doesn't work in Blueprint when it is validated using function?
I have tried to create a validation rule in the deal module. it works if I try to create a deal manually or if I try to update the empty field inside a deal. but when I try to update the field via the blueprint mandatory field, it seems the validationPull cells from one sheet onto another
Hello all! I have created an ingredients database where i have pricing and information and i want to pull from that database into a recipe calculator. I want it to pull based on what ingredient I choose. The ingredients database has an idea and i wantEmails Failing with “Relaying Issues – Mail Sending Blocked” in ZeptoMail
Hello ZeptoMail Support Team, We are facing an email delivery issue in our ZeptoMail account where emails are failing with the status “Process failed” and the reason “Relaying issues – Mail sending blocked.” Issue Details Agent Name: mail_agent_iwwa FromHow does Zoho handle support operations for our EU users?
Dear Zoho users, We have some news and reminders about how we handle support operations for Zoho users in the EU Data Center. This is part of our broader commitment to ensuring GDPR compliance and providing secure data handling for all users. We'd likeLayout Adjustment.
Hello Latha, Hope you are doing well. I wanted to check with you about adjusting the layout columns in the Service Report from the backend, as currently there is no capability for us to customize the layout from our end. Below is the output that I amAnyone in Australia using Zoho Books AND has their account with NAB?
Hi I have an account with both NAB and Suncorp. Suncorp transaction come in the next day however NAB transactions take 4-5 business days to appear. eg: A deposit made today in my Suncorp will be imported into Zoho tomorrow. A deposit made today to the NAB account will be imported maybe Saturday (Friday overnight). I have contacted both Zoho and NAB but noone seems to know why. I was just wondering if anyone else in Australia uses NAB and has this issue (or doesn't) maybe we could compare notes andZoho Often Lag
Desk Team, We've noticed that Desk, Creator & other apps seems to lag more these days. We often refresh multiple times.Offer already made- but I withdrew it
I made an offer letter, but made a mistake on it. I withdrew the offer but now I can't recreate the correct offer. Zoho keeps saying that "A same offer has already been made". I look in the "offers" and there are NO offers (this is the first time I'veImporting into the 'file upload' field
Can you import attachments into the file upload field. I would expect it to work the same way as attachments do, But can't seem to get it to work. Moderation Update: The option to import into File Upload and Image Upload fields has been supported. ReadLayout Rules Don't Apply To Blueprints
Hi Zoho the conditional layout rules for fields and making fields required don't work well with with Blueprints if those same fields are called DURING a Blueprint. Example. I have field A that is used in layout rule. If value of field A is "1" it is supposed to show and make required field B. If the value to field A is "2" it is supposed to show and make required field C. Now I have a Blueprint that says when last stage moves to "Closed," during the transition, the agent must fill out field A. NowWhy is the ability Customize Calls module so limited?
Why can't I add additional sections? why can't I add other field types than the very limited subset that zoho allows? Why can I only add fields to the outbound/inbound call sections and not to the Call Information section?Zoho Desk blank screen
opened a ticket from my email, zoho desk comes up blank, nothing loads. our receptionist also gets the same thing under her login on her computer. our sales rep also gets same thing on zoho desk at his home on a different computer. I tried clearing cache/history/cookies,Optimum CRM setup for new B2B business
Can some advise the most common way to setup Zoho CRM to handle sales for a B2B company? Specifically in how to handle inbound/outbound emails. I have spent hours researching online and can't seem to find an accepted approach, or even a tutorial. I havefilter on sheets mobile (iOS, iPadOS) does not work
I have this issue on every spreadsheet, whether imported or created natively in Zoho Sheets. I can use on desktop without issue: desktop screenshot on iOS the filter dropdowns are not there and there is no way to add them mobile iPadOS looks the same【Zoho CRM】商談タブへのデータインポート
Zoho使用前にエクセルで管理していた商談情報を、Zoho一括管理のため、商談タブにインポートしたいのですが、お客さまの氏名だけが紐づけられませんでした。 「Zoho CRMにインポートする項目を関連付ける」のところが画像のようになっています。 (弊社では、「姓」を「★個人データ名」という項目名に変更し、フルネームを入れて使用しています。) どのようにしたら氏名をインポートできるかご存じの方がいらっしゃいましたら、ご教示いただきたく、よろしくお願いいたします。 (投稿先が間違っていましたらご指Canva Integration
Hello! As many marketing departments are streamlining their teams, many have begun utilizing Canva for all design mockups and approvals prior to its integration into Marketing automation software. While Zoho Social has this integration already accomplished,Can't edit Segments
Happening with 2 different Zoho One environments, in different browsers. Please fix.Zoho Sheet for Desktop
Does Zoho plans to develop a Desktop version of Sheet that installs on the computer like was done with Writer?Transfer ownership of files and folders in My Folders
People work together as a team to achieve organizational goals and objectives. In an organization, there may be situations when someone leaves unexpectedly or is no longer available. This can put their team in a difficult position, especially if thereNext Page