Visualize your data with a new set of charts: Treemap, Butterfly, Sankey, and Cluster charts in Zoho CRM
Dear customers,
When it comes to analytics, it's not just about the numbers; it's about understanding the story behind them.
With that philosophy in mind, we’re excited to introduce a line of representations to the existing array of chart types in Zoho CRM: Treemap, butterfly, sankey and cluster charts. Let's go!
Treemaps
Treemap charts are used to visually represent hierarchical datasets in a rectangular layout. It aligns its parent categories as larger tiles with their sub-categories nested within them. The size of each tile is proportional to its corresponding value, making it easy to compare different segments within the hierarchy.
This is how a treemap chart looks:

These structured data representations help you understand overall performance and contributions, as well as compare participating entities at a glance.
Unlike traditional bar charts or pie charts, treemaps can be used if your datasets are large and exhibit parent-child relationships.
Here are some examples to better understand their usage:
Comparing revenue distribution between functions
A company's revenue is distributed among its functions before it gets further disbursed to its employees. Treemap charts can be used to depict this distribution and compare it between functions. As you can see below, the hierarchy can be represented as a treemap to compare it directly with other functions:

The hierarchy at the top shows just the numbers and levels, but the treemap chart represents the numbers proportionally, allowing leaders to visualize the difference in distribution.
Interpretation: As you can easily see in the treemap, sales and marketing receive the same amount of revenue, while engineering is given significantly more than the other two.
Likewise, with treemap charts, you can:
- Compare popular lead sources with lead counts is the measure and lead source being the participating entity—a classic single-grouping configuration.
- View cost savings achieved across departments. With the departments as the grouping parameters and the cost saved as the measured amount, the chart lays out all the departments as tiles in proportion, based on money saved.
- Compare ad spends across channels, where channels are the parent grouping and ad spend is the measured unit.
Butterfly
Butterfly charts are used to compare two related datasets side-by-side, resulting in a representation that looks like a butterfly or tornado.
Now, how does it differ from bar charts?
The standard bar chart can compare two entities for a given measure. Say, you are comparing the performance of Mary and Charles. The two users' data is represented using bars, and the length will denote their performances. But, when it comes to comparing their performances over a period or their contribution across different stages, a bar chart is not sufficient.


With butterfly charts, you can:
- Compare revenue between two of your branches each month. With branches being compared for sum of sales revenue, grouped by closing date.
- Compare the performance of two reps in a given quarter. Compared between two users for average of amount of deals, grouped by closing date until today.
In addition to the user-based comparison above, butterfly charts are well-suited to visualizing other types of data comparisons, like:
- Picklist-based comparisons
- Duration-based comparisons
- Aggregate-based comparisons
Business scenario
Comparing the number of deals closed for each lead sources: Duration-based comparison
You can identify the productive lead source by comparing the number of deal closures for every lead source in your organization based on their closing week.

Analyzing effective sales methodology, inbound vs. outbound: Picklist-based comparison
Businesses use both inbound and outbound lead generation strategies, and each of these methods can reap different results based on the season and occasion. By comparing inbound versus outbound each month, you can identify which works best at what time.

Analyze the amount versus the expected revenue between accounts: Aggregate-based comparison
Expected revenue is a result of a deal's progression in the sales pipeline. Comparing the amount versus their expected revenue will not only help visualize the expected revenue of participating accounts but also indicate the accounts' stage in the sales pipeline.

Sankey
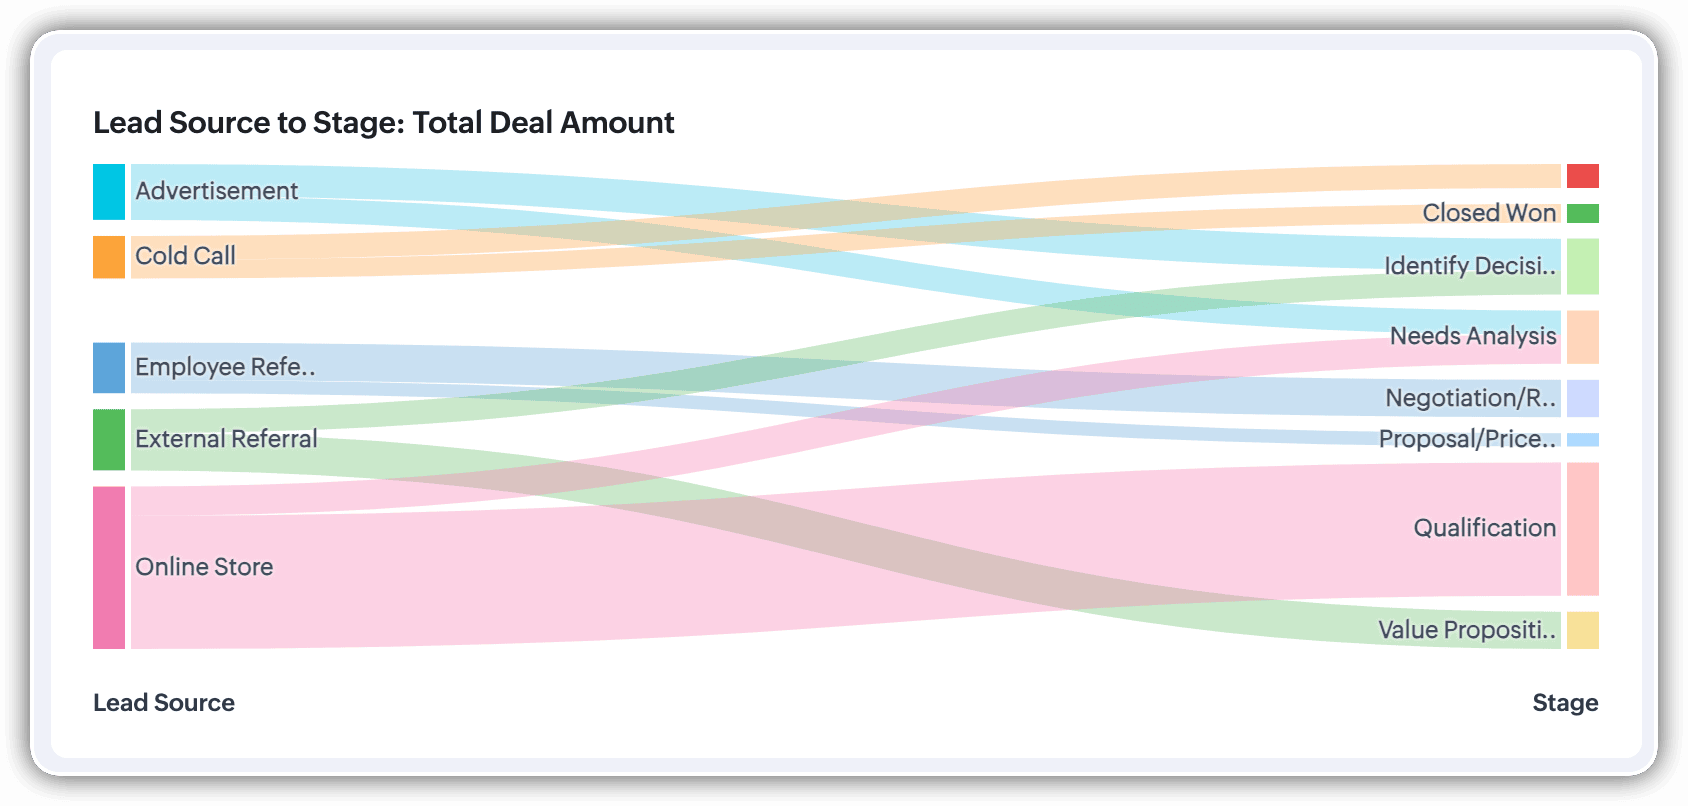
A Sankey Chart is designed to visualize the movement of data across different data groups. Unlike traditional charts—such as bar, column, pie, or donut—that mainly provide a static distribution of values, the Sankey Chart focuses on illustrating the flow between multiple segments or grouping fields. This makes it an ideal choice when you want to track how values (like lead counts, revenue, or deal statuses) move from one category to the next.

Key features
- Flow visualization: With the Sankey Chart, you can observe the movement of data between different groups.
- Multiple grouping fields: This chart works best when you have at least two grouping fields. You can go even further and add a third grouping to see an even more detailed mapping of your data flow.
- Simple configuration: The configuration for the Sankey Chart is as simple as any other chart type in Analytics.
Business scenarios:
Imagine you’re a sales manager trying to get a better handle on your team’s performance and your company’s pipeline. You want to understand not just how many deals are coming in, but also which sources are contributing the most value—and how those deals are progressing through different sales stages.
Let’s say you want to understand which lead sources are driving the most deal activity and how those deals progress through the pipeline. You can create a Sankey chart that maps the count of deals from Lead Source to Stage.

After analyzing the chart, you might notice that Online Store brings in a high volume of early-stage deals, while sources like External Referral contribute fewer deals that are more likely to reach advanced stages like Proposal or Negotiation.
This insight helps you prioritize nurturing the most profitable channels.
Sankey charts can also be helpful in other operational scenarios where understanding transitions across stages or teams is essential:
- Regional revenue distribution: Visualize how revenue flows across different regions, product categories, and their corresponding annual revenue. This helps you compare which regions contribute the most to each product line and where your high-value segments lie.
- Ticket handling flow: Visualize the flow of support tickets from their origin channel to internal departments and finally to resolution statuses. This can reveal workload imbalances or common points of delay in your support process.
Cluster
A cluster chart is similar to stacked column charts, but instead of stacking horizontally, the data is represented as vertical bars. As you create a column chart with multiple groupings, you can change the type of column chart to a cluster chart to achieve this representation.

In the above image, you can see the stacked column chart compares the number of lead conversions based on popular sources between countries. The stacks appearing on top of existing stacks ask you to calibrate the record count (y-axis) based on the previous stacks, which can lead to inaccurate interpretations. In this case, a cluster representation will paint a clearer picture of the analyses.
Other minor enhancements:
In addition to the three charts we mentioned above, we've also made the following minor changes:
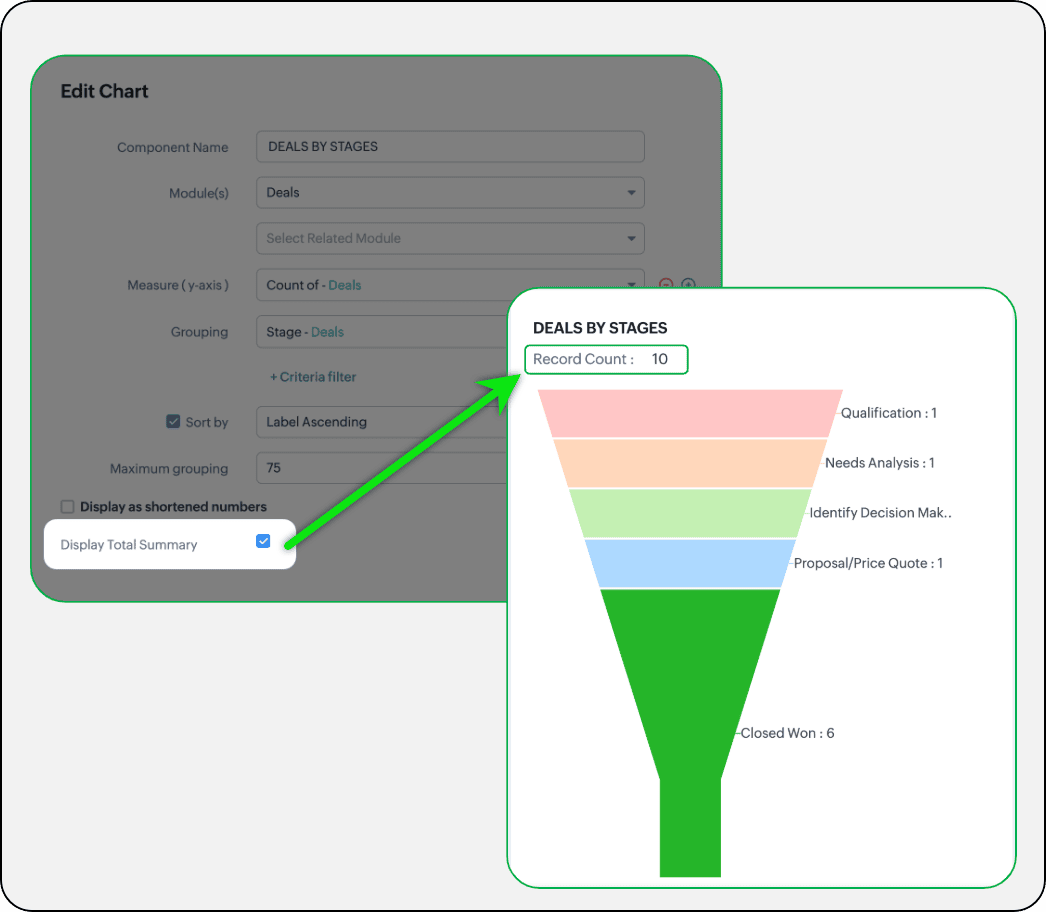
- Display total summary: Thus far, for all charts, each participating measure included labels. Now, to better understand overall contributions, a check box to display the total summary is provided under More options on the Chart Configuration page. Based on the configuration, the total revenue or the rolled-up quantities will be prominently displayed.
- Merge Y-axis: For charts that use two y-axis measurements, the intention is to view the progression of one entity against these two measures. Despite the scale, if the y-axis on the left is disproportionate to the values of the y-axis on the right, the plotted graph will result in a graphically and logically incorrect representation.
As you can see in the image below, the plot area of the sum of amount bar and the sum of expected revenue aligns close together, while, the difference between $700,000 and $40,500 is drastic, creating inaccurate interpretations.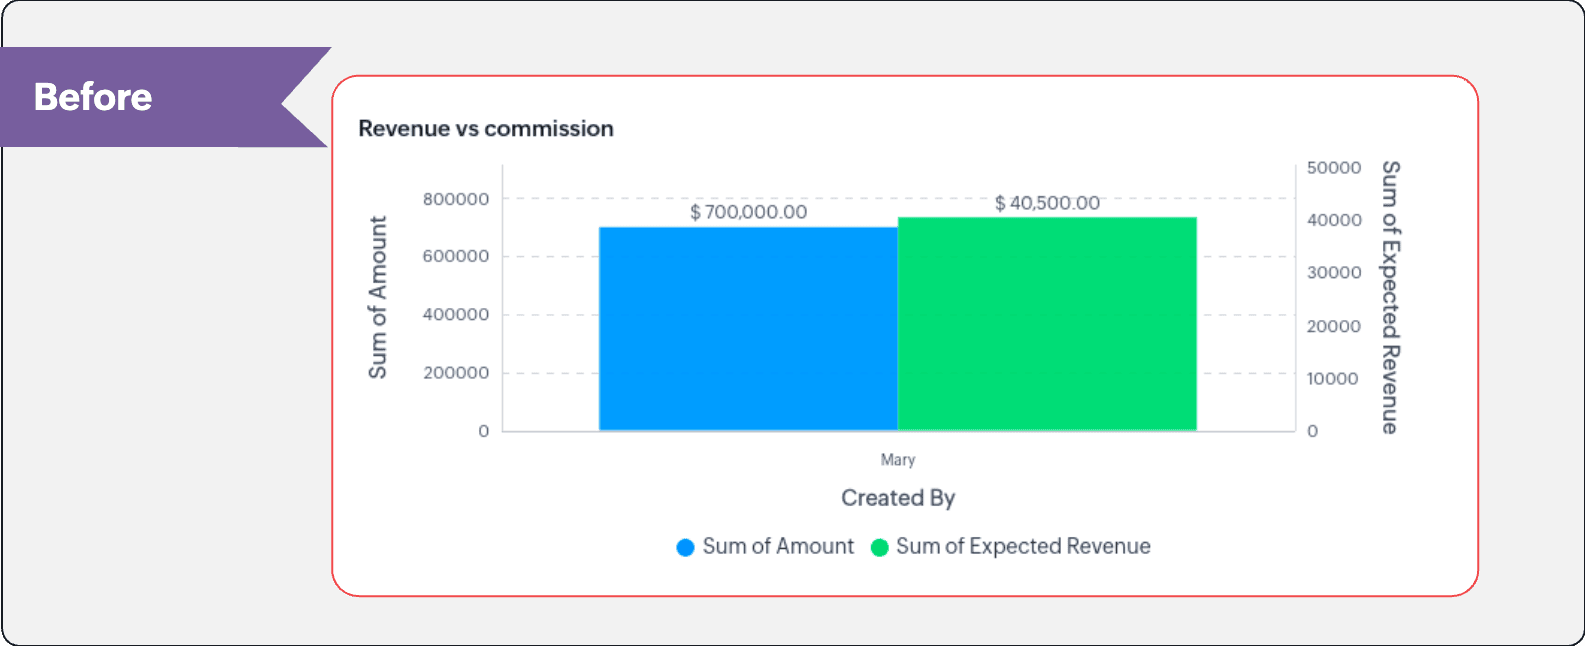
In this enhancement, we're allowing neighboring values of measures to merge so that the interpretation can be more visually accurate.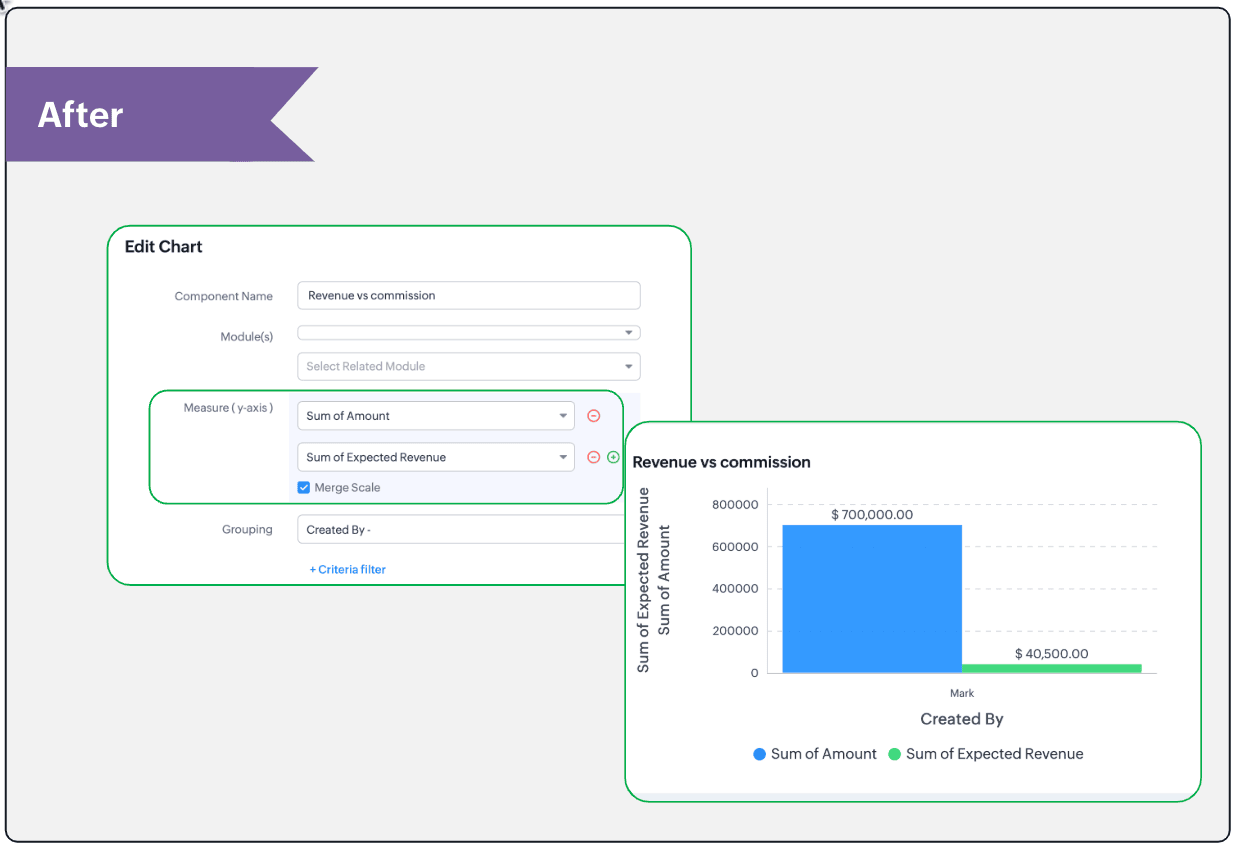
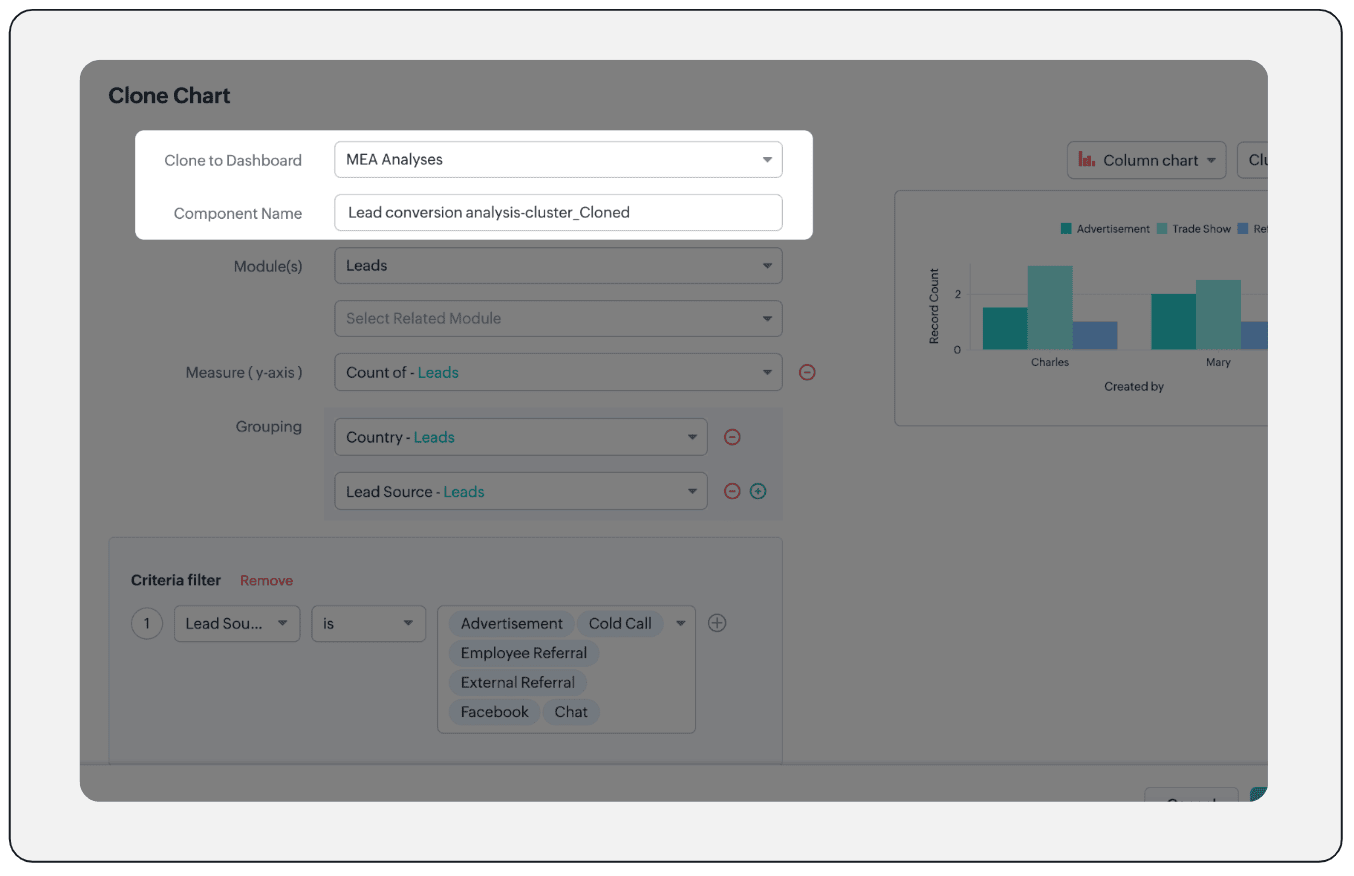
- Clone components to a different dashboard: Dashboards in Analytics serve in unique ways for various audiences—there can be separate dashboards for the sales team, marketing team, engineering team, and so on, and the chances of using the same measure for reference is common. Thus, when you clone a chart, you can now determine the target dashboard in which the cloned chart can be placed.
Resource: Help document
Thanks and have a good one!
Kind regards,
Saranya Balasubramanian
Saranya Balasubramanian
Topic Participants
Saranya Balasubramanian
Sticky Posts
Good news! Calendar in Zoho CRM gets a face lift
Dear Customers, We are delighted to unveil the revamped calendar UI in Zoho CRM. With a complete visual overhaul aligned with CRM for Everyone, the calendar now offers a more intuitive and flexible scheduling experience. What’s new? Distinguish activitiesTwo new enhancements in Zoho CRM: Introducing new criteria for user fields and displaying group information in users page
Announcement moderated on 14th June, 2023. Dear All, These enhancements are opened for all users in all DCs. ------------------------------------------------------------------------------------- Dear All, Hope you're well! We are here with two usefulNimble enhancements to WhatsApp for Business integration in Zoho CRM: Enjoy context and clarity in business messaging
Dear Customers, We hope you're well! WhatsApp for business is a renowned business messaging platform that takes your business closer to your customers; it gives your business the power of personalized outreach. Using the WhatsApp for Business integrationPresenting ABM for Zoho CRM: Expand and retain your customers with precision
Picture this scenario: You're a growing SaaS company ready to launch a powerful business suite, and are looking to gain traction and momentum. But as a business with a tight budget, you know acquiring new customers is slow, expensive, and often deliversConsumers are talking about your business. Are you listening?👂
A loyal customer might be praising your product in a forum. A frustrated user could be posting a harsh review on a public site. An excited partner may have left a comment on your campaign. A domain expert might be deconstructing your product. A prospect
Recent Topics
How to unlink a SAML user from the existing Zoho Desk user (domain change case)
Hi everyone, I’m trying to understand how to handle a situation where a customer changes their company domain. In our setup, users authenticate via SAML, so when the domain changes, the SAML system treats them as a new user. However, in Zoho Desk, I’dAnnouncing new features in Trident for Mac (1.29.0)
Hello everyone! Trident for macOS (v1.29.0) is here with new features and enhancements to enhance your business communication. Let's take a quick look at them. Access shared mailboxes. You can now view and access shared mailboxes in Trident, which areBooks is extremely slow again today !
Everything is running slowly even with 500mb connection speedCyclic dependencies in many-to-many relationships...
I have an application which includes a form for companies, and a form for contacts. Each company can be assigned 1 technical and 1 administrative contact. I have this working okay so far, but I want to copy the scripts used so far to a new empty application. When I import the scripts it fails with a message that says: Problem encountered while creating the application Error in resolving form dependency:Cyclic dependency among the forms:[Company, Contact] What can I do to resolve this? After all,Zoho Workdrive for Office, "vsto runtime not found"
Hi all, I have been trying to get ZohoWorkdrive_MS-addin_1.4.exe installed, but I keep getting the error "VSTO Runtime Not Found!" - even though I have installed it ... Anyone else hear had problems with the MS addin? FYI, I am using O365 on A Dell laptop running Win 10 Home - fully patched and up-to-date. I have tried compatibility modes and running explicitly as Administrator - the usual steps. Any advice would be appreciated.Using a CRM Client Script Button to create a Books Invoice
Hello, I need help handling error messages returned to my client script from a function. The scenario I have setup a client script button which is available from each Deal. This CS executes a crm function, which in turn creates an invoice based on theZoho API to create ticket
I'm developing an integration to create tickets via API, but, locally it works (send and recieve requests). In production it also works sending requests, but, my file don't recieve any response data. My URL is available in Zoho API Console and I haveAutomate Timesheet Approvals with Multi-level Approval Rules
Introducing Approval Rules for Timesheets in Zoho Projects. With this automation, teams can manage how timesheets are reviewed and approved by setting up rules with criteria and assigning approvers to handle submissions. Timesheet, when associated toZia’s AI Assist now helps you write clearer notes — in seconds
After helping recruiters craft job descriptions, emails, and assessments, Zia’s AI Assist is now stepping in to make note-taking effortless too. Whether you’re recording feedback after an interview or sharing quick updates with your team, you can nowBuilding toppings #1 - Serving your needs with Bigin toppings
Hey Biginners! We're excited to kick off our Developer Community series on building toppings for Bigin, and our goal is to provide an accessible, beginner-friendly, and relevant path for every developer. Imagine creating tiny pieces of software that unlockCan we create Sprint with tasks from Multiple projects?
Hi Team, We were using Zoho Sprints for quite sometime. Currently we have started the process of Sprint method. We couldnt create the active sprint board with the tasks from multiple projects. I would like to know whether this is possible or Any timelineCan we handle a support like (incident management) project in Zoho Projects?
Hi, I have a new profile of a project whereby we provide "ticket" base support to a client. They have a request and ideally we would handle comms via a email exchange logged in Zoho. Today we use Zoho Projects for all out projects, which means that weTip of the Week #74– Create automated workflows in MS Power Automate
Zoho TeamInbox now connects directly with Microsoft Power Automate, letting you streamline everyday routines tasks such as from sending emails to managing threads, with automated workflows. About the integration Zoho TeamInbox integrates with MicrosoftAccount validation
Hello everyone, I registered my account on ZeptoMail to use the system, but the problem is that the verification period on Zepto's end has already passed and I have limited functionality.Paste issues in ZOHO crm notes
Hi, since a week or so I have issues with the paste function in ZOHO CRM. I use "notes" to copy paste texts from Outlook emails and since a week or so, the pasting doesnt function as it should: some text just disappears and it gives a lot of empty lines/enters.....Is it possible to add a gradient color to a newsletter im designing?
From where i sit it looks like you can only choose a single color but not combine 2 colors?New Feature: Audit Log in Zoho Bookings
Greetings from the Zoho Bookings team! We’re excited to introduce Audit Log, a new feature designed to help you track all key actions related to your appointments. With Audit Log, you can maintain transparency, strengthen security, and ensure accountability.Custom validation in CRM schema
Validation rules in CRM layouts work nicely, good docs by @Kiran Karthik P https://help.zoho.com/portal/en/kb/crm/customize-crm-account/validation-rules/articles/create-validation-rules I'd prefer validating data input 'closer to the schema'Customised Funnel
We are running the standard plan for our ZOHO CRM. I have been asked if there is a way to combine data from the Calls module, Deals module and Contact Module into 1 funnel, similar to the view you can get when viewing Deals By Stages, you can see theHow to restrict user/portal user change canvas view
Hi , I would like to restrict user / portal user change their canvas view because I hide some sensitive field for them. I dont want my user switch the canvas view that do not belong to them But seems Zoho do not provide this setting?Good news! Calendar in Zoho CRM gets a face lift
Dear Customers, We are delighted to unveil the revamped calendar UI in Zoho CRM. With a complete visual overhaul aligned with CRM for Everyone, the calendar now offers a more intuitive and flexible scheduling experience. What’s new? Distinguish activitiesAccount disabled
I have an issue I need help with. Whilst trialing ZOHO CRM I created the following: Account1 (-------------) using m__ame@m__rg___s__i__.___.__ and 2 personal emails Account2 (-------------) using a personal email and 2 users _al__1@______________._o_.__Blocked Email
We are a Zoho One subscriber and use Yahoo as our MX provider. A few times each year, for the past four years, CRM blocks one or more of my Zoho One users from receiving internal email from CRM. This includes "@mentions" in all modules, and emails frommessage var is empty in bot mention handler
Hi, I'm encountering a problem: in my bot's mention handler, I want to retrieve the text the user typed when mentioning the bot. Example: On the #tests-cyril channel, I send this message: “@Donna hello how are you ?” I expect the system variable "message"Develop Zoho Meeting as a Full Native Application (Not a Browser Wrapper)
Hello Zoho Meeting Team, Hope you are doing well. We would like to suggest an important improvement regarding the Zoho Meeting desktop application. At the moment, the Zoho Meeting app feels more like a mini browser window or an iframe that loads the webEnhancements to Zoho Meeting Annotator
Hello Zoho Meeting Team, Hope you are doing well. We would like to share a few improvement suggestions regarding the Zoho Meeting Annotator used during screen sharing. While the current version provides helpful annotation tools, there are several limitationsRemembrance Day to Remember – Recalling Values
The phrase “at the eleventh hour” refers to the 11th hour of the 11th day of the 11th month in 1918, when the hostilities of World War I came to an end—but it still holds meaning today. Remembrance Day (Veterans Day in the US) is observed on NovemberEnhancing Zia's service with better contextual responses and article generation
Hello everyone, We are enhancing Zia's Generative AI service to make your support experience smarter. Here's how: Increased accuracy with Qwen One of the key challenges in AI is delivering responses that are both contextually accurate and empathetic whileHow to display two measures (sales and price) divided by categories on one line chart
Hi everyone, I’m having trouble figuring out how to display two columns on a line chart with category breakdowns. What I need is a line chart where one line represents Sales and the other represents Price. However, the Price data is divided into aroundCreate custom rollup summary fields in Zoho CRM
Hello everyone, In Zoho CRM, rollup summary fields have been essential tools for summarizing data across related records and enabling users to gain quick insights without having to jump across modules. Previously, only predefined summary functions wereIntroducing the locking option for CRM records
Last modified on 06/04/2023: Record locking option in CRM is now available for all Zoho CRM users in all DCs. Note that it was an early access feature available only upon request. Hello All, Hope you're doing well! We're thrilled to introduce our latestTwo new enhancements in Zoho CRM: Introducing new criteria for user fields and displaying group information in users page
Announcement moderated on 14th June, 2023. Dear All, These enhancements are opened for all users in all DCs. ------------------------------------------------------------------------------------- Dear All, Hope you're well! We are here with two usefulTip #49- Navigating the Remote Support Dashboard in Zoho Assist- 'Insider Insights'
The Remote Support dashboard in Zoho Assist is designed to help technicians quickly access, manage, and monitor all their support sessions from a single, intuitive interface. Whether you’re starting a new session, managing ongoing connections, or reviewingBMI formula
I've been trying for hours to calculate BMI using height and weight as my only inputs. It's a simple calculation and I even went to ChatGPT to help me figure this out in Zoho Forms, but it led me down a path of "try this" and "try this". None of my attemptsSEO on blogs
Hello, google is not able to find my blogs. Can you advice me if I need to change some settings or anything else to make it retrievable via SEO many thanks, hansDuplicated Notebooks
Out of the blue, almost all of my notebooks got duplicated and the different copies contain different information. Some seem like older copies than the others. I use the linux desktop app and sometimes the Android app. I assume that the sync failed at some point and was unable to merge the two versions together. But I'm afraid to add anything else to my notebook because if it can't properly sync 5 notebooks with only a handful of notes each, what will happen when I have hundreds of notes and I loseSamsung Keyboard Issues with Notebook
Dear Users, We're sorry to inform you that some of our users are experiencing certain issues like scrolling, delay/lag, cursor placement especially within the text notes. This occurs mainly due to Samsung Keyboard compatibility with Android 13 and someMind mapping in Zoho Projects
Good morning, I would like to congratulate the Zoho team for building such an inovative and responsive application that fits in the daily challenges of so many work groups. I would like suggest you another functionality that helps a lot in project planning and development: mind mapping. Mind mapping would be of great help for brianstorming, knowledge management and other needs in online collaboration. Thanks and wish you all the best! George Maha Empresa Júnior Multidisciplinar do Instituto deTrying to show the actual Terms & Conditions on PDF
Hi, On Zoho forms I am trying to have the actual terms and conditions that the user needs to accept also show on the pdf that they receive after. Right now it only says "Agreed". Please help.Retainer invoice in Zoho Finance modlue
Hello, Is there a way of creating retainer invoices in the Zoho Finance module? If not can I request this is considered for future updates please.Next Page