Visualize your data with a new set of charts: Treemap, Butterfly, Sankey, and Cluster charts in Zoho CRM
Dear customers,
When it comes to analytics, it's not just about the numbers; it's about understanding the story behind them.
With that philosophy in mind, we’re excited to introduce a line of representations to the existing array of chart types in Zoho CRM: Treemap, butterfly, sankey and cluster charts. Let's go!
Treemaps
Treemap charts are used to visually represent hierarchical datasets in a rectangular layout. It aligns its parent categories as larger tiles with their sub-categories nested within them. The size of each tile is proportional to its corresponding value, making it easy to compare different segments within the hierarchy.
This is how a treemap chart looks:

These structured data representations help you understand overall performance and contributions, as well as compare participating entities at a glance.
Unlike traditional bar charts or pie charts, treemaps can be used if your datasets are large and exhibit parent-child relationships.
Here are some examples to better understand their usage:
Comparing revenue distribution between functions
A company's revenue is distributed among its functions before it gets further disbursed to its employees. Treemap charts can be used to depict this distribution and compare it between functions. As you can see below, the hierarchy can be represented as a treemap to compare it directly with other functions:

The hierarchy at the top shows just the numbers and levels, but the treemap chart represents the numbers proportionally, allowing leaders to visualize the difference in distribution.
Interpretation: As you can easily see in the treemap, sales and marketing receive the same amount of revenue, while engineering is given significantly more than the other two.
Likewise, with treemap charts, you can:
- Compare popular lead sources with lead counts is the measure and lead source being the participating entity—a classic single-grouping configuration.
- View cost savings achieved across departments. With the departments as the grouping parameters and the cost saved as the measured amount, the chart lays out all the departments as tiles in proportion, based on money saved.
- Compare ad spends across channels, where channels are the parent grouping and ad spend is the measured unit.
Butterfly
Butterfly charts are used to compare two related datasets side-by-side, resulting in a representation that looks like a butterfly or tornado.
Now, how does it differ from bar charts?
The standard bar chart can compare two entities for a given measure. Say, you are comparing the performance of Mary and Charles. The two users' data is represented using bars, and the length will denote their performances. But, when it comes to comparing their performances over a period or their contribution across different stages, a bar chart is not sufficient.


With butterfly charts, you can:
- Compare revenue between two of your branches each month. With branches being compared for sum of sales revenue, grouped by closing date.
- Compare the performance of two reps in a given quarter. Compared between two users for average of amount of deals, grouped by closing date until today.
In addition to the user-based comparison above, butterfly charts are well-suited to visualizing other types of data comparisons, like:
- Picklist-based comparisons
- Duration-based comparisons
- Aggregate-based comparisons
Business scenario
Comparing the number of deals closed for each lead sources: Duration-based comparison
You can identify the productive lead source by comparing the number of deal closures for every lead source in your organization based on their closing week.

Analyzing effective sales methodology, inbound vs. outbound: Picklist-based comparison
Businesses use both inbound and outbound lead generation strategies, and each of these methods can reap different results based on the season and occasion. By comparing inbound versus outbound each month, you can identify which works best at what time.

Analyze the amount versus the expected revenue between accounts: Aggregate-based comparison
Expected revenue is a result of a deal's progression in the sales pipeline. Comparing the amount versus their expected revenue will not only help visualize the expected revenue of participating accounts but also indicate the accounts' stage in the sales pipeline.

Sankey
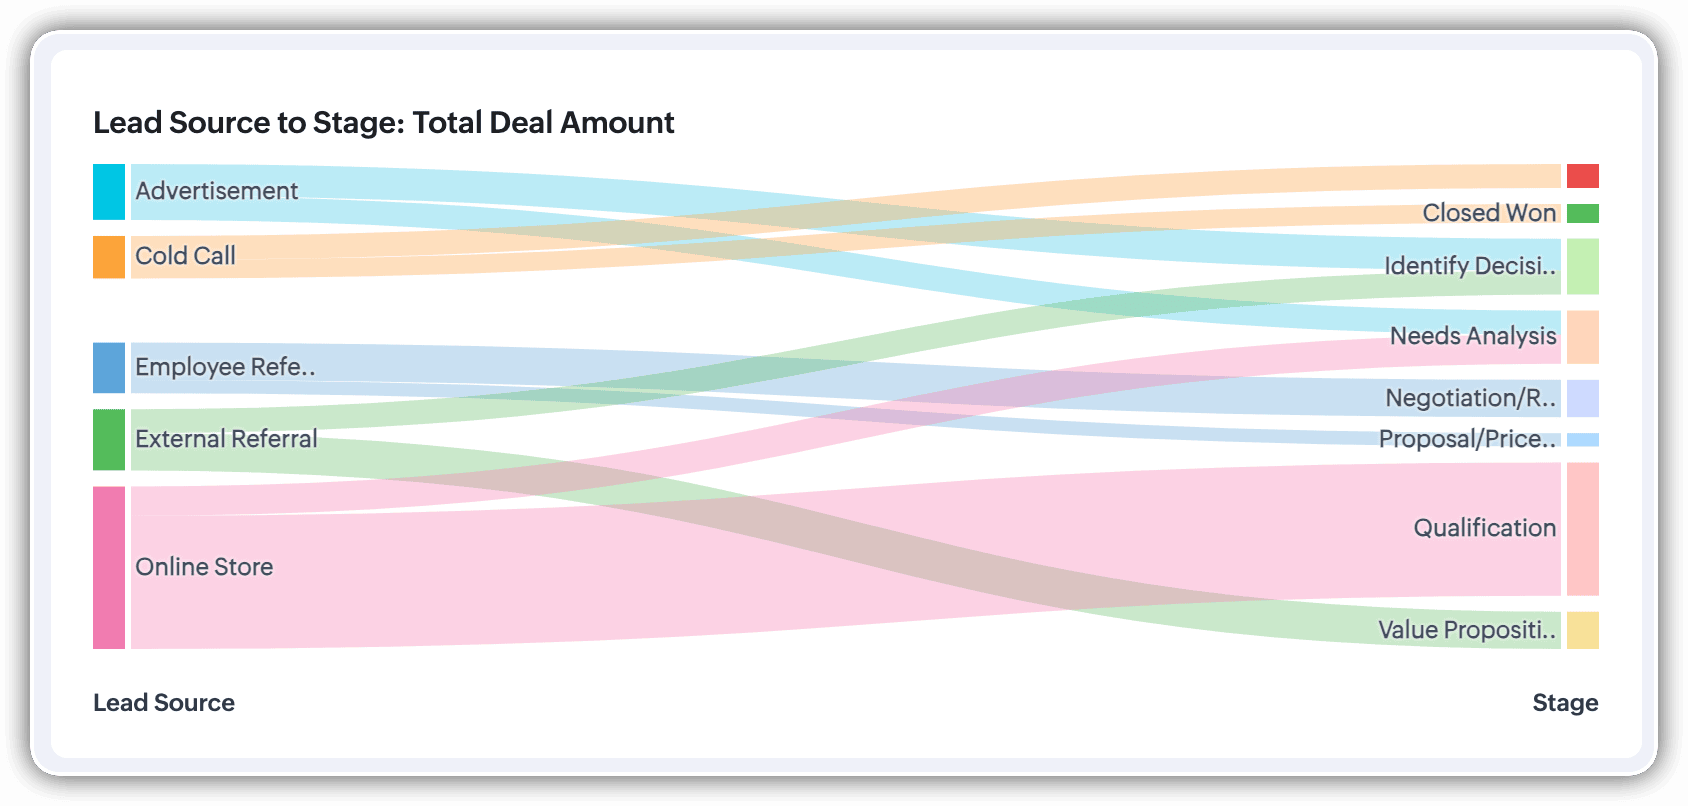
A Sankey Chart is designed to visualize the movement of data across different data groups. Unlike traditional charts—such as bar, column, pie, or donut—that mainly provide a static distribution of values, the Sankey Chart focuses on illustrating the flow between multiple segments or grouping fields. This makes it an ideal choice when you want to track how values (like lead counts, revenue, or deal statuses) move from one category to the next.

Key features
- Flow visualization: With the Sankey Chart, you can observe the movement of data between different groups.
- Multiple grouping fields: This chart works best when you have at least two grouping fields. You can go even further and add a third grouping to see an even more detailed mapping of your data flow.
- Simple configuration: The configuration for the Sankey Chart is as simple as any other chart type in Analytics.
Business scenarios:
Imagine you’re a sales manager trying to get a better handle on your team’s performance and your company’s pipeline. You want to understand not just how many deals are coming in, but also which sources are contributing the most value—and how those deals are progressing through different sales stages.
Let’s say you want to understand which lead sources are driving the most deal activity and how those deals progress through the pipeline. You can create a Sankey chart that maps the count of deals from Lead Source to Stage.

After analyzing the chart, you might notice that Online Store brings in a high volume of early-stage deals, while sources like External Referral contribute fewer deals that are more likely to reach advanced stages like Proposal or Negotiation.
This insight helps you prioritize nurturing the most profitable channels.
Sankey charts can also be helpful in other operational scenarios where understanding transitions across stages or teams is essential:
- Regional revenue distribution: Visualize how revenue flows across different regions, product categories, and their corresponding annual revenue. This helps you compare which regions contribute the most to each product line and where your high-value segments lie.
- Ticket handling flow: Visualize the flow of support tickets from their origin channel to internal departments and finally to resolution statuses. This can reveal workload imbalances or common points of delay in your support process.
Cluster
A cluster chart is similar to stacked column charts, but instead of stacking horizontally, the data is represented as vertical bars. As you create a column chart with multiple groupings, you can change the type of column chart to a cluster chart to achieve this representation.

In the above image, you can see the stacked column chart compares the number of lead conversions based on popular sources between countries. The stacks appearing on top of existing stacks ask you to calibrate the record count (y-axis) based on the previous stacks, which can lead to inaccurate interpretations. In this case, a cluster representation will paint a clearer picture of the analyses.
Other minor enhancements:
In addition to the three charts we mentioned above, we've also made the following minor changes:
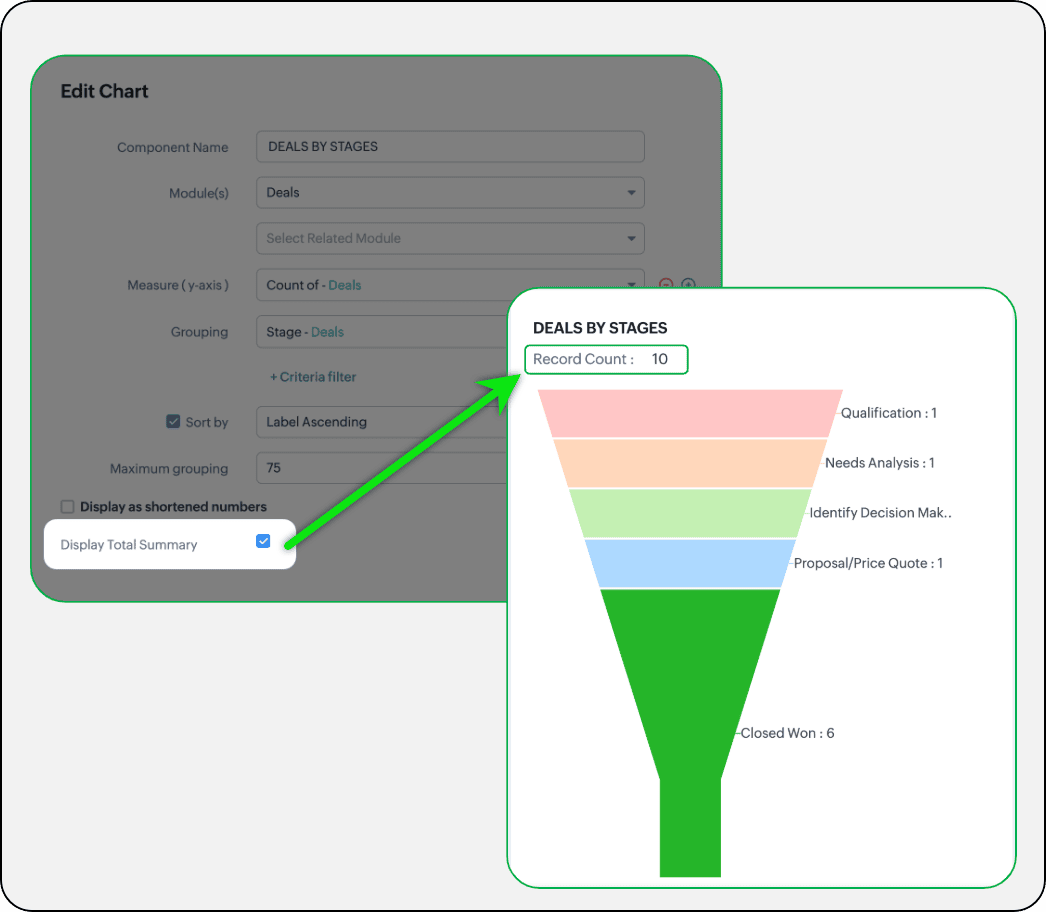
- Display total summary: Thus far, for all charts, each participating measure included labels. Now, to better understand overall contributions, a check box to display the total summary is provided under More options on the Chart Configuration page. Based on the configuration, the total revenue or the rolled-up quantities will be prominently displayed.
- Merge Y-axis: For charts that use two y-axis measurements, the intention is to view the progression of one entity against these two measures. Despite the scale, if the y-axis on the left is disproportionate to the values of the y-axis on the right, the plotted graph will result in a graphically and logically incorrect representation.
As you can see in the image below, the plot area of the sum of amount bar and the sum of expected revenue aligns close together, while, the difference between $700,000 and $40,500 is drastic, creating inaccurate interpretations.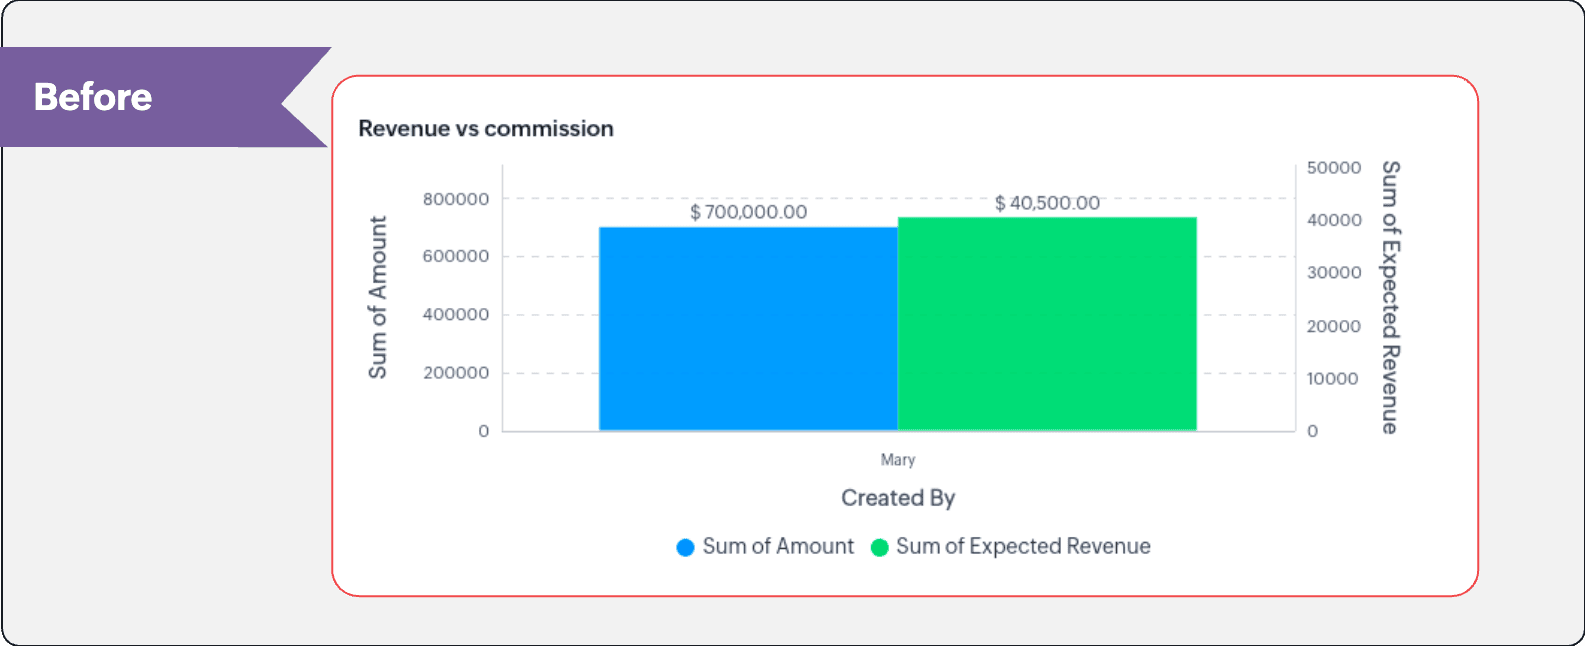
In this enhancement, we're allowing neighboring values of measures to merge so that the interpretation can be more visually accurate.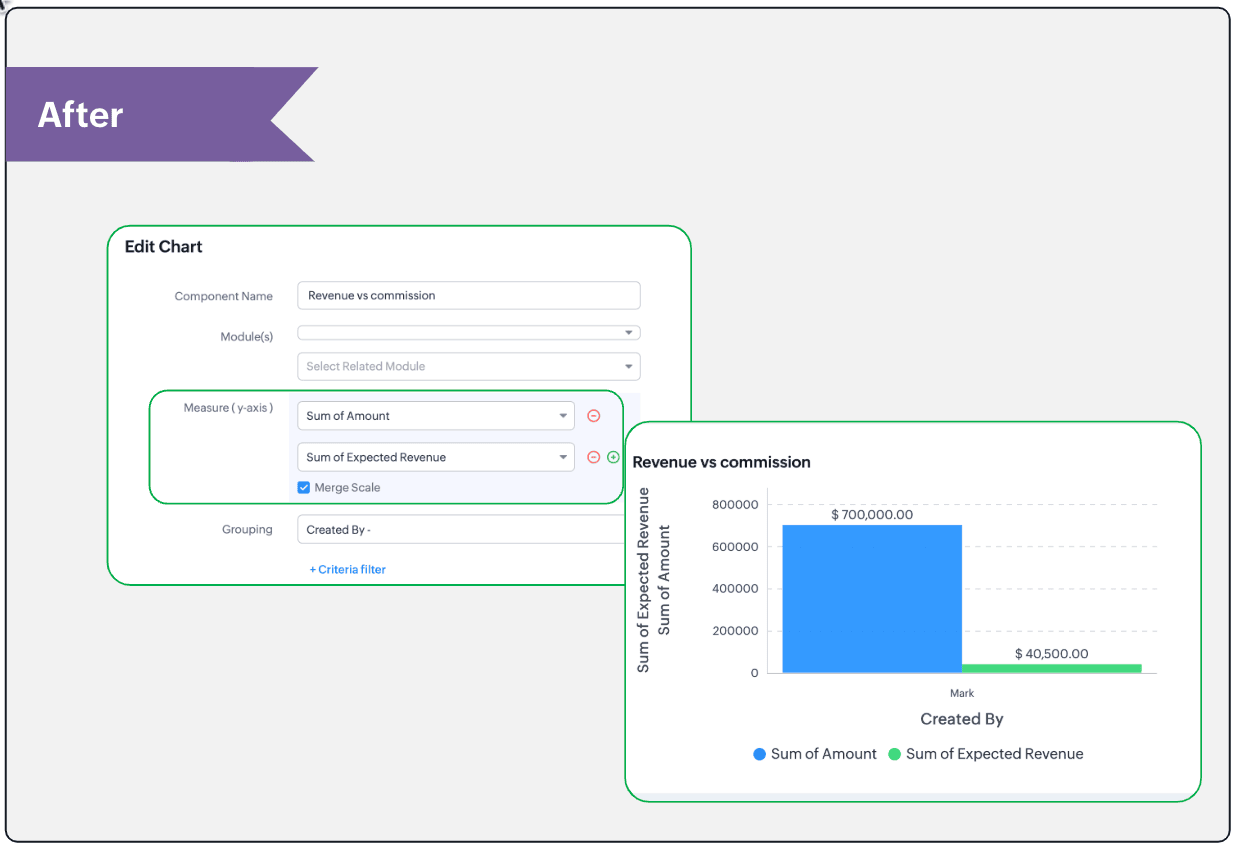
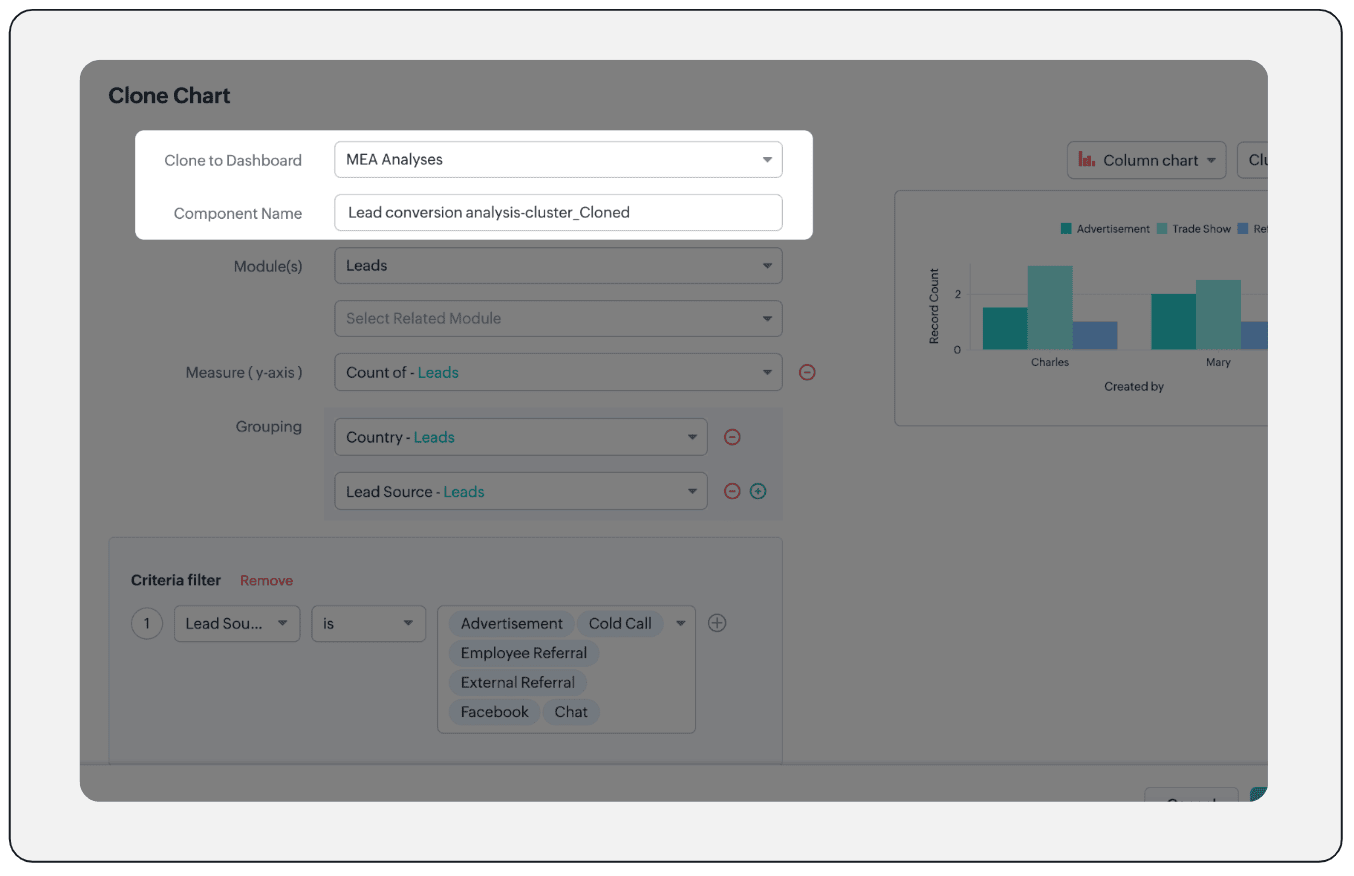
- Clone components to a different dashboard: Dashboards in Analytics serve in unique ways for various audiences—there can be separate dashboards for the sales team, marketing team, engineering team, and so on, and the chances of using the same measure for reference is common. Thus, when you clone a chart, you can now determine the target dashboard in which the cloned chart can be placed.
Resource: Help document
Thanks and have a good one!
Kind regards,
Saranya Balasubramanian
Saranya Balasubramanian
Topic Participants
Saranya Balasubramanian
Sticky Posts
Enhancements to the formula field in Zoho CRM: Auto-refresh formulas with the "Now" function, stop formula executions based on criteria, and include formulas within formulas
Dear Customers, We hope you're well! By their nature, modern businesses rely every day on computations, whether it's to calculate the price of a product, assess ROI, evaluate the lifetime value of a customer, or even determine the age of a record. WithElevate your CX delivery using CommandCenter 2.0: Simplified builder; seamless orchestration
Most businesses want to create memorable customer experiences—but they often find it hard to keep them smooth, especially as they grow. To achieve a state of flow across their processes, teams often stitch together a series of automations using WorkflowPresenting ABM for Zoho CRM: Expand and retain your customers with precision
Picture this scenario: You're a growing SaaS company ready to launch a powerful business suite, and are looking to gain traction and momentum. But as a business with a tight budget, you know acquiring new customers is slow, expensive, and often deliversNimble enhancements to WhatsApp for Business integration in Zoho CRM: Enjoy context and clarity in business messaging
Dear Customers, We hope you're well! WhatsApp for business is a renowned business messaging platform that takes your business closer to your customers; it gives your business the power of personalized outreach. Using the WhatsApp for Business integrationZoho CRM: Sales Rep Professional Certification Program on Coursera
We are happy to share that we have published the Zoho Sales Representative Professional Certificate in partnership with Coursera, a leading platform for online learning and career development that offers access to courses and degrees from leading universities
Recent Topics
Gantt for 2 or more projects
Hello, I'm trying the free version of your produtc. It is veryyy good!!!! I don't know if in the Standard plan, I can overview a Gantt Graph for 2 or more Projects Milestone. This would be very helpfull for managing teams and taking decisions about who I will assign a task to. In the paid plan Do I have this possibility? Thank you.Integrating a Zoho Project Gantt Chart into Reports
Is is possible to integrate a Zoho Project Gantt Chart into a Zoho Report Dashboard. I am in the process of creating Project Status Dashboards for the projects that we track in Zoho Projects and I would like to incorporate the gantt chart within Reports. Please let me know! ThanksZOHO BOOKS - EXCESSIVELY SLOW TODAY
Dear Zoho Books This is not the first time but it seems to be 3 times per week now that the system is extremely slow. I work on Zoho Books 95% of my day so this is very frustrating. Zoho you need to do something about this. I have had my IT guy checkGantt Chart - Zoho Analytics
Are there any plans to add Gantt Charts capabilities to Zoho Analytics?Displaying related quotes in sales order and back
Hi, My colleague liked to see to which sales orders, the quote has been converted. Quote shows Invoices, but not SO. Same, they would like to see the quotes in the sales order, as they can see invoices, packages, shipment, How can we achieve this ? ThankTip of the Week #71–Auto-move incoming messages to the right inboxes with keywords
We all know that customer-facing teams, especially your sales and support teams, can’t afford to miss even a single customer conversation. But sometimes, sales queries or support requests can easily get lost in a crowded inbox or even end up in the wrongClearing Fields using MACROS?
How would I go about clearing a follow-up field date from my deals? Currently I cannot set the new value as an empty box.Migrating a Zoho Forms form into Zoho Creator
Hi, How can I migrate my Zoho Forms form into Zoho Creator? Thanks. Truly, EmadIs there any way to recall an email sent using Zoho CRM?
If an email is sent using Zoho Mail, there is a recall option/functionality that is available to the sender. Is there any way to recall an email if it was sent using Zoho CRM? I can't seem to find that option. Any help would be appreciated.Quick Create needs Client Script support
As per the title. We need client scripts to apply at a Quick Create level. We enforce logic on the form to ensure data quality, automate field values, etc. However, all this is lost when a user attempts a "Quick Create". It is disappointing because, fromProblem with reports due to "Connected" items change - Yes this IS a problem
Now that the change has been made to use "connected" items I can no longer run the reporting I need in CRM. I should be able to start with Deals as the parent, connect down to the Account (Account_Name) on the deal as the child, then to any child itemsIntroducing notifications in the vendor portal
Imagine this: You're a recruiter working with multiple vendors on a high-volume hiring project. You’ve just updated a job description after a last-minute change from the hiring manager. One of your vendors, however, is still working off the older versionCRM limit reached: only 2 subforms can be created
we recently stumbled upon a limit of 2 subforms per module. while we found a workaround on this occasion, only 2 subforms can be quite limiting in an enterprise setting. @Ishwarya SG I've read about imminent increase of other components (e.LESS_THAN_MIN_OCCURANCE - code 2945
Hi I'm trying to post a customer record to creator API and getting this error message. So cryptic. Can someone please help? Thanks VarunHow to update "Lead Status" to more than 100 records
Hello Zoho CRM, How do I update "Lead Status" to more than 100 records at once? To give you a background, these leads were uploaded or Imported at once but the lead status record was incorrectly chosen. So since there was a way to quickly add records in the system no matter how many they are, we are also wondering if there is a quicker way to update these records to the correct "Lead Status". I hope our concern makes sense and that there will be a fix for it. All the best, JonathanAnalytics for notes created
Is there a way I can see how many notes were created per day? Via reporting or analytics?No TDS Deduction
In some of our case, where we are reselling items at the same rate we purchased. In this scenario, Indian IT Law has a provision to request customer not to deduct TDS if the transaction value is same. TDS is paid by us (intermediary reseller) before weCannot update Recurring_Activity on Tasks – RRULE not accepted
Hello, I am trying to update Tasks in Zoho CRM to make them recurring yearly, but I cannot find the correct recurrence pattern or way to update the Recurring_Activity field via API or Deluge. I have tried: Sending a string like "RRULE:FREQ=YEARLY;INTERVAL=1"Add image to report...
Greetings, I send a weekly color coded report via Creator email. I would like to add the legend somewhere in the report. Header, footer where ever. I have the legend saved on Google Drive and can access it via shared link. Sure someone has wanted to addMore controls for User Fields in CRM
Dear All, We are here with a minor but crucial enhancement to the user fields—now set accessibility permissions to the records for user field. User field allows you to extend co-ownership of records to your peers. You can collaborate with them for certainCalls to accounts rather than leads or contacts?
So..... We have a dilemma and I'm hoping someone has encountered this before and figured out a fix. We have just migrated to Zoho. It's great.....expect for how "Calls" are handled.... We are B2B. We do not use the leads module. A "Lead/Prospect" forImage Upload Field | Zoho Canvas
I'm working on making a custom view for one of our team's modules. It's an image upload field (Placement Photo) that would allow our sales reps to upload a picture of the house their working on. However, I don't see that field as a opinion when buildingPower of Automation :: Automated 'Delayed & Closed' Status Update Based on Due Date
Hello Everyone, A custom function is a software code that can be used to automate a process and this allows you to automate a notification, call a webhook, or perform logic immediately after a workflow rule is triggered. This feature helps to automateLead Blueprint transition in custom list view
Hi, Is It possible to insert the Blueprint transition label in a custom Canvas list view? I am using Lead module. I see the status, but it would be great if our users could execute the Blueprint right from the list view without having to enter the detailedRange names in Zoho Sheet are BROKEN!
Hi - you've pushed an update that has broken range names. A previously working spreadsheet now returns errors because the range names are not updating the values correctly. I've shared a video with the support desk to illustrate the problem. This spreadsheetpopulate email address and name in zoho desk?
Is it possible to populate the email address and name in the zoho desk widget? We only use it in the context of an authenticated user, so we already know the user's name and email. Thanks,Are there default/pre-built dashboards in Zoho Desk?
Hi, I am looking for some pre-built dashboard templates in Zoho Desk, similar to what we can find in CRM/Projects, etc Thank youSAP S/4 HANA to CRM Integration - change the SAP Client ID
Hi I am trying to push the business partners from SAP S/4 HANA to ZOHO CRM module. The SAP Client ID is 421 in my case....kindly let me know how do I specify the sap client because it's a dropdown with specific values as of now. Thanks Ravi AswaniStaff rules
Hi! Do you people know what are the default staff rules when a new booking is created? We have two staff members in my team (me as the admin, and my employee). As we share the same services, I'm wondering how Zoho will pick the staff for new apointments.Adding branded signature to tickets reply
Hi, i am unable to figure out how to add signatures with logo to tickets reply. please advice .Zoho Marketing Automation 2.0 - Landing Page function not working
Dear Zoho Team, I am working on implementing Zoho Marketing Automation 2.0, and am now looking into the section "Lead Generation". If I open the "Landing Pages" section, I immediately get an Error code: Error: internal error occurred. Can you help meZoho Mail Android app update: Manage folders
Hello everyone! In the latest version(v2.9) of the Zoho Mail Android app update, we have brought in support for an option to manage folders. You can now create, edit, and delete folders from within the mobile app. You can also manage folders for the POPHow to share ticket numbers across different ticket types
I'm running an event and have three different ticket types. Add on Event + Main Event - Early bird Main Event only - Early bird Add on Event only - Early bird And Standard class - shown but not available until early bird finishes Add on Event + Main EventAdding Social Media Buttons to Basic Campaigns
Hi, I'm quote new to using Zoho Campaigns and I can't work out how to add Social Media Buttons into my basic campaign? In MailChimp there's a button that brings the icons into your campaign for you. I've tried adding the social media icons as 'buttons' in Zoho but it's not looking great. Can anyone help? Thanks!Hide Inactive Social Sign-In Providers from Login Screen
Hello Zoho Team, We hope you are doing well. Currently, Zoho One allows admins to configure security policies and enable or disable Social Sign-In options for third-party providers such as Apple, Google, Microsoft, LinkedIn, Yahoo, Twitter, Facebook,[Free Webinar] AI Agents in Zoho Creator - Creator Tech Connect
Hello Everyone! We welcome you all to the upcoming free webinar on the Creator Tech Connect Series. The Creator Tech Connect series is a free monthly webinar that runs for around 45 minutes. It comprises technical sessions in which we delve deep intoDownload All Attached Files
It would be extremely useful to have "download-all" functionality for downloading files attached to a task, subtask, comment, forum post or hosted in the "Documents" section etc. We've instructed our users to zip multiple files prior to uploading, but of course they forget all the time. Having to download lots of files one-at-a-time off a comment or task wastes a lot of time.unable to send message reason 554 5.1.8 Email outgoing blocked
unable to send message reason 554 5.1.8 Email outgoing blockedShip via Carrier Not Working Since Commerce Update
Since the recent update to the Commerce platform, I can no longer use the ship via carrier function. It will take me to the address screen and let me verify them but when I go to save and move tot he next screen it will not do anything. This is happeningautomations: Can I execute a step on a specific date?
I have created a form in Zoho forms, and created a contacts list. I have also begun setting up an automation with the intention of sending the form to the contact list on a specific date every month (via email) for the entire year (essentially sendingNext Page