Visualize your data with a new set of charts: Treemap, Butterfly, Sankey, and Cluster charts in Zoho CRM
Dear customers,
When it comes to analytics, it's not just about the numbers; it's about understanding the story behind them.
With that philosophy in mind, we’re excited to introduce a line of representations to the existing array of chart types in Zoho CRM: Treemap, butterfly, sankey and cluster charts. Let's go!
Treemaps
Treemap charts are used to visually represent hierarchical datasets in a rectangular layout. It aligns its parent categories as larger tiles with their sub-categories nested within them. The size of each tile is proportional to its corresponding value, making it easy to compare different segments within the hierarchy.
This is how a treemap chart looks:

These structured data representations help you understand overall performance and contributions, as well as compare participating entities at a glance.
Unlike traditional bar charts or pie charts, treemaps can be used if your datasets are large and exhibit parent-child relationships.
Here are some examples to better understand their usage:
Comparing revenue distribution between functions
A company's revenue is distributed among its functions before it gets further disbursed to its employees. Treemap charts can be used to depict this distribution and compare it between functions. As you can see below, the hierarchy can be represented as a treemap to compare it directly with other functions:

The hierarchy at the top shows just the numbers and levels, but the treemap chart represents the numbers proportionally, allowing leaders to visualize the difference in distribution.
Interpretation: As you can easily see in the treemap, sales and marketing receive the same amount of revenue, while engineering is given significantly more than the other two.
Likewise, with treemap charts, you can:
- Compare popular lead sources with lead counts is the measure and lead source being the participating entity—a classic single-grouping configuration.
- View cost savings achieved across departments. With the departments as the grouping parameters and the cost saved as the measured amount, the chart lays out all the departments as tiles in proportion, based on money saved.
- Compare ad spends across channels, where channels are the parent grouping and ad spend is the measured unit.
Butterfly
Butterfly charts are used to compare two related datasets side-by-side, resulting in a representation that looks like a butterfly or tornado.
Now, how does it differ from bar charts?
The standard bar chart can compare two entities for a given measure. Say, you are comparing the performance of Mary and Charles. The two users' data is represented using bars, and the length will denote their performances. But, when it comes to comparing their performances over a period or their contribution across different stages, a bar chart is not sufficient.


With butterfly charts, you can:
- Compare revenue between two of your branches each month. With branches being compared for sum of sales revenue, grouped by closing date.
- Compare the performance of two reps in a given quarter. Compared between two users for average of amount of deals, grouped by closing date until today.
In addition to the user-based comparison above, butterfly charts are well-suited to visualizing other types of data comparisons, like:
- Picklist-based comparisons
- Duration-based comparisons
- Aggregate-based comparisons
Business scenario
Comparing the number of deals closed for each lead sources: Duration-based comparison
You can identify the productive lead source by comparing the number of deal closures for every lead source in your organization based on their closing week.

Analyzing effective sales methodology, inbound vs. outbound: Picklist-based comparison
Businesses use both inbound and outbound lead generation strategies, and each of these methods can reap different results based on the season and occasion. By comparing inbound versus outbound each month, you can identify which works best at what time.

Analyze the amount versus the expected revenue between accounts: Aggregate-based comparison
Expected revenue is a result of a deal's progression in the sales pipeline. Comparing the amount versus their expected revenue will not only help visualize the expected revenue of participating accounts but also indicate the accounts' stage in the sales pipeline.

Sankey
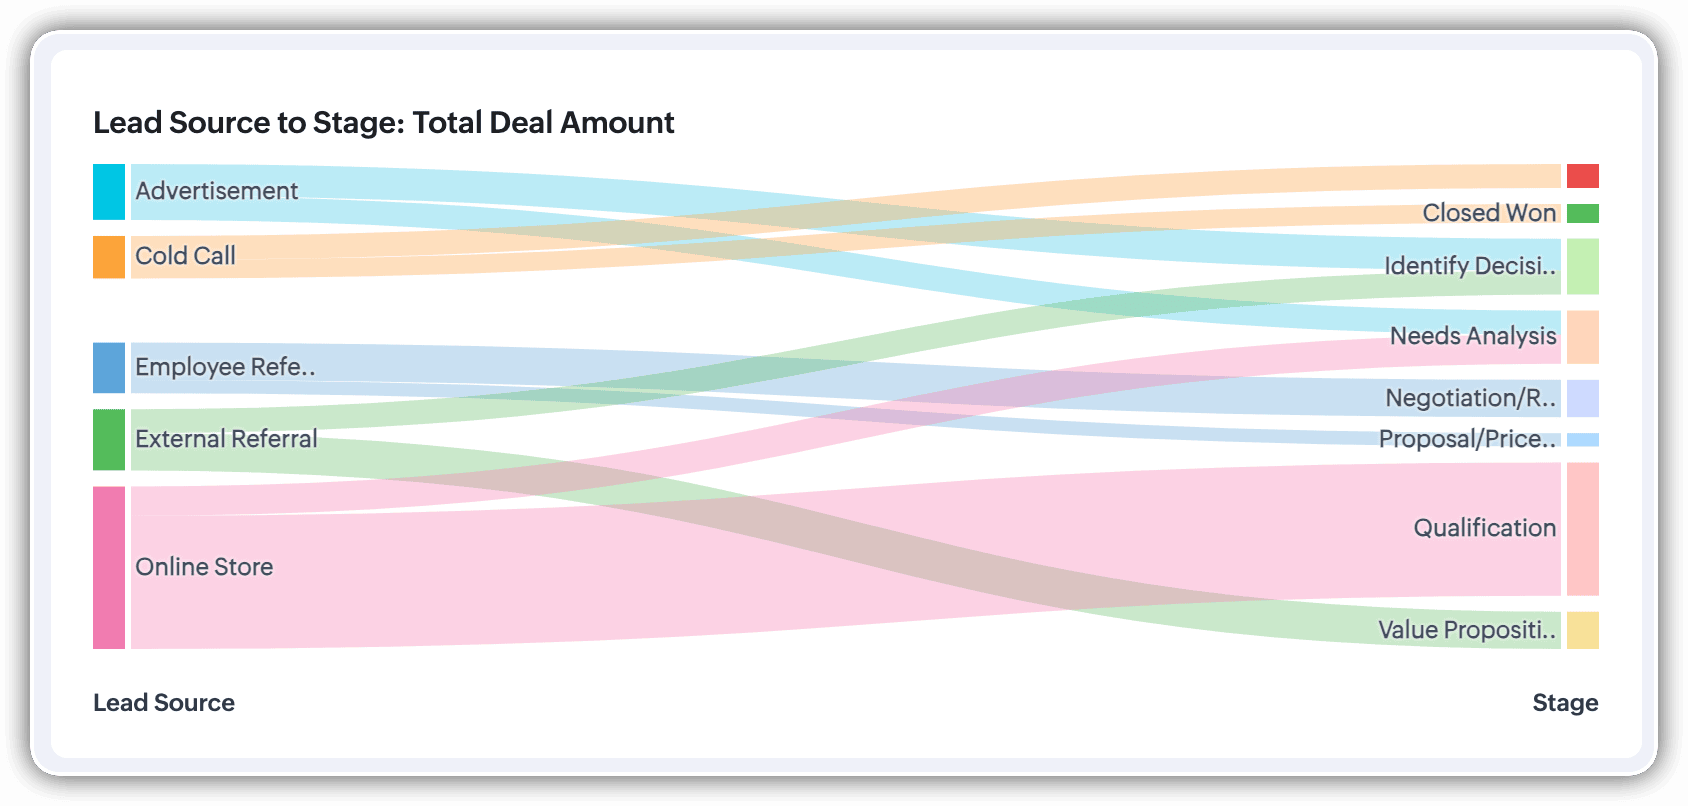
A Sankey Chart is designed to visualize the movement of data across different data groups. Unlike traditional charts—such as bar, column, pie, or donut—that mainly provide a static distribution of values, the Sankey Chart focuses on illustrating the flow between multiple segments or grouping fields. This makes it an ideal choice when you want to track how values (like lead counts, revenue, or deal statuses) move from one category to the next.

Key features
- Flow visualization: With the Sankey Chart, you can observe the movement of data between different groups.
- Multiple grouping fields: This chart works best when you have at least two grouping fields. You can go even further and add a third grouping to see an even more detailed mapping of your data flow.
- Simple configuration: The configuration for the Sankey Chart is as simple as any other chart type in Analytics.
Business scenarios:
Imagine you’re a sales manager trying to get a better handle on your team’s performance and your company’s pipeline. You want to understand not just how many deals are coming in, but also which sources are contributing the most value—and how those deals are progressing through different sales stages.
Let’s say you want to understand which lead sources are driving the most deal activity and how those deals progress through the pipeline. You can create a Sankey chart that maps the count of deals from Lead Source to Stage.

After analyzing the chart, you might notice that Online Store brings in a high volume of early-stage deals, while sources like External Referral contribute fewer deals that are more likely to reach advanced stages like Proposal or Negotiation.
This insight helps you prioritize nurturing the most profitable channels.
Sankey charts can also be helpful in other operational scenarios where understanding transitions across stages or teams is essential:
- Regional revenue distribution: Visualize how revenue flows across different regions, product categories, and their corresponding annual revenue. This helps you compare which regions contribute the most to each product line and where your high-value segments lie.
- Ticket handling flow: Visualize the flow of support tickets from their origin channel to internal departments and finally to resolution statuses. This can reveal workload imbalances or common points of delay in your support process.
Cluster
A cluster chart is similar to stacked column charts, but instead of stacking horizontally, the data is represented as vertical bars. As you create a column chart with multiple groupings, you can change the type of column chart to a cluster chart to achieve this representation.

In the above image, you can see the stacked column chart compares the number of lead conversions based on popular sources between countries. The stacks appearing on top of existing stacks ask you to calibrate the record count (y-axis) based on the previous stacks, which can lead to inaccurate interpretations. In this case, a cluster representation will paint a clearer picture of the analyses.
Other minor enhancements:
In addition to the three charts we mentioned above, we've also made the following minor changes:
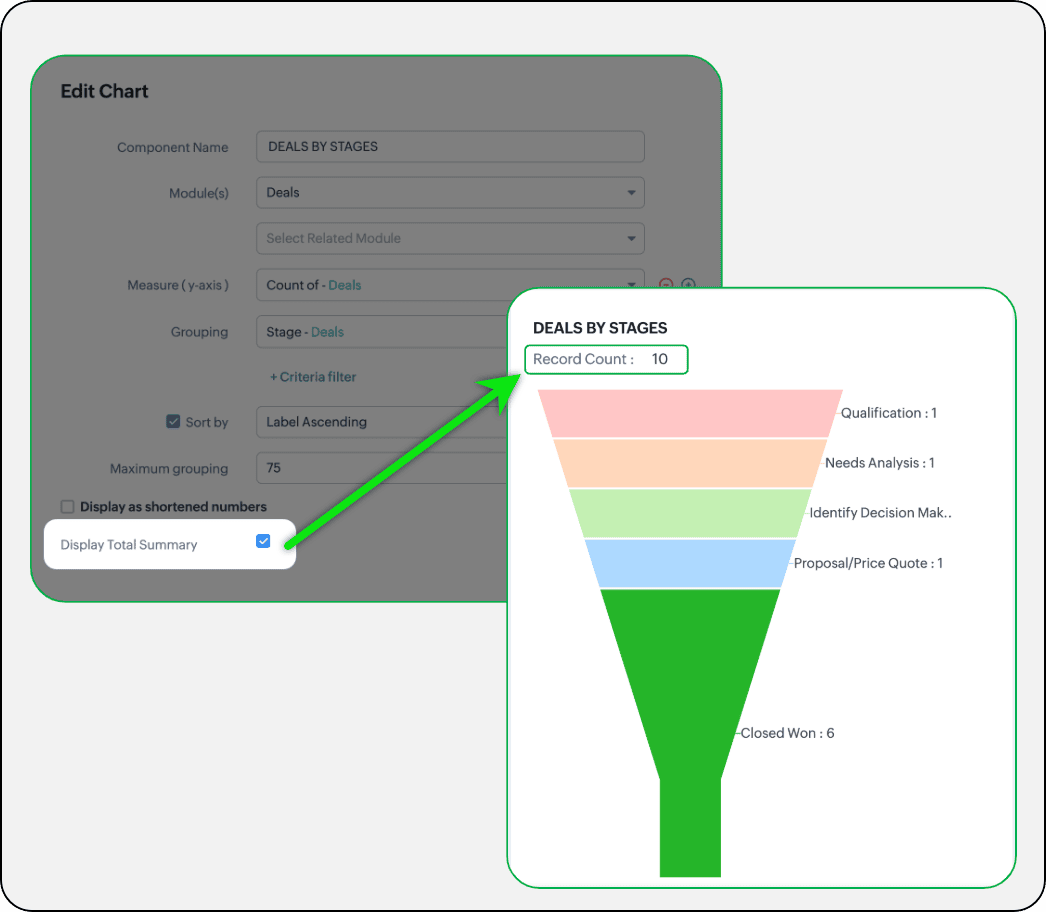
- Display total summary: Thus far, for all charts, each participating measure included labels. Now, to better understand overall contributions, a check box to display the total summary is provided under More options on the Chart Configuration page. Based on the configuration, the total revenue or the rolled-up quantities will be prominently displayed.
- Merge Y-axis: For charts that use two y-axis measurements, the intention is to view the progression of one entity against these two measures. Despite the scale, if the y-axis on the left is disproportionate to the values of the y-axis on the right, the plotted graph will result in a graphically and logically incorrect representation.
As you can see in the image below, the plot area of the sum of amount bar and the sum of expected revenue aligns close together, while, the difference between $700,000 and $40,500 is drastic, creating inaccurate interpretations.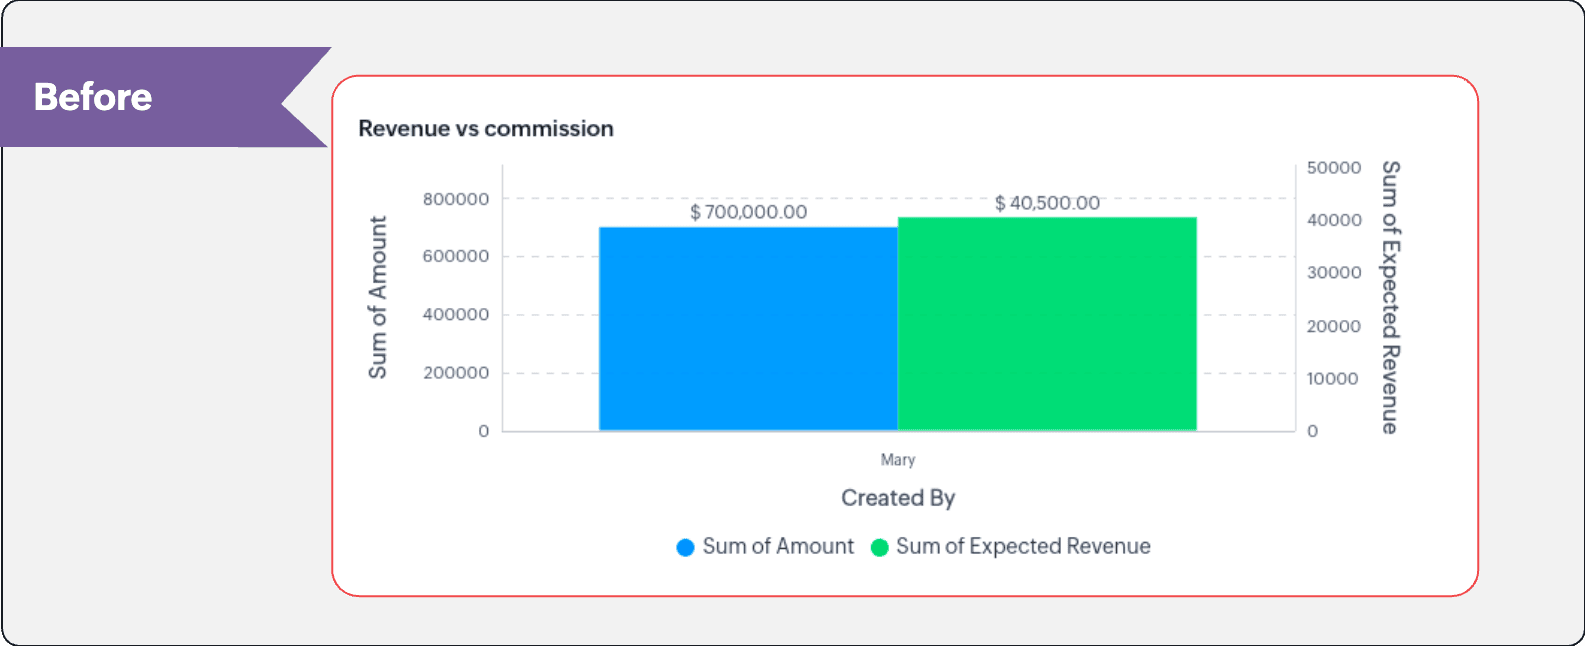
In this enhancement, we're allowing neighboring values of measures to merge so that the interpretation can be more visually accurate.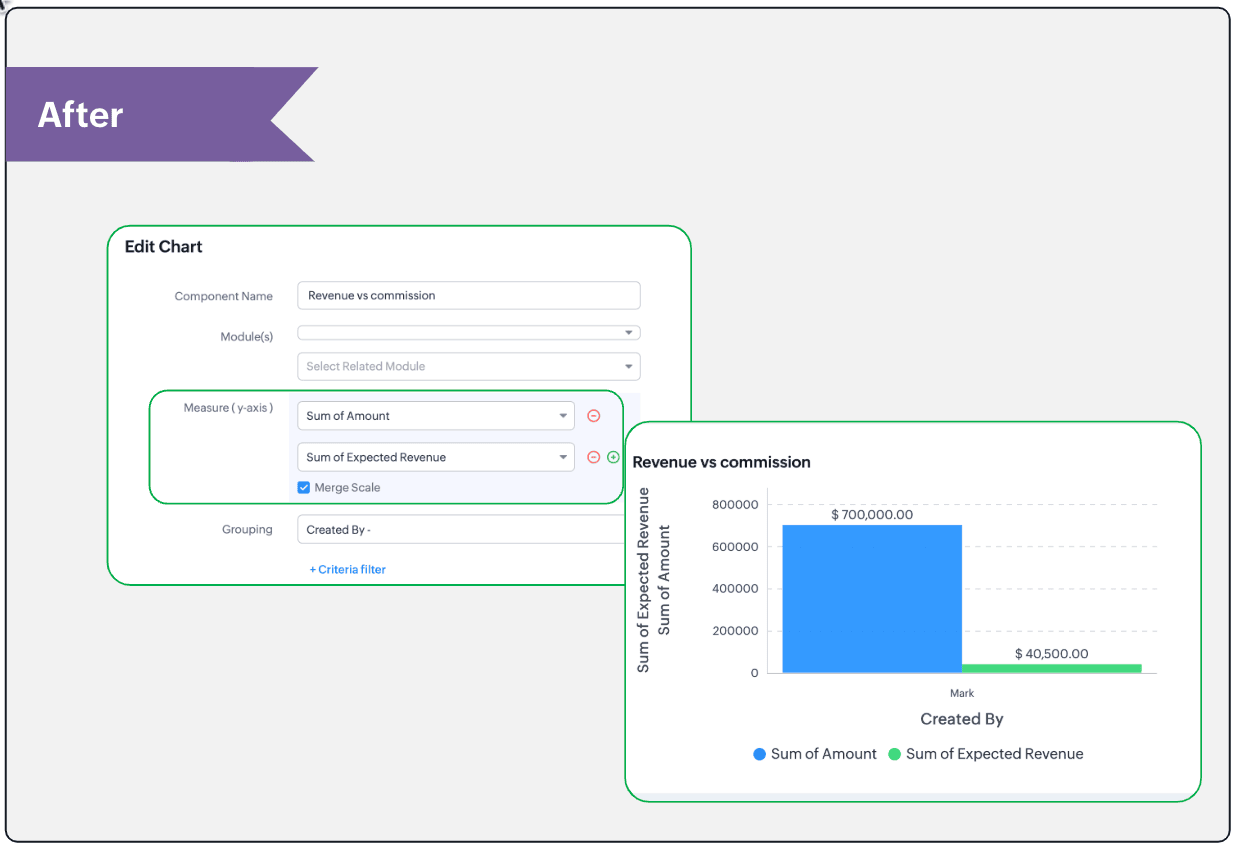
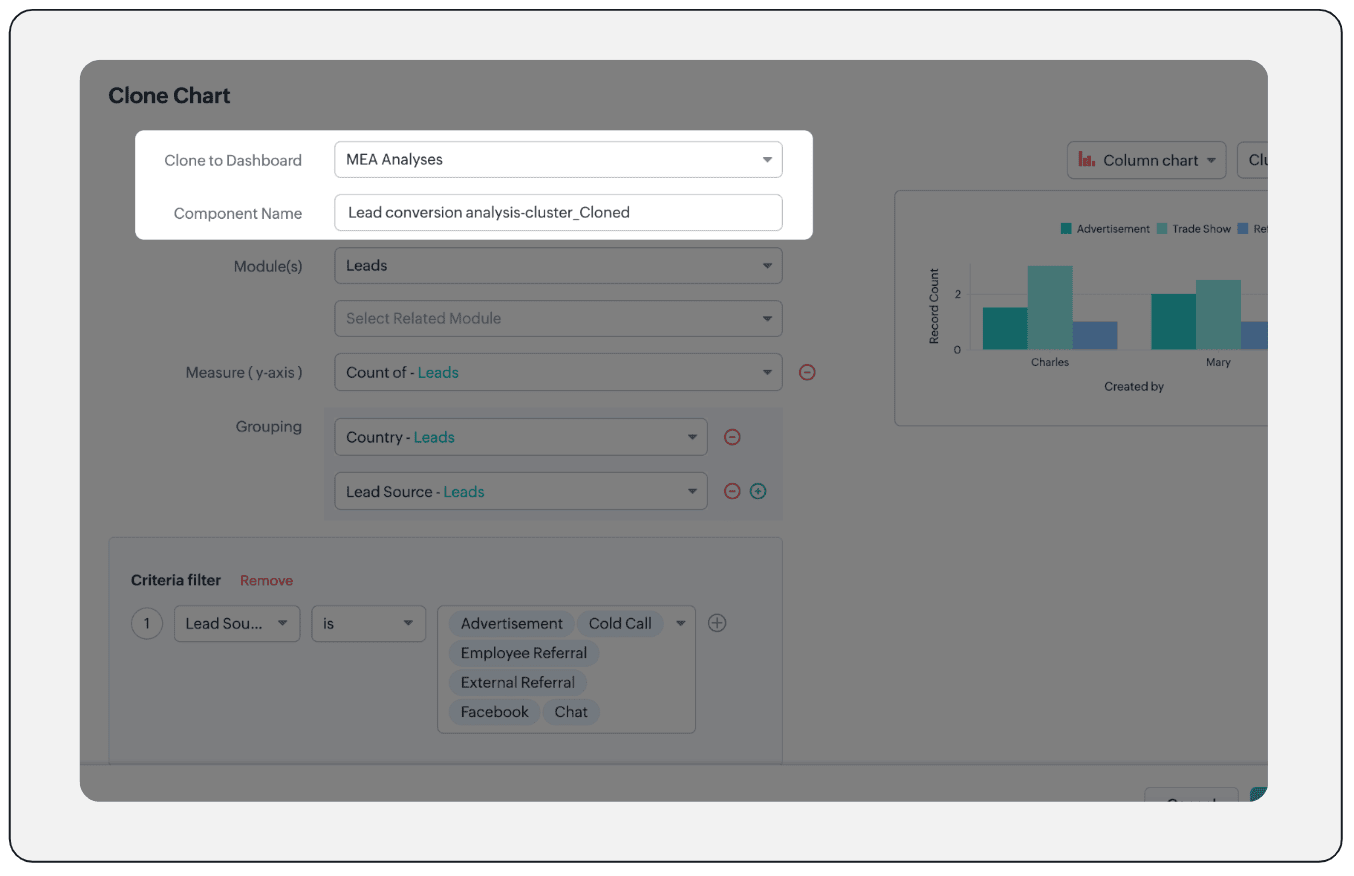
- Clone components to a different dashboard: Dashboards in Analytics serve in unique ways for various audiences—there can be separate dashboards for the sales team, marketing team, engineering team, and so on, and the chances of using the same measure for reference is common. Thus, when you clone a chart, you can now determine the target dashboard in which the cloned chart can be placed.
Resource: Help document
Thanks and have a good one!
Kind regards,
Saranya Balasubramanian
Saranya Balasubramanian
Topic Participants
Saranya Balasubramanian
Sticky Posts
Elevate your CX delivery using CommandCenter 2.0: Simplified builder; seamless orchestration
Most businesses want to create memorable customer experiences—but they often find it hard to keep them smooth, especially as they grow. To achieve a state of flow across their processes, teams often stitch together a series of automations using WorkflowPresenting ABM for Zoho CRM: Expand and retain your customers with precision
Picture this scenario: You're a growing SaaS company ready to launch a powerful business suite, and are looking to gain traction and momentum. But as a business with a tight budget, you know acquiring new customers is slow, expensive, and often deliversNimble enhancements to WhatsApp for Business integration in Zoho CRM: Enjoy context and clarity in business messaging
Dear Customers, We hope you're well! WhatsApp for business is a renowned business messaging platform that takes your business closer to your customers; it gives your business the power of personalized outreach. Using the WhatsApp for Business integrationZoho CRM: Sales Rep Professional Certification Program on Coursera
We are happy to share that we have published the Zoho Sales Representative Professional Certificate in partnership with Coursera, a leading platform for online learning and career development that offers access to courses and degrees from leading universitiesEnhancements to the formula field in Zoho CRM: Auto-refresh formulas with the "Now" function, stop formula executions based on criteria, and include formulas within formulas
Dear Customers, We hope you're well! By their nature, modern businesses rely every day on computations, whether it's to calculate the price of a product, assess ROI, evaluate the lifetime value of a customer, or even determine the age of a record. With
Recent Topics
Download an email template in html code
Hello everyone, I have created an email template and I want to download it as html. How can i do that? I know you can do it via the campaigns-first create a campaign add the template and download it as html from there. But what if i don't want to createAttachment is not included in e-mails sent through Wordpress
I have a Wordpress site with Zeptomail Wordpress plugin installed and configured. E-mails are sent ok through Zeptomail but without the included attachment (.pdf file) Zeptomail is used to send tickets to customers through Zeptomail. E-Mails are generatedUpcoming Changes to the Timesheet Module
The Timesheet module will undergo a significant change in the upcoming weeks. To start with, we will be renaming Timesheet module to Time Logs. This update will go live early next week. Significance of this change This change will facilitate our nextBest way to schedule bill payments to vendors
I've integrated Forte so that I can convert POs to bills and make payments to my vendors all through Books. Is there a way to schedule the bill payments as some of my vendors are net 30, net 60 and even net 90 days. If I can't get this to work, I'll haveCant update image field after uploading image to ZFS
Hello i recently made an application in zoho creator for customer service where customers could upload their complaints every field has been mapped from creator into crm and works fine except for the image upload field i have tried every method to makeBilling Management: #4 Negate Risk Free with Advances
In the last post, we explored how unbilled charges accumulate before being invoiced. But what happens when businesses need money before service begins? Picture this: A construction company takes on a $500,000 commercial building project expected to lastIs there an equivalent to the radius search in RECRUIT available in the CRM
We have a need to find all Leads and/or Contacts within a given radius of a given location (most likely postcode) but also possibly an address. I was wondering whether anyone has found a way to achieve this in the CRM much as the radius search in RECRUITZoho CRM Inventory Management
What’s the difference between Zoho CRM’s inventory management features and Zoho Inventory? When is it better to use each one?Cannot Enable Picklist Field Dependency in Products or Custom Modules – Real Estate Setup
Hello Zoho Support, I am configuring Zoho CRM for real estate property management and need picklist field dependency: What I’ve tried: I started by customizing the Products module (Setup > Modules & Fields) to create “Property Type” (Housing, Land, Commercial)Get Workflow Metadata via API
Is there a way to get metadata on workflows and/or custom functions via API? I would like to automatically pull this information. I couldn't find it in the documentations, but I'm curious if there is an undocumented endpoint that could do this. ModerationZoho Projects - Q2 Updates | 2025
Hello Users, With this year's second quarter behind us, Zoho Projects is marching towards expanding its usability with a user-centered, more collaborative, customizable, and automated attribute. But before we chart out plans for what’s next, it’s worthFSM setup
So we have been tinkering with FSM to see if it is going to be for us. Now is the time to bite the bullet and link it to our zoho books and zoho crm. The help guides are good but it would really help if they were a bit more in depth on the intergrations.Upcoming Updates to the Employees Module in Zoho Payroll (US)
We've made a couple of updates to the Employees module in Zoho Payroll (latest version of the US edition). These changes will go live today. While creating an employee Currently, the Compensation Details section is part of the Basic Details step, wherePossible to Turn Off Automatic Notifications for Approvals?
Hello, This is another question regarding the approval process. First a bit of background: Each of our accounts is assigned a rank based on potential sales. In Zoho, the account rank field is a drop-down with the 5 rank levels and is located on the accountZOHO Creator subform link
Dear Community Support, I am looking for some guidance on how to add a clickable link within a Zoho Creator subform. The goal is for this link to redirect users to another Creator form where they can edit the data related to the specific row they clickedAllow Resource to Accept or Reject an Appointment
I have heard that this can be done, is there any documentation on how?Create new Account with contact
Hi I can create a new Account and, as part of that process, add a primary contact (First name, last name) and Email. But THIS contact does NOT appear in Contacts. How can I make sure the Contact added when creating an Account is also listed as a Contact?Custom Fonts in Zoho CRM Template Builder
Hi, I am currently creating a new template for our quotes using the Zoho CRM template builder. However, I noticed that there is no option to add custom fonts to the template builder. It would greatly enhance the flexibility and branding capabilities ifPython - code studio
Hi, I see the code studio is "coming soon". We have some files that will require some more complex transformation, is this feature far off? It appears to have been released in Zoho Analytics alreadySync desktop folders instantly with WorkDrive TrueSync (Beta)
Keeping your important files backed up and accessible has never been easier! With WorkDrive desktop app (TrueSync), you can now automatically sync specific desktop folders to WorkDrive Web, ensuring seamless, real-time updates across devices. Important:How To Insert Data into Zoho CRM Organization
Hi Team I have this organization - https://crm.zoho.com/crm/org83259xxxx/tab/Leads I want to insert data into this Leads module, what is the correct endpoint for doing so ? Also I have using ZohoCRM.modules.ALL scope and generated necessary tokens.Where can I get Equation Editor por Zoho Writer?
I need to use Math Formulas in my document. Thank you.Filtering repport for portal users
Salut, I have a weird problem that I just cannot figure out : When I enter information as administrator on behalf of a "supplier" portal user (in his "inventory" in a shared inventory system), I can see it, "customer" portal users can see it, but theZoho Inventory. Preventing Negative Stock in Sales Orders – Best Practices?
Dear Zoho Inventory Community, We’re a small business using Zoho Inventory with a team of sales managers. Unfortunately, some employees occasionally overlook stock levels during order processing, leading to negative inventory issues. Is there a way toBUTTONS SHOWN AS AN ICON ON A REPORT
Hi Is there any way to create an action button but show it as an icon on a report please? As per the attached example? So if the user clicks the icon, it triggers an action?Dropshipping Address - Does Not Show on Invoice Correctly
When a dropshipping address is used for a customer, the correct ship-to address does not seem to show on the Invoice. It shows correctly on the Sales Order, Shipment Order, and Package, just not the Invoice. This is a problem, because the company beingRFQ MODEL
A Request for quotation model is used for Purchase Inquiries to multiple vendors. The Item is Created and then selected to send it to various vendors , once the Prices are received , a comparative chart is made for the user. this will help Zoho booksWill zoho thrive be integrated with Zoho Books?
titleProduct Updates in Zoho Workplace applications | August 2025
Hello Workplace Community, Let’s take a look at the new features and enhancements that went live across all Workplace applications this August. Zoho Mail Delegate Email Alias Now you can let other users send emails on your behalf—not just from your primaryNotebook audio recordings disappearing
I have recently been experiencing issues where some of my attached audio recordings are disappearing. I am referring specifically to ones made within a Note card in Notebook on mobile, made by pressing the "+" button and choosing "Record audio" (or similar),Unable to send message; Reason:554 5.1.8 Email Outgoing Blocked
Hi, I sent few emails and got this: Unable to send message; Reason:554 5.1.8 Email Outgoing Blocked And now I have few days since I cant send any email. Is there something wrong I did? Also can someone fix this pleaseWant to use Zoho Books in Switzerland. CHF support planned?
Hi, We're a Swiss company using other Zoho suite software and I discovered Zoho Books and other accounting SaaS when looking for an accounting tool. Do you intend to cover Switzerland and CHF based accounting anytime soon? RoyWeekly Tips : Teamwork made easy with Multiple Assignees
Let's say you are working on a big project where different parts of a single task need attention from several people at the same time—like reviewing a proposal that requires input from sales, legal, and finance teams. Instead of sending separate remindersBest way to share/download presentation files in Zoho without losing formatting?
Hello Zoho Community, I often work with PPT/PDF files in Zoho Docs and share them with colleagues. While PDFs usually give a direct download option, I’ve noticed that PPT/PPTX files sometimes only open in the viewer without a clear download link. Is thereCelebrating Connections with Zoho Desk
September 27 is a special day marking two great occasions: World Tourism Day and Google’s birthday. What do these two events have in common (besides the date)? It's something that Zoho Desk celebrates, too: making connections. The connect through tourismWhat is Resolution Time in Business Hours
HI, What is the formula used to find the total time spent by an agent on a particular ticket? How is Resolution Time in Business Hours calculated in Zohodesk? As we need to find out the time spent on the ticket's solution by an agent we seek your assistanceHow use
Good morning sir I tried Zoho MailAdding Overlays to Live Stream
Hello folks, The company I work for will host an online event through Zoho Webinar. I want to add an overlay (an image) at the bottom of the screen with all the sponsors' logos. Is it possible to add an image as an overlay during the live stream? If so,Email Sending Failed - SMTP Error: data not accepted. - WHMCS Not sending emails due to this error
I have been trying to figure out a fix for about a week now and I haven't found one on my own so I am going to ask for help on here. After checking all the settings and even resetting my password for the email used for WHMCS it still says: Email Sending Failed - SMTP Error: data not accepted. I have no clue how to fix it at this point. Any insight would be lovely.Does Zoho Learn integrate with Zoho Connect,People,Workdrive,Project,Desk?
Can we propose Zoho LEarn as a centralised Knowledge Portal tool that can get synched with the other Zoho products and serve as a central Knowledge repository?Next Page