What's New in Zoho Analytics - November 2025
We're thrilled to announce a significant update focused on expanding your data connectivity, enhancing visualization capabilities, and delivering a more powerful, intuitive, and performant analytics experience. Here’s a look at what’s new.
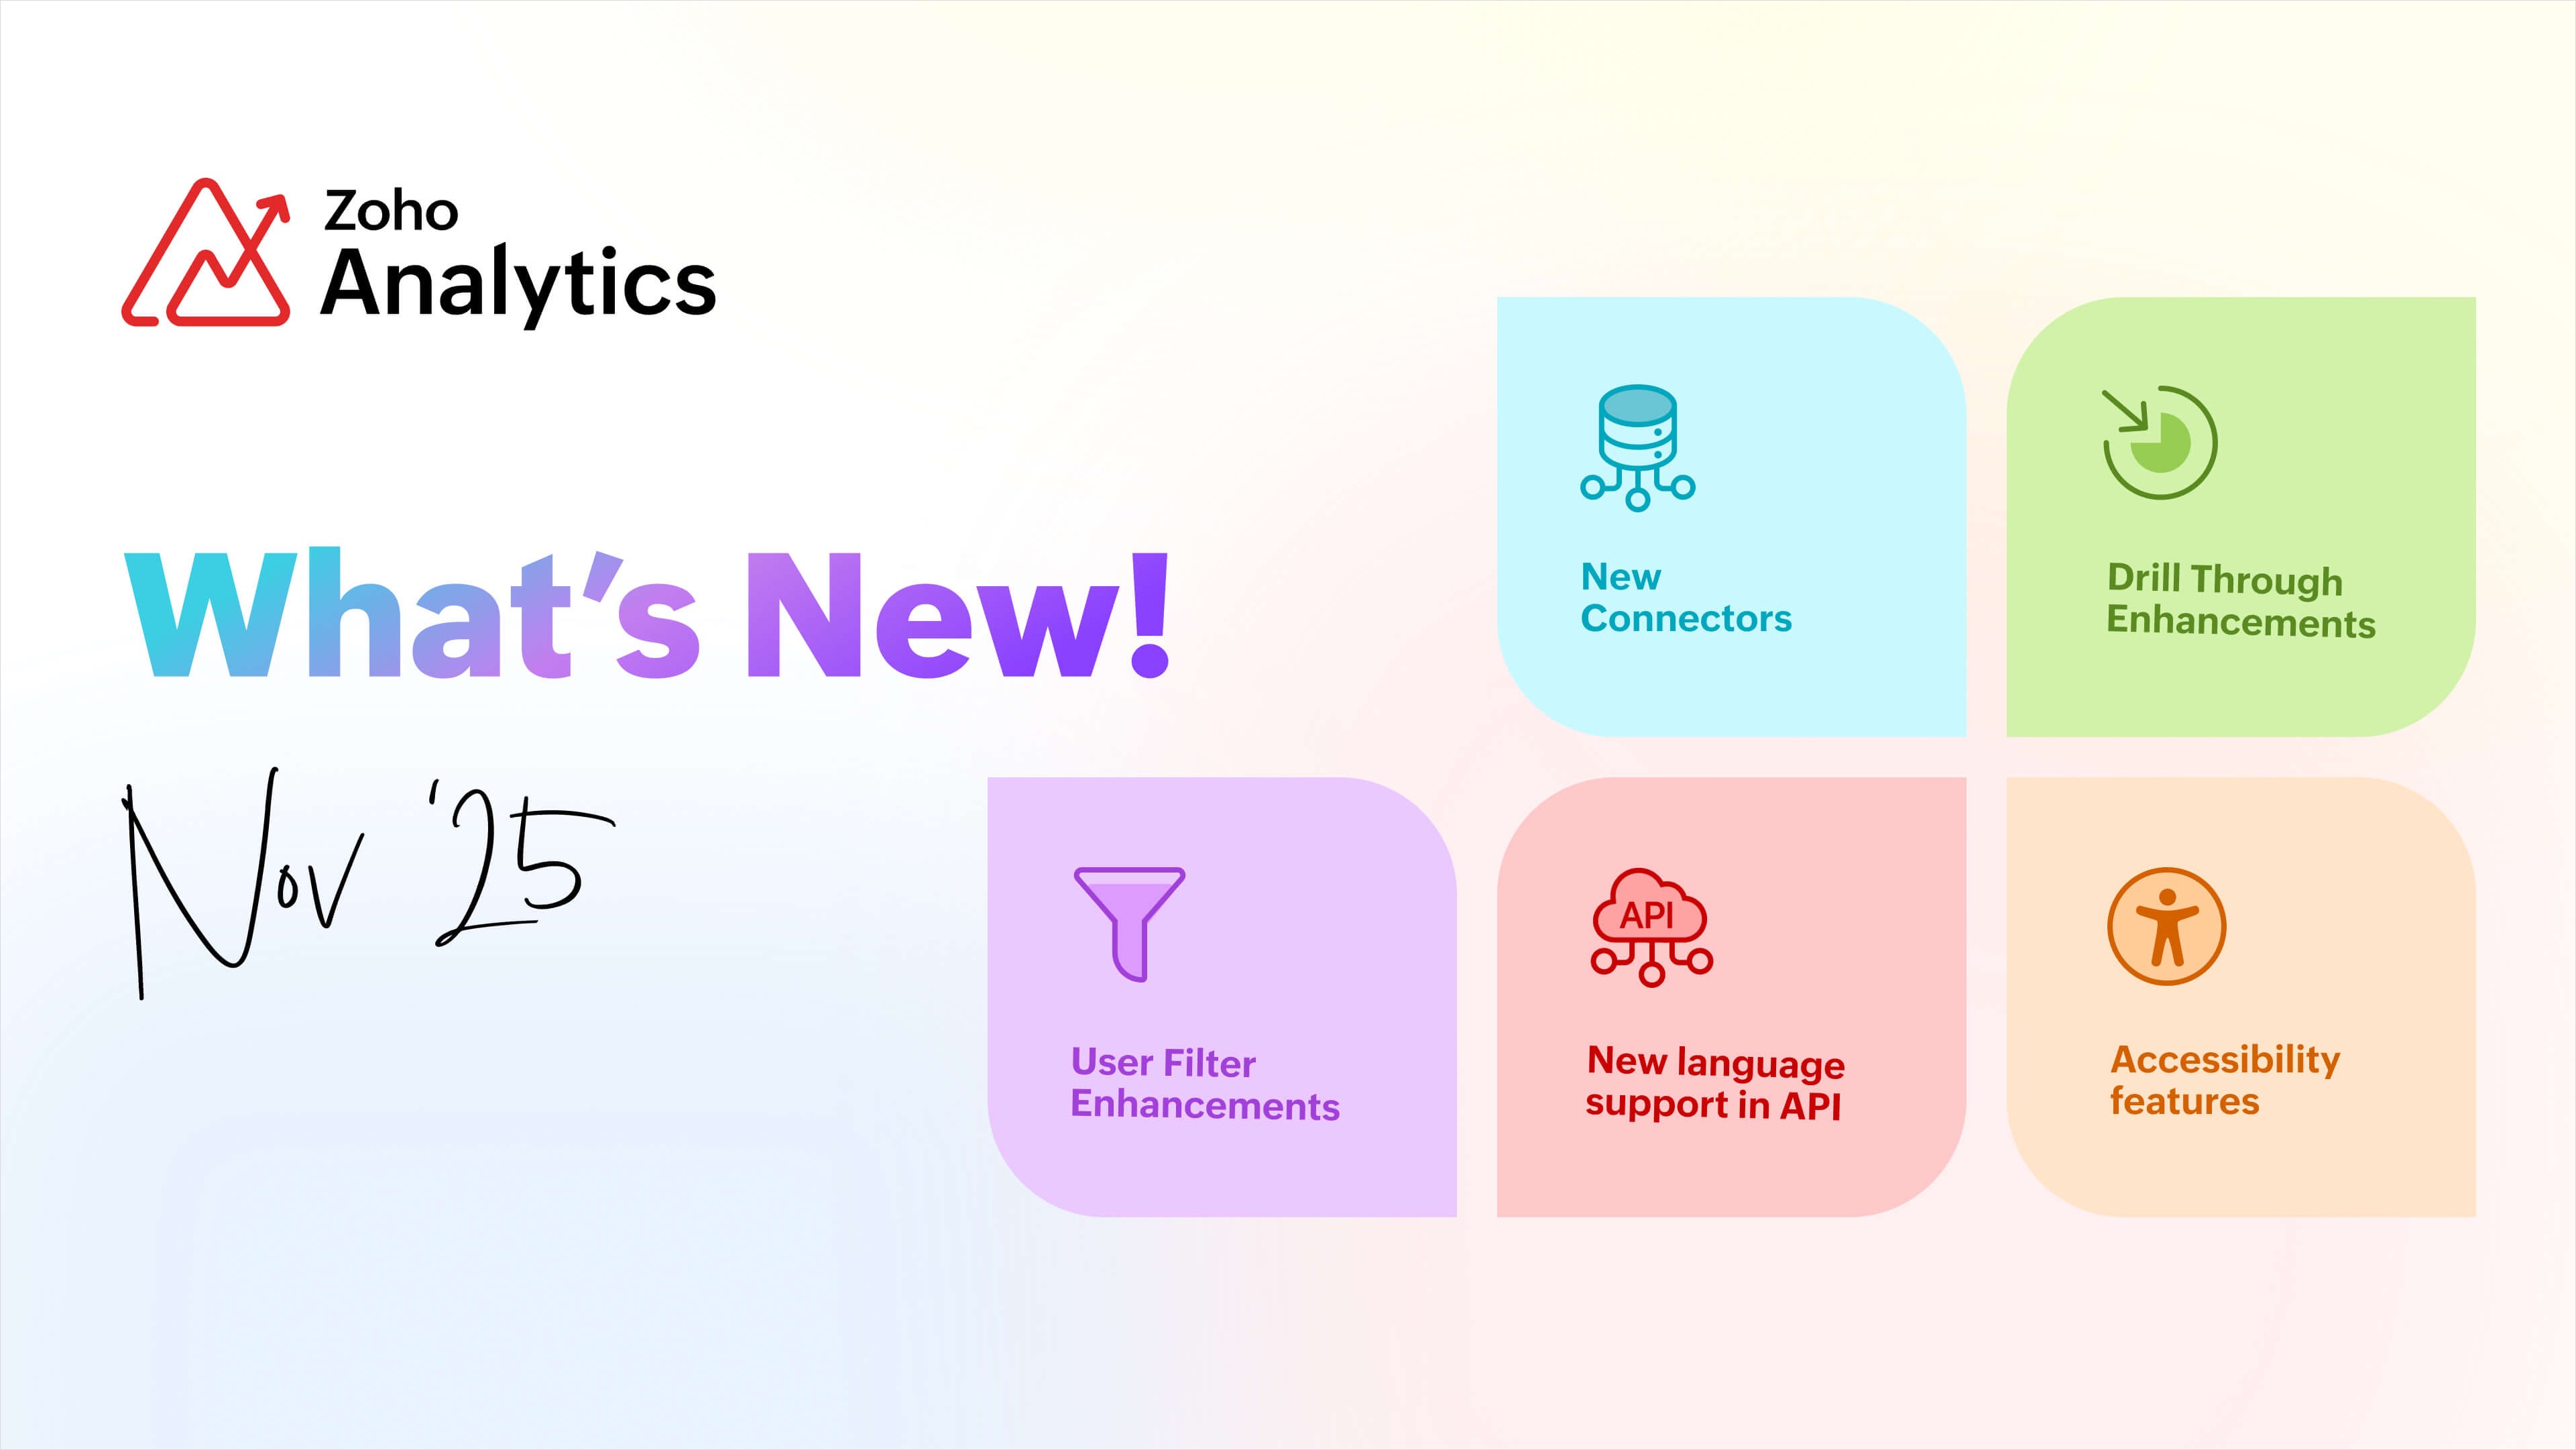
Explore What's New!
Accessibility
Introducing a new Accessibility section in Zoho Analytics. It gives you full control over how you view and interact with your Zoho Analytics interface. This update brings enhanced usability and helps ensure a more comfortable, efficient, and accessible reporting experience.
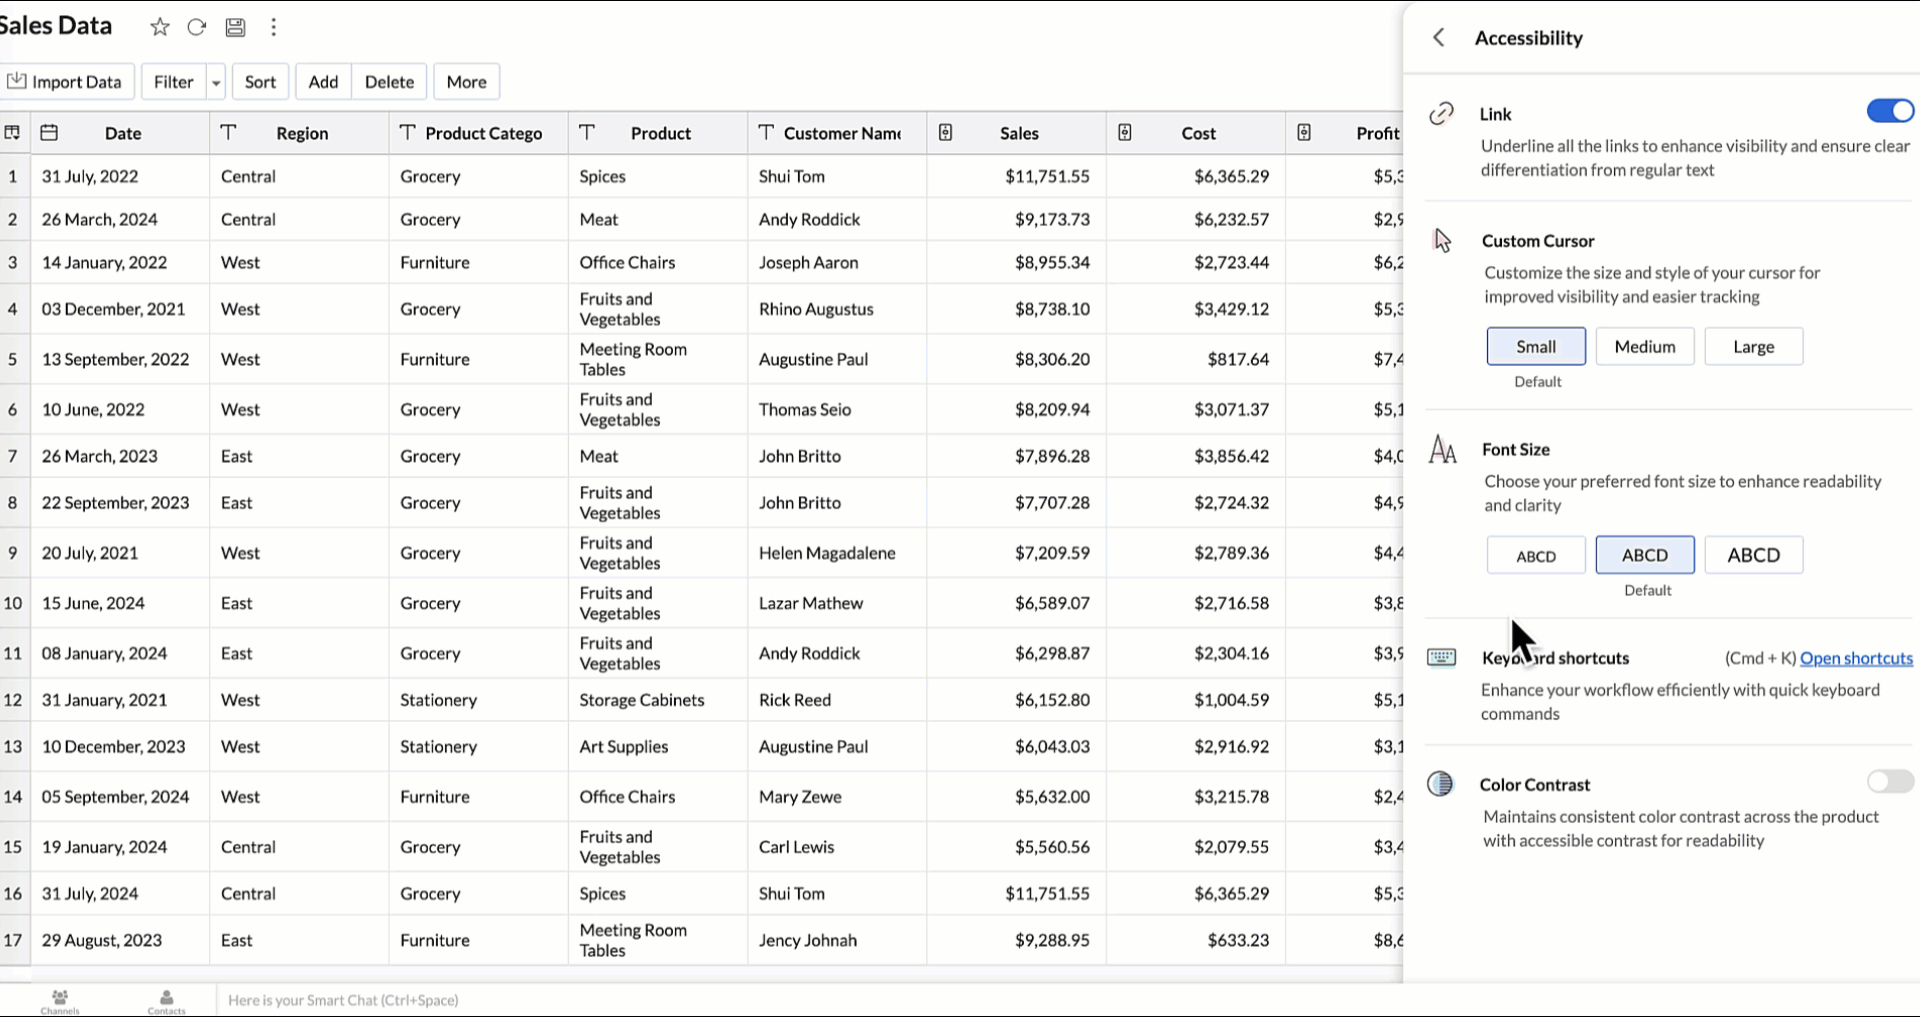
You can now personalize your interface with these new settings:
- Highlight Links - Underline all links to distinguish them clearly from regular text.
- Custom cursor - Choose the size of your mouse cursor (Small / Medium / Large) for better visibility and easier navigation.
- Font size - Adjust the font size of the interface to suit your reading comfort.
- Color contrast - Enable high-contrast mode to improve readability and support users with visual impairments.
- Keyboard shortcuts - Access a full list of built-in shortcuts, to speed up your workflow and navigate quickly using the keyboard.
Learn more.
New Data Connectors
Bring data from more sources into your analytics ecosystem with these new native connectors.
Qntrl Connector
Effortlessly bring workflow and process data from Qntrl into Zoho Analytics. Build reports to analyze task progress, approvals, and operational efficiency.
Learn more.
Asana Connector
Sync your Asana tasks, projects, and workflows seamlessly. Create visual dashboards to track productivity, timelines, and team performance.
Learn more.
Zoho Community Spaces Connector
Import engagement and activity data from Zoho Community Spaces. Analyze member participation, content performance, and community growth trends.
Learn more.
Zoho Finance Connector - New Modules
Gain deeper financial insights with newly added modules, enabling more granular reporting and analysis across your Zoho Finance suite.
Learn more.
Data Sync & Live Connect Enhancements
Incremental Fetch Enhancements
- From Other Workspaces: Users can now configure incremental fetch for data imported from another workspace, bringing in only new or updated records. This improves sync efficiency and reduces load times.
- For Custom Queries: Incremental fetch is now supported for data imported via custom queries, retrieving only new or updated records to enhance performance and reduce processing time.
Developer Hub Enhancements
API – Ruby Language Support
Zoho Analytics SDK now supports Ruby, enabling developers to build Ruby-based integrations and automation with native methods.
Learn more.
JS API - Tab Switch
Enhance embedded dashboard navigation. The JavaScript API now allows you to switch between tabs programmatically, enabling a better navigation control and interactive dashboard experiences.
Learn more.
Map & Geo Analytics Enhancements
Map-Layering Enhancements
Map Layering now includes drill-through for individual layers, options to fix unresolved locations, and the ability to use layered maps as filters in dashboards. These updates deliver deeper and more interactive geo-analysis.
Learn more.
Map Chart – Tooltip Enhancements
Map chart tooltips have been refined by removing Latitude/Longitude values. Users now see cleaner, more meaningful data highlights.
Reporting & Visualization Enhancements
Drill Through Enhancements
Drill-through is now supported for both Public Views and Embedded Views, enabling viewers to seamlessly access related reports for deeper data exploration and enhanced analytical context.
Previously, drill-through functionality was limited to shared reports. With this enhancement, viewers can now open linked drill-through reports, provided those reports have also been made Public.
Learn more.
Tooltip / Info Icon in Widgets
Widgets now support tooltips and Info icons to display additional descriptions or context. This helps dashboard viewers understand metrics instantly.
Learn more.
Anomaly Detection for Dimensional Fields
Zoho Analytics now supports enhanced anomaly detection when a dimension field (category) is added to the Color shelf. Users can choose from multiple detection modes to better analyze deviations across different perspectives
- Overall data
- Each X-Series
- Each Color-Series Individually
- Each Combined Series of X and Color Columns
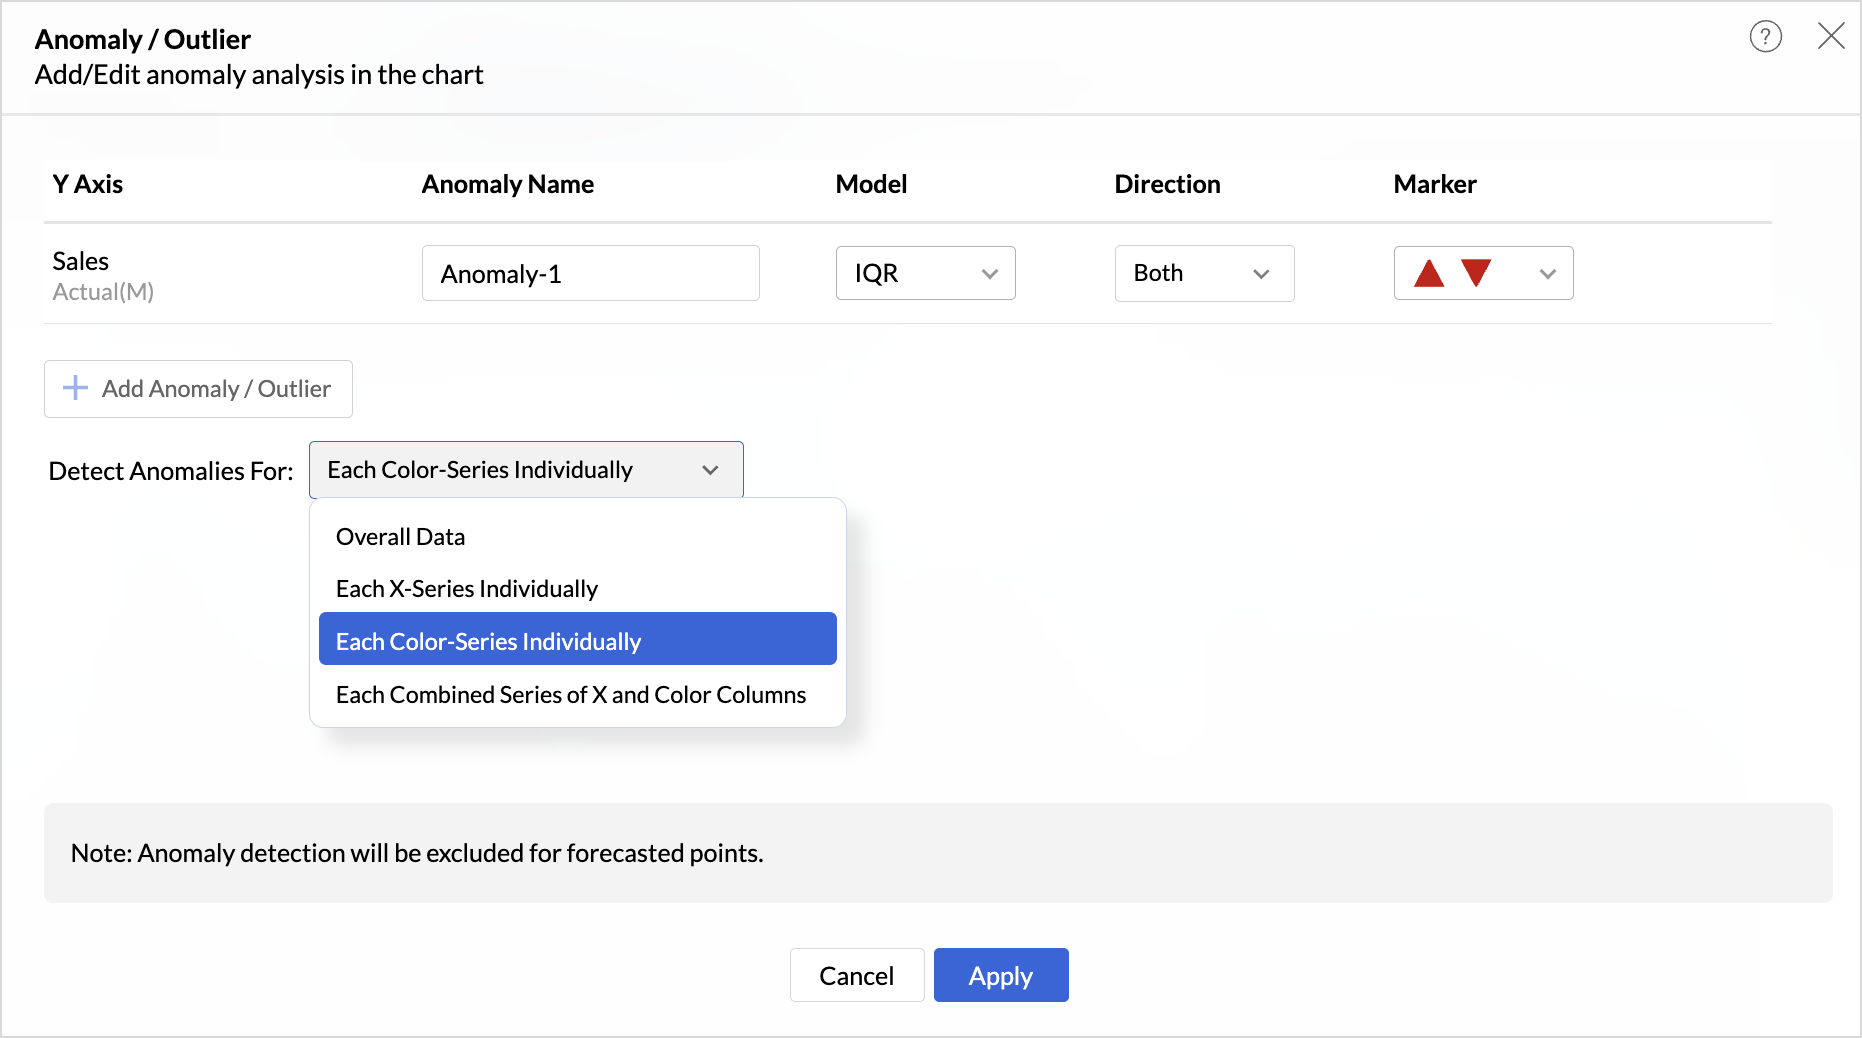
These enhancements offer greater flexibility and precision in uncovering unusual trends and outliers across segmented data visualizations.
Sorting of Values Across Group in Pivot Views
We have added a new option called Sort across Group which helps you apply clearer and more consistent sorting in Pivot Tables.
Earlier, sorting worked only inside each group. With Sort across Group, you can now sort the entire pivot table based on the selected column, regardless of how the groups are arranged.

Freeze Column Support in Pivot & Summary Views
We have added Freeze Column support in Pivot and Summary Views to help you work more comfortably with wide reports. This feature keeps selected columns fixed on the left side of the table while you scroll horizontally, allowing you to compare key columns with other metrics without losing context.

Report-Level Fiscal Year Option
Align individual reports with your organization's financial calendar by defining the Fiscal Year start month at the report level. This setting applies only to the selected report and appears when a date column is used, enabling accurate time-period analysis.
Learn more.
Dynamic Thresholds with Variables in User Filters
Aggregate formulas can now be used with variables inside thresholds. When paired with User Filters, threshold values are calculated dynamically based on each user’s filter selections ensuring every user sees context-relevant threshold boundaries instead of a fixed value.

Datatype-based Variable Suggestions for Default User Filters
When configuring default values in User Filters, only variables matching the filter’s datatype are now listed. This prevents configuration issues such as assigning a text variable to a numeric filter, and ensures accurate default value mapping.
Learn more.
AI & ML Enhancements
AutoML – 128GB Server Support
AutoML now runs on high-power 128GB servers in the US Data Center. This enables faster model training and support for significantly larger datasets.
Learn more.
Zia Insights - Enhancements
Customize Zia Insights
Users can now tailor Zia Insights by selecting specific metrics and dimension columns for insight generation and choose the types of insights to focus on:
- Contribution Analysis: Understand key factors impacting outcomes.
- Time Series Insights: Detect trends, seasonality, anomalies, and forecast future values.
- Comparison Between Dimensions: Analyze performance and variance across different dimensions.
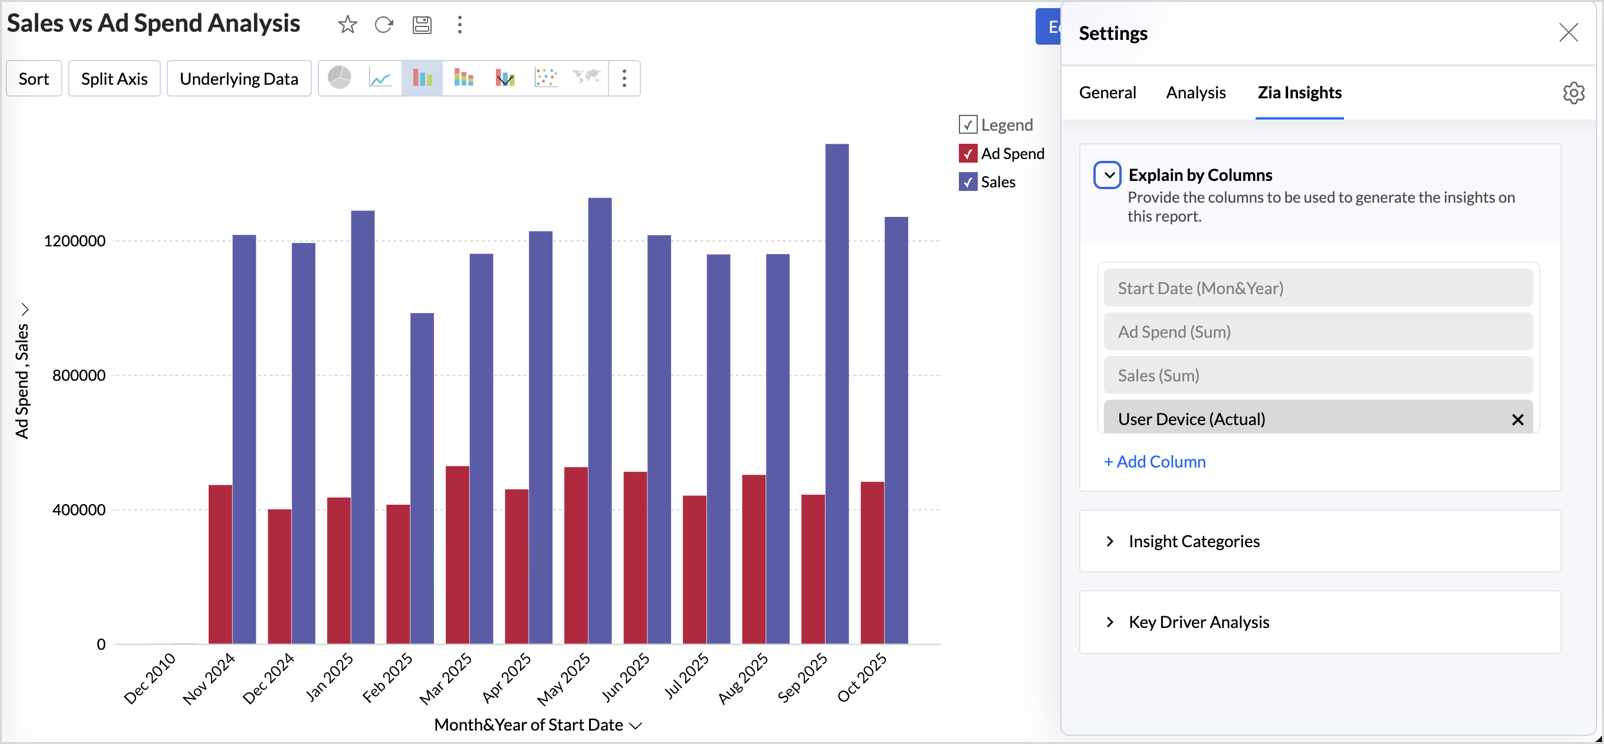
This customization ensures insights are focused, relevant, and tailored to the report’s context.
Learn more.
Diagnostic Insights Now Available for Multiple Time Series Analyses
Previously, diagnostic insights were available only for Recent Time Period Analysis. With this update, users can now access diagnostic insights across multiple time series analyses like, Anomalies/Outliers, Largest Incline/Decline, Period-over-Period Changes, and Start vs End Period Analysis revealing the “why” behind the data for more informed decisions.

Other Updates
Audit Logs for White label Users
Track administrative actions with greater precision. All activities performed in the White Label admin console are now comprehensively logged in the Audit Logs for improved security and compliance.
New Language Support
Zoho Analytics is now more accessible globally, with support for 29 international and 11 Indian languages.
Learn more.