Spotlight Series #14: Visualize your data with tables
Hello everyone,
When presenting data, it's critical to ensure the information is understandable and meaningful to your audience. Representing data visually is ideal, as it can help audiences comprehend complex information quickly. Tables help organize your information and play a crucial role in conveying it effectively, so viewers can interpret your data faster.
You can use tables to compare two or more pieces of information in the form of text or numerals.
Working with tables in Show:
The Show app makes it easy for you to insert a table. You can add, edit, and customize it as needed.
Create:
With the Show app, you can create tables in a snap. All you have to do is hover the cursor and choose a number of rows and columns for the table. Initially, you can create a table with a maximum of eight rows and eight columns. However, you can add any number of rows and columns later.
Edit:
 and
and  help you add columns to the left or right of the selected column.
  and
and  helps you add rows up or below of the selected row. To delete a row or column, use the
  icon.
icon. 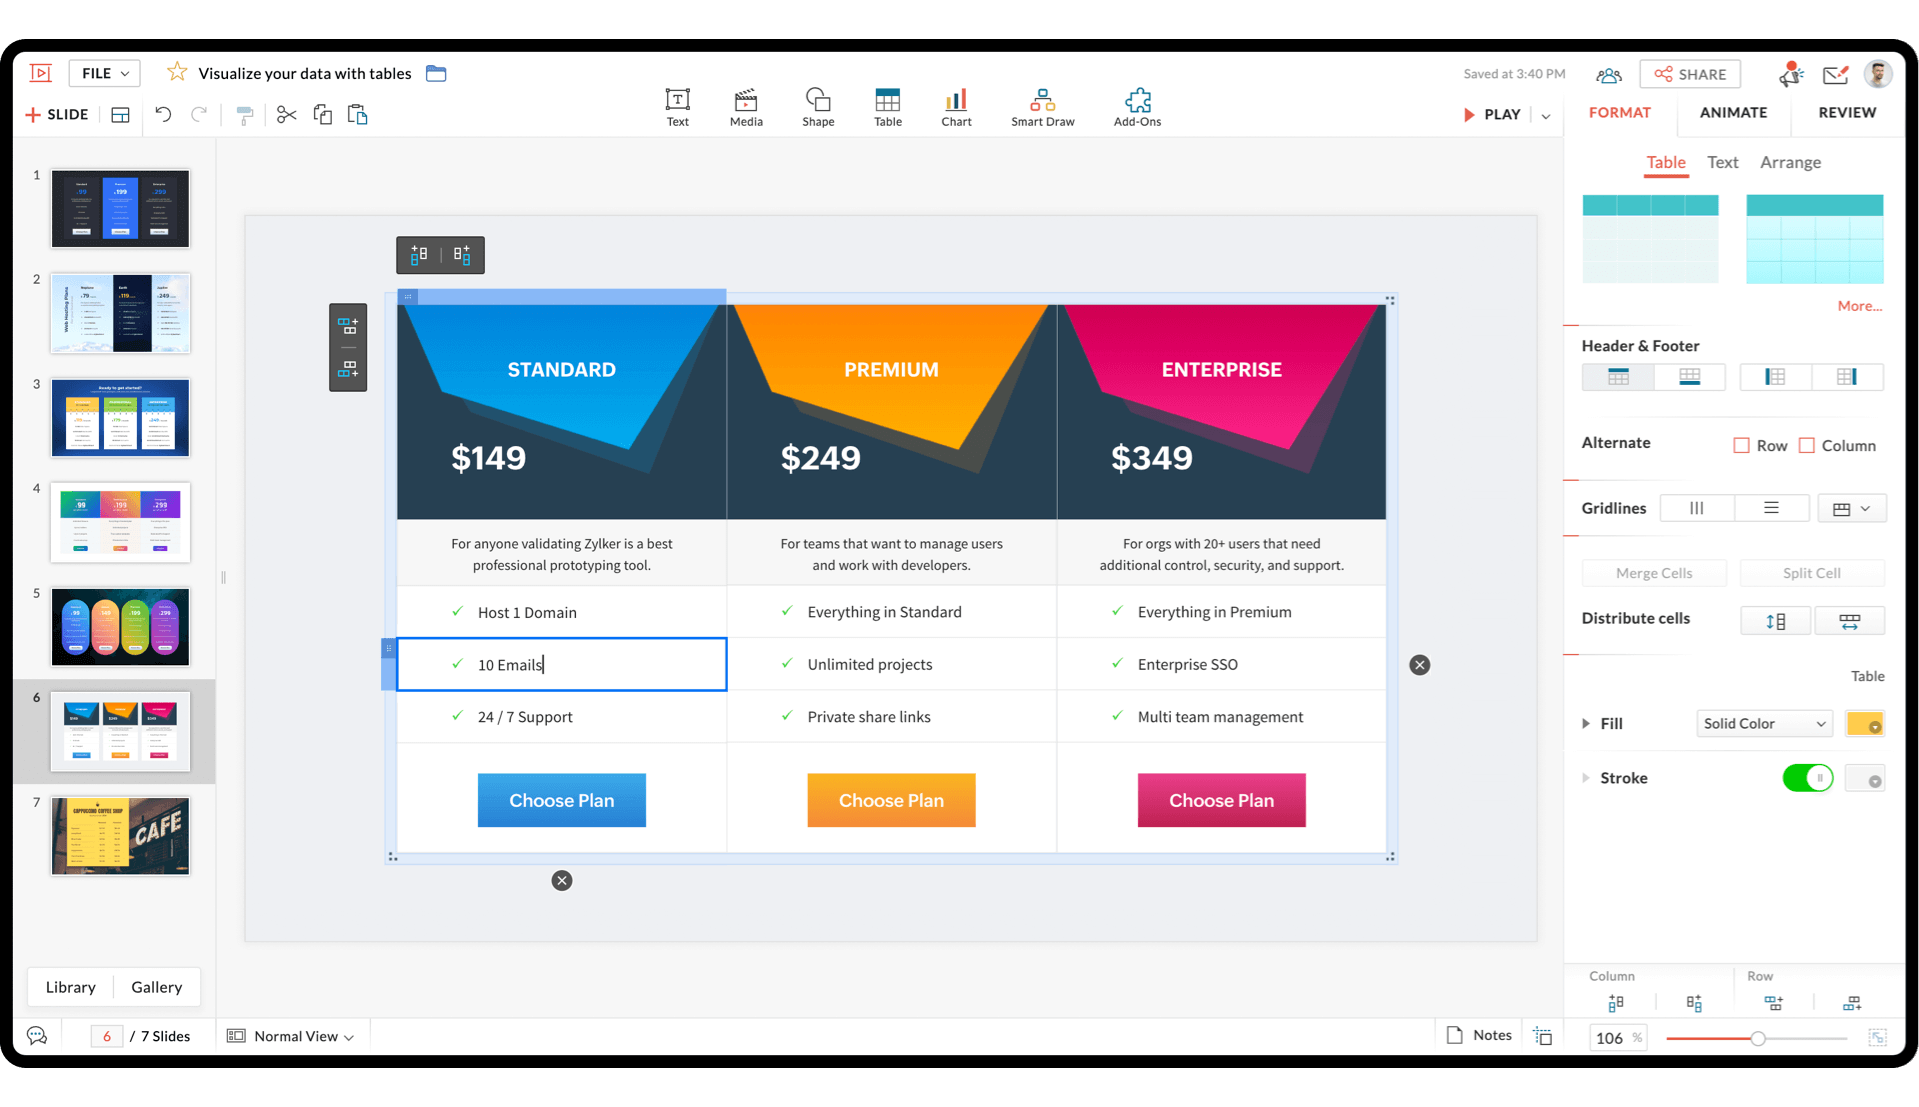
Format:
Zoho Show lets you format tables using a wide range of customization options. With Show, you can:
- Choose a style from a variety of built-in table presets.
- Change the header and footer of the table to display horizontally or vertically.
- Shade alternate rows or columns for visual distinction.
- Add table grid lines to distinguish each cell in the table.
- Merge two or more cells.
- Distribute the table's cells to adjust the height and the width of the rows and columns.
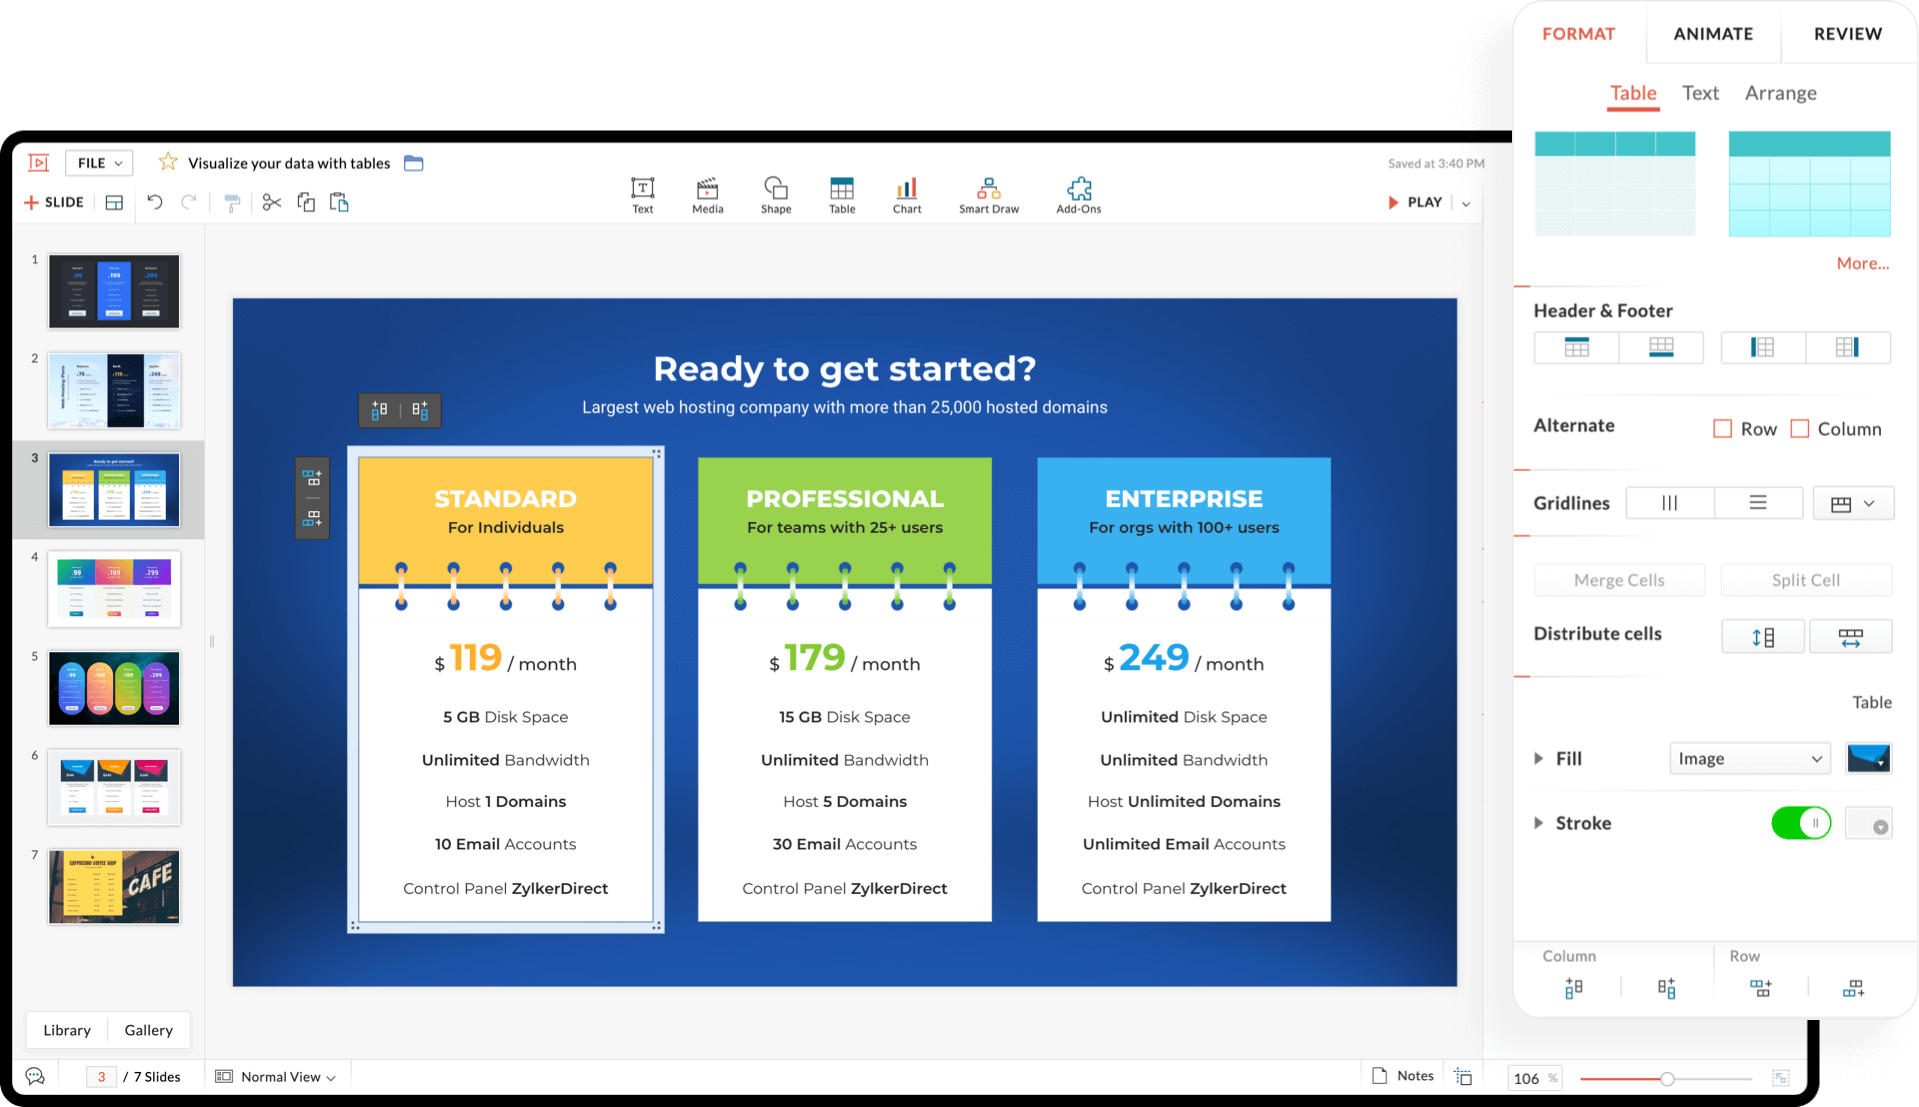
- Highlight cells, rows, or columns with a fill color, image, or pattern.
- Give definition to the table by applying a border.
- Align the text inside a cell.
Pro tip: Want to move data from a table to a chart? You don't have to re-enter the entire data set. Simply right-click on the table and use the Convert to Chart option to transform it into either a chart or graph.