What's New - January 2026
Hello Users!
We are starting the year with a strong lineup of updates, marking the beginning of many improvements planned to enhance your analytics experience. Explore the latest improvements built to boost performance, simplify analysis, and help you extract more value from your data.

Archive Data
No more querying all records while generating reports! Analyze data faster and optimize workspace performance with Archive Data. Move older or less-frequently used records out of active tables, and store them securely.
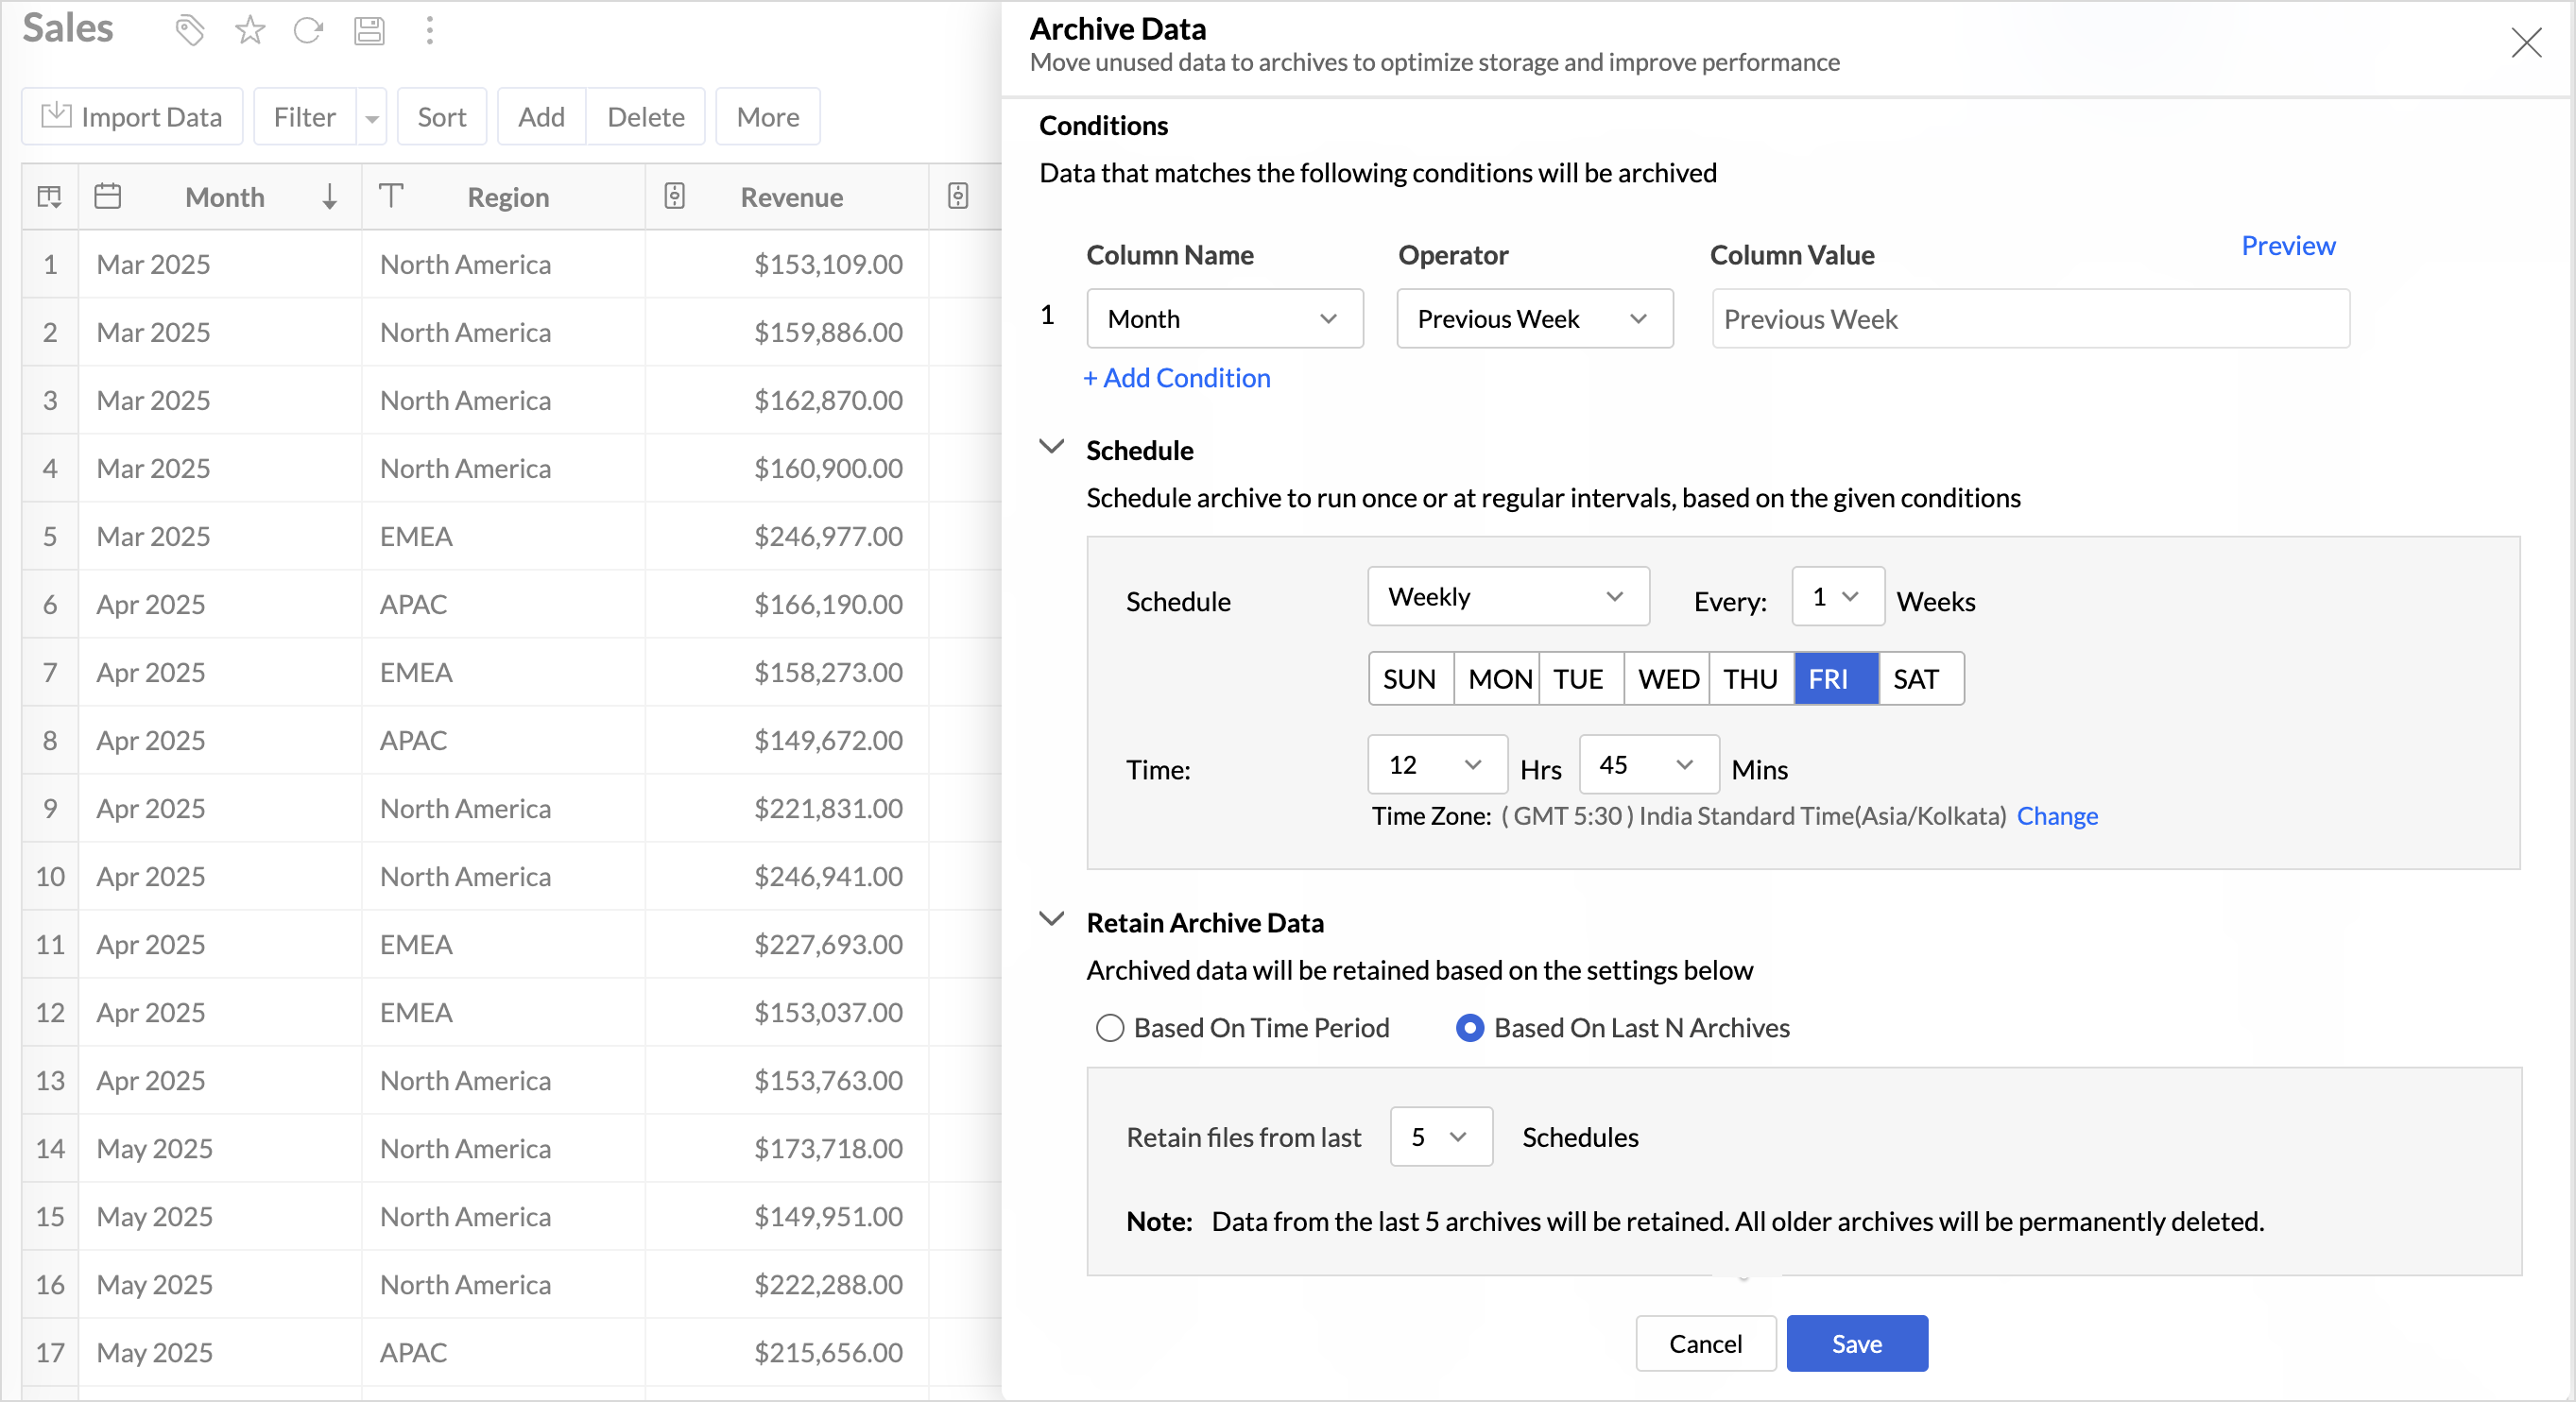
Key Benefits
- Pay only for what you analyze: Active data is reserved for analysis, while historical data is retained without impacting usage limits.
- Improved Querying and Faster Analysis: By limiting queries to relevant data, report generation and dashboard loading times are significantly reduced, resulting in faster insights and a more responsive analytics experience.
- Optimized Storage Usage: Archiving older data helps control table size, preventing unnecessary growth, and better management of row limits.
Organize Views with Tags
Group related views, and manage reports and dashboards effortlessly. Use tags to organize views by teams, departments, projects, or specific use cases, making it easy for users to navigate large workspaces.
Quickly filter and find the right reports and dashboards, reduce clutter, and ensure teams always have access to the views that matter most to them.
Global Custom Sort
Custom sort was limited to individual reports previously. With recent enhancements, you can now define the sort order for text data types at the workspace level.
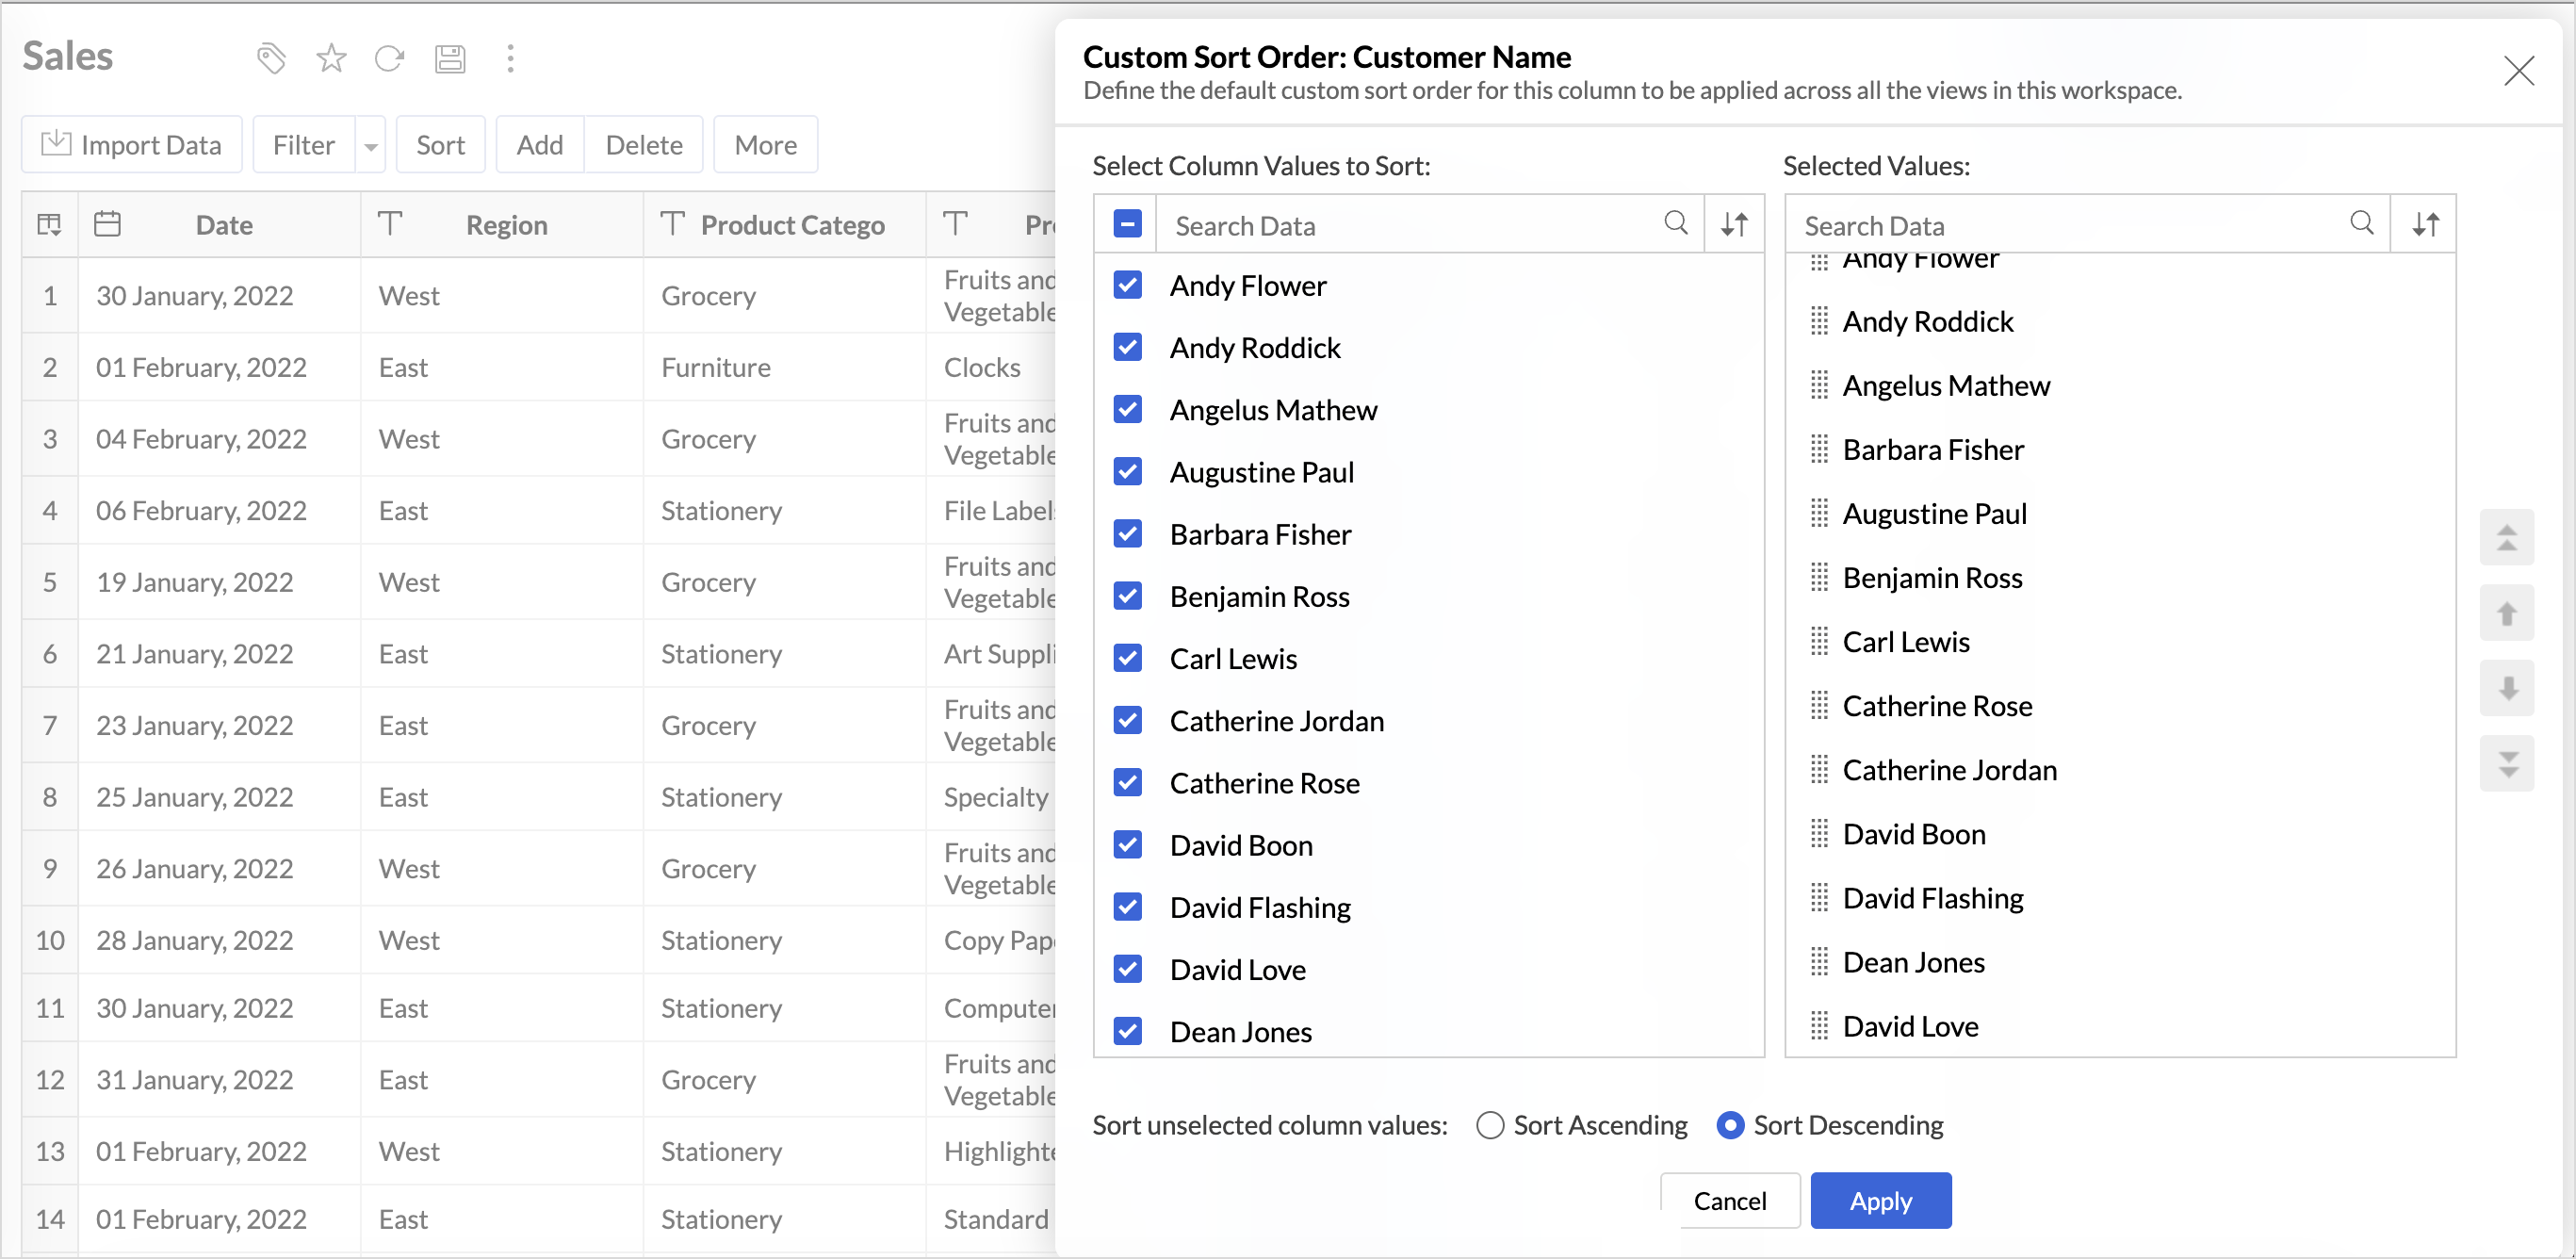
This improvement helps you maintain a consistent sorting across all reports, reduces repetitive setup, and saves time. It also ensures a standardized view of your data throughout the workspace.
Timeframe Selection for Overview Charts
Overview charts now offer flexible timeframe selection, allowing you to focus on relevant periods for deeper trend analysis.
By narrowing the time range, you can better compare performance, identify patterns, and gain clearer insights without distraction from older data.
Customize Zia Insights placement in Dashboards
Choose where and how the insights are displayed, so that they complement your analysis without disrupting your dashboard layout. This gives you greater flexibility to present insights in the way that best suits your audience and reporting style.
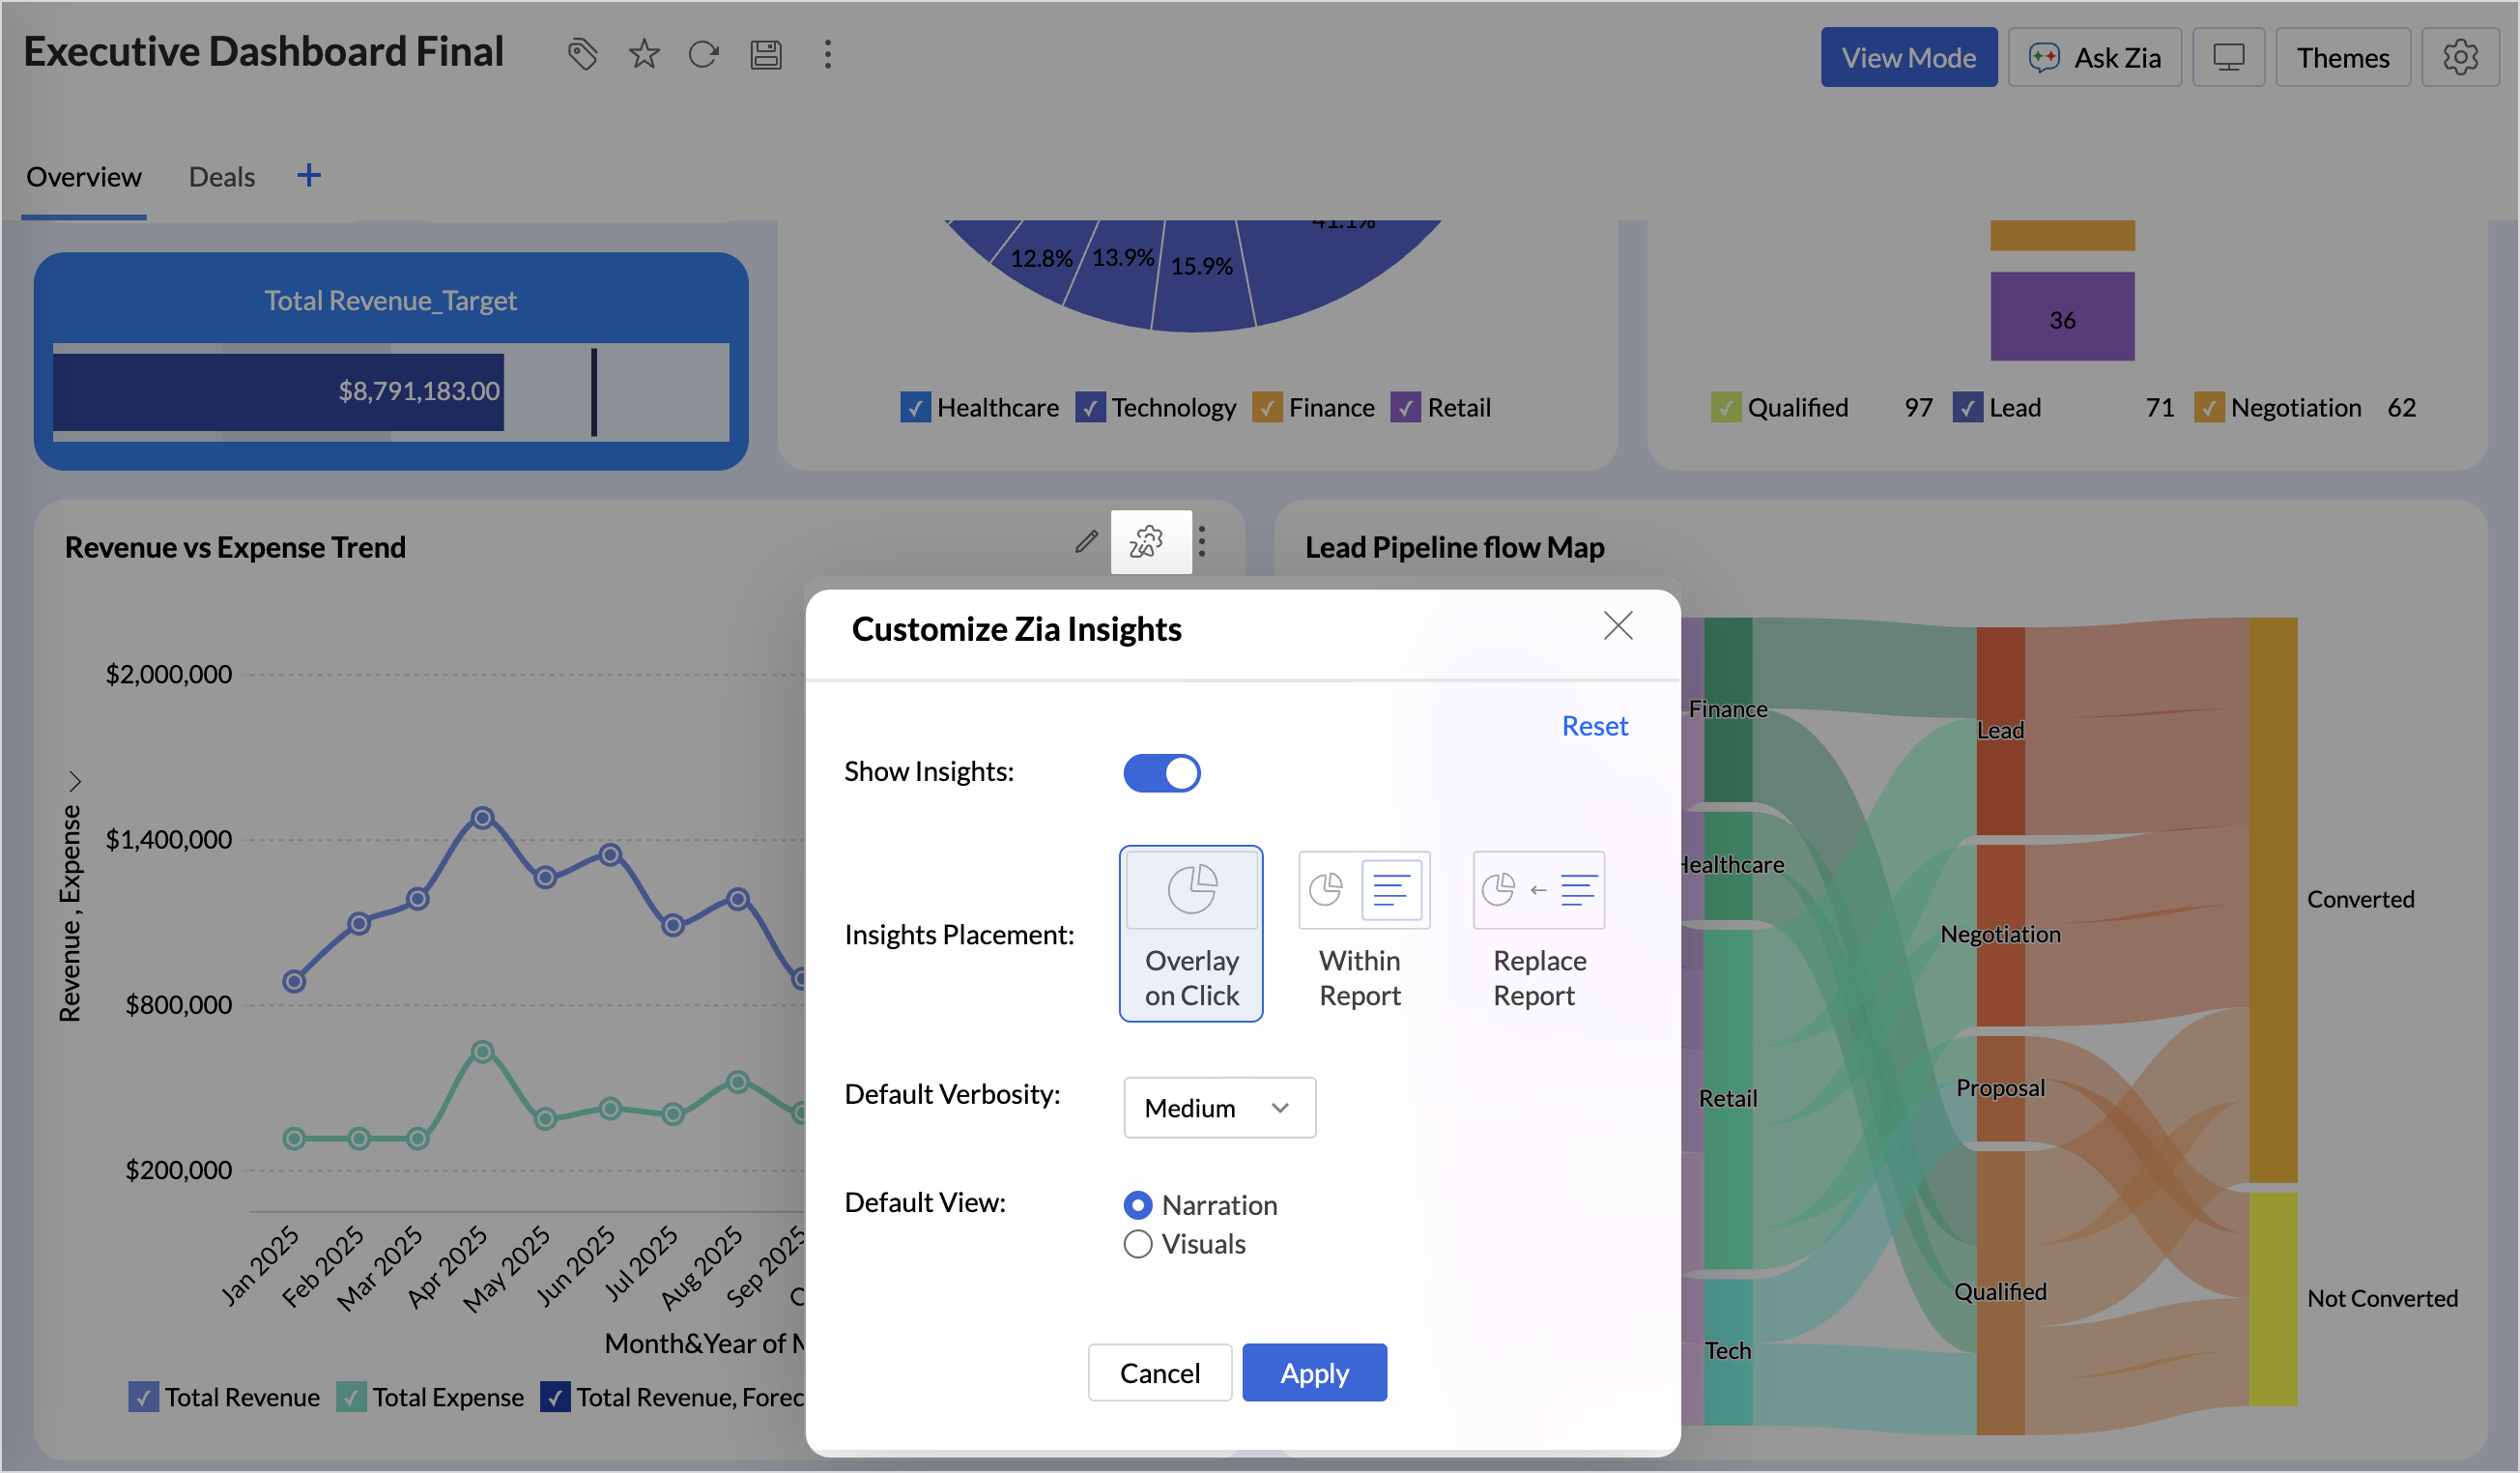
- Overlay: Displays insights in a floating panel that opens on demand, allowing users to review insights without leaving or altering the report view.
- Within Report: Embeds insights directly within the report, enabling users to view data and insights together in a single, continuous view.
- Replace Report: Displays insights as the primary view by replacing the report entirely, offering an insight-first experience focused on conclusions, rather than raw data.
Customize Image Size in Dashboards
Dashboards now support image size settings that let you control how images are displayed.
Choose from options like Original, Fit to width, Contain, or Stretch to ensure images align well with your dashboard layout, and thus improve visual clarity.
Tabular View Enhancements
- With this enhancement, all tables linked via lookup columns are now available in the Filter Criteria tab. This makes it easier to share views with users using associated filters, ensuring the specified criteria are automatically applied to the shared report.
- You can now customize lookup columns and the join paths used within Tabular View. This enhancement gives you control over how related tables are connected, helps avoid incorrect or ambiguous joins, and ensures more accurate and reliable data representation in your tabular reports.
New Business App Connectors
We have now introduced integration with two new business connectors Zoho FSM and Magento.
Zoho FSM
Connect your Zoho FSM Data with Zoho Analytics to analyze your field service operations in depth. Identify bottlenecks, optimize resource allocation with interactive reports and dashboards. Analyze revenue, service costs, and customer trends to improve profitability and service quality.
Adobe Commerce (Magento)
Analyze sales, orders, customers, and product performance with ready-made reports and dashboards. Track key metrics like revenue trends, average order value, and top-selling products. Gain insights into customer behavior and regional sales patterns. Make faster, data-driven decisions to optimize store performance and growth.
Topic Participants
Nisha Angel J
Sticky Posts
What's New in Zoho Analytics - January 2026
Hello Users! We are starting the year with a strong lineup of updates, marking the beginning of many improvements planned to enhance your analytics experience. Explore the latest improvements built to boost performance, simplify analysis, and help youWhat's New in Zoho Analytics - November 2025
We're thrilled to announce a significant update focused on expanding your data connectivity, enhancing visualization capabilities, and delivering a more powerful, intuitive, and performant analytics experience. Here’s a look at what’s new. Explore What'sWhat's New in Zoho Analytics - October 2025
Hello Users! We're are back with a fresh set of updates and enhancements to make data analysis faster and more insightful. Take a quick look at what’s new and see how these updates can power up your reports and dashboards. Explore What's New! ExtremeWhat’s New in Zoho Analytics – September 2025
Hello Users!! In this month’s update, we’re raising the bar across multiple touchpoints, from how you bring in data, plan and track projects to how you design and brand your dashboards. We’ve added the all-new Gantt chart for project visualization, expandedAnnouncing Agentic AI - Ask Zia!
We are delighted to roll out the new agentic AI capabilities in Ask Zia, where every stage of the BI workflow is assisted by AI. With a human-in-the-loop approach, Ask Zia ensures that you’re in command of the decision, while AI handles the complexity.
Recent Topics
Zoho Developer Community Hackathon 2025 is LIVE!
Hey developers! It’s that time of the year again — the Zoho Developer Community Hackathon 2025 is officially open for registrations! If you’ve been waiting for a chance to stretch your skills, try something new, or finally bring that idea to life, thisConverted Leads Not Showing in Lead Reports
Converted leads are not showing in the Lead reports. How can I make converted leads visible in the report,Text widgets in dashboards
Having a text widget in a dashboard would help immensely. It would allow adding links to related documents, relevant CRM views, etc. It would allow adding explanations of the data displayed in the other widgets, about how to interpret them or about filtering.[Webinar] Zoho Writer for content creators and publishing houses
Managing multiple drafts, edits, and client reviews doesn't have to slow you down. Join our upcoming webinar to see how Zoho Writer helps content creators and publishing houses create, edit, and publish seamlessly—all in one place. You'll learn how to:Adding Reports to Portals
Is there a way to add Reports to portals so only the user can see report templates relevant to them?How to assign one Manual to multiple Spaces?
Hello, I have two spaces, one called tech knowledge and the other one called HR knowledge. I have a manual that is called HR tech. I want to assign this manual to HR knowledge and tech knowledge. How should I do that?Introducing VeriFactu Support in Zoho Books
Hello users, Spain has introduced the VeriFactu system under Real Decreto 1007/2023 to ensure integrity, traceability, and anti-fraud compliance in e-invoicing. Starting January 1, 2026, all B2B invoices must be reported to Agencia Estatal de AdministraciónHow can I assign courses to Spaces?
How can I make courses show up here in this space?:When will Zoho Learn be able to support SCORM files on the mobile app?
When I click the SCORM content, I just get a message saying it's not possible yet. Yet implies that it will be coming soon. All I'm asking for is a realistic timeline so I know whether or not to invest my time in using it. If it will be soon, then I willAnnouncing new features in Trident for Windows (v.1.35.6.0)
Hello Community! Trident for Windows just got better with an update that makes working with your emails even more efficient. Let’s dive into what’s new! Work with PST files more efficiently. You can now do more than just view mounted PST files. You canMarketing Tip #9: Track your traffic sources
Not all marketing channels work equally well. Knowing whether your visitors come from Google, Instagram, or email helps you focus on what actually drives sales. Try this today: Check your Zoho Commerce reports or connect Zoho PageSense to see your topGoogle Analytics import data inaccurate (as of October 11, 2025)
We have Zoho Analytics connected to GA4 to import daily event data. This has been running without issue for a couple of years. However, a month ago we started noticing discrepancies. All data until October 10 lines up perfectly - October 11 onward isPrevent accidental duplicate entry of Customer Ordersome
Zoho Support has confirmed that Zoho currently does not have any method (using Deluge, flow or any other method) to alert a user when a sales order has been entered twice using the same customer reference number (i.e. a duplicate). Most ERP platformsZoho Books | Product updates | November 2025
Hello users, We’ve rolled out new features and enhancements in Zoho Books. From translating email notification templates to the new transaction locking restrictions, explore the updates designed to enhance your bookkeeping experience. Making Tax DigitalInsert Image into Notebook page
Prior to today, I could add images to my notebook pages. Today when I tried to do this I got an error message that said something like, "There's been a problem on our end. Try again later." So, I've tried all the ways I know how, but I can't insert an【開催報告】名古屋 ユーザー交流会 Vol.2 2025/11/21 Zoho Analytics / Inventory で実現する在庫の"未来予測"
ユーザーの皆さま、こんにちは。コミュニティチームの中野です。 11/21(金)に名古屋 ユーザー交流会 を開催しました。 本投稿では、当日実施したセッションの様子及び投影資料をお届けします。 会場にて参加できなかった皆さまも、ぜひご参照ください。 (Zoho 社員セッションの登壇資料については、11/28(金)開催の東京回の開催報告で共有いたします) 今年2回目の開催となる名古屋 ユーザー交流会では、株式会社エンツナクリエイト 野末さんによる Zoho Analytics / InventoryIs there a way to automatically add Secondary Contacts (CCs) when creating a new ticket for specific customers?
Some of our customers want multiple contacts to receive all notifications from our support team. Is there a way to automatically add secondary contacts to a ticket when our support team opens a new ticket and associates it with an account? This wouldImproved RingCentral Integration
We’d like to request an enhancement to the current RingCentral integration with Zoho. RingCentral now automatically generates call transcripts and AI-based call summaries (AI Notes) for each call, which are extremely helpful for support and sales teams.Edit Pinned Comments in Zoho Desk
It's great that private comments can now be pinned to the top of the ticket but what would be extremely helpful would be to allow for the pinned comment to be edited vs. having to find the comment in the ticket to edit it.Updating Secondary Contact (CCs)
We use Zoho Forms to capture the user request and integrated with Zoho Desk to raise tickets. Active Microsoft login is captured in our Zoho forms and registered as Primary contact in Zoho desk ticket. We also an have an option to raise ticket on behalfblank page after login
blank page after logging into my email account Thanks youWriterTh
After every space Writer goes to capital letters mode in my Android tablet. The cap mode stays till the second letter is typed in the word then it comes to normal mode.Zoho writer unable to merge documents to PDF with basic fonts in Hebrew or fonts from my computer
I created several forms that will be merged into PDF files through Zoho Writer and I am unable to receive the PDF in the basic fonts of the Hebrew language or in the fonts I have on my computer. The writer exports to PDF an exchange font that looks veryI have already created some Bots, Commands, and Widgets in Cliq, but I am still not seeing the “Create Extension” option in my account. Could you please help me enable or access this option?
Infinite loop of account verification
Hi I can't do anything on my zoho account. I always get this message Hi Sheriffo Ceesay As a security measure, you need to link your phone number with this account and verify it to proceed further. When ever I supply the details, it displays that the number is associated with another account. I don't have any other account on zoho so this is really annoying.How we cut CRM updates from ~20 minutes down to 2, our real workflow
Updating the Zoho CRM after every call used to be one of the biggest time sucks for our team. By the time you write your notes, clean them up, fill in the fields, and log everything properly… you’ve easily lost 15–20 minutes per call. We started experimentingArattai App Features Update
1. Offline Messaging & Sync Enable users to compose messages without internet and deliver them automatically via peer-to-peer methods (Bluetooth/WiFi Direct) when nearby users are available. This would be a game-changer for rural India with unreliableHow to add Product Add-Ons, Mandatory Forms, and Auto-Save Address in Zoho Commerce
Hi all, I need help setting up several behaviors in Zoho Commerce. I can’t find the correct configuration options, so I want to confirm whether these are supported or if there is a workaround. 1. Product-Specific Add-Ons (Example: GWB Subscription) WhenZohomail
Im trying to setup email address zohoPROBLEMA
Salve, non riesco a inviare email, e mi esce una tabela errore temporaneo. come posso risolvere il problema ?Forever FREE Business Email with Zoho Mail
Forever FREE Business Email with Zoho Mail: is it available?Weekly Tips : Make collaboration effortless with Whiteboard in Zoho Mail
Working with your team often means switching between emails, notes, and other applications just to explain an idea. Maybe you are trying to sketch a layout, plan a workflow, or quickly brainstorm ideas—with text alone, things can get confusing. So howFormula field number of days between 2 dates
Hi, I want to have a formula field which calculates the following: IF EndDate < TODAY and Oproep is true (this is a checkbox field) than EndDate - StartDate, otherwise TODAY - StartDate It should calculate the number of days How can I write this for'email address already exists'
I deleted a user from my organization and want to use the same email address that user had, but the email address seems to still exist somewhere as I get 'email address already exists' when I try and create it. I have deleted the entire organization andZOHO reporting DKIM entries are not configured, when they have been configured and verified by 3rd parties
Why is ZOHO reporting to my organisation users the following: "The DKIM entries in your domain's DNS records are not configured. Please contact your administrator for configuring DKIM to ensure optimal RSVP invite delivery." When I have configured theManage Bookings directly from Zoho Mail
Greetings from the Zoho Bookings team! We’re introducing the new Zoho Bookings extension for Zoho Mail, designed to help you view appointments, copy time slots and share booking links without leaving your inbox. This integration brings scheduling rightMy notes from the past 2 months have disappeared
Hola, necesito ayuda urgente. Hoy, al iniciar sesión en mi Zoho Notebook como todos los días, me llevé una gran sorpresa al descubrir que todas mis notas de los últimos dos meses habían desaparecido. Estas notas son muy importantes para mí, ya que usoHow can I load a network into the cliq desktop app?
I have both the standard cliq log in for my org and I am part of a cliq network. In the browser I can choose which I log in to. However, in teh desktop app if I log in it will alwasy load my org's cliq. Can I switch this to the network I have createAbility to modify what displays in calendar invite?
I am a long time calendly user and want to make the switch to bookings. I understand that there is not currently a meets/hangouts integration, is one on the roadmap? Is there anyway I can modify the calendar invite to include the meet link? I can add it to the emails no problem, but I would also like it to display on their calendar. Is there some work around I can do to get it on the calendar? Also am I able to modify the calendar event title?Issue with Booking Confirmation Page Not Displaying, Leading to Customer Anxiety and Unnecessary Support Calls
I am writing to express my growing concern regarding the confirmation process in Zoho Bookings, particularly the inconsistent display of the confirmation page after a successful payment. As a mobile service provider, I rely on Zoho Bookings platform forNext Page