Visualize your data with a new set of charts: Treemap, Butterfly, Sankey, and Cluster charts in Zoho CRM
Dear customers,
When it comes to analytics, it's not just about the numbers; it's about understanding the story behind them.
With that philosophy in mind, we’re excited to introduce a line of representations to the existing array of chart types in Zoho CRM: Treemap, butterfly, sankey and cluster charts. Let's go!
Treemaps
Treemap charts are used to visually represent hierarchical datasets in a rectangular layout. It aligns its parent categories as larger tiles with their sub-categories nested within them. The size of each tile is proportional to its corresponding value, making it easy to compare different segments within the hierarchy.
This is how a treemap chart looks:

These structured data representations help you understand overall performance and contributions, as well as compare participating entities at a glance.
Unlike traditional bar charts or pie charts, treemaps can be used if your datasets are large and exhibit parent-child relationships.
Here are some examples to better understand their usage:
Comparing revenue distribution between functions
A company's revenue is distributed among its functions before it gets further disbursed to its employees. Treemap charts can be used to depict this distribution and compare it between functions. As you can see below, the hierarchy can be represented as a treemap to compare it directly with other functions:

The hierarchy at the top shows just the numbers and levels, but the treemap chart represents the numbers proportionally, allowing leaders to visualize the difference in distribution.
Interpretation: As you can easily see in the treemap, sales and marketing receive the same amount of revenue, while engineering is given significantly more than the other two.
Likewise, with treemap charts, you can:
- Compare popular lead sources with lead counts is the measure and lead source being the participating entity—a classic single-grouping configuration.
- View cost savings achieved across departments. With the departments as the grouping parameters and the cost saved as the measured amount, the chart lays out all the departments as tiles in proportion, based on money saved.
- Compare ad spends across channels, where channels are the parent grouping and ad spend is the measured unit.
Butterfly
Butterfly charts are used to compare two related datasets side-by-side, resulting in a representation that looks like a butterfly or tornado.
Now, how does it differ from bar charts?
The standard bar chart can compare two entities for a given measure. Say, you are comparing the performance of Mary and Charles. The two users' data is represented using bars, and the length will denote their performances. But, when it comes to comparing their performances over a period or their contribution across different stages, a bar chart is not sufficient.


With butterfly charts, you can:
- Compare revenue between two of your branches each month. With branches being compared for sum of sales revenue, grouped by closing date.
- Compare the performance of two reps in a given quarter. Compared between two users for average of amount of deals, grouped by closing date until today.
In addition to the user-based comparison above, butterfly charts are well-suited to visualizing other types of data comparisons, like:
- Picklist-based comparisons
- Duration-based comparisons
- Aggregate-based comparisons
Business scenario
Comparing the number of deals closed for each lead sources: Duration-based comparison
You can identify the productive lead source by comparing the number of deal closures for every lead source in your organization based on their closing week.

Analyzing effective sales methodology, inbound vs. outbound: Picklist-based comparison
Businesses use both inbound and outbound lead generation strategies, and each of these methods can reap different results based on the season and occasion. By comparing inbound versus outbound each month, you can identify which works best at what time.

Analyze the amount versus the expected revenue between accounts: Aggregate-based comparison
Expected revenue is a result of a deal's progression in the sales pipeline. Comparing the amount versus their expected revenue will not only help visualize the expected revenue of participating accounts but also indicate the accounts' stage in the sales pipeline.

Sankey
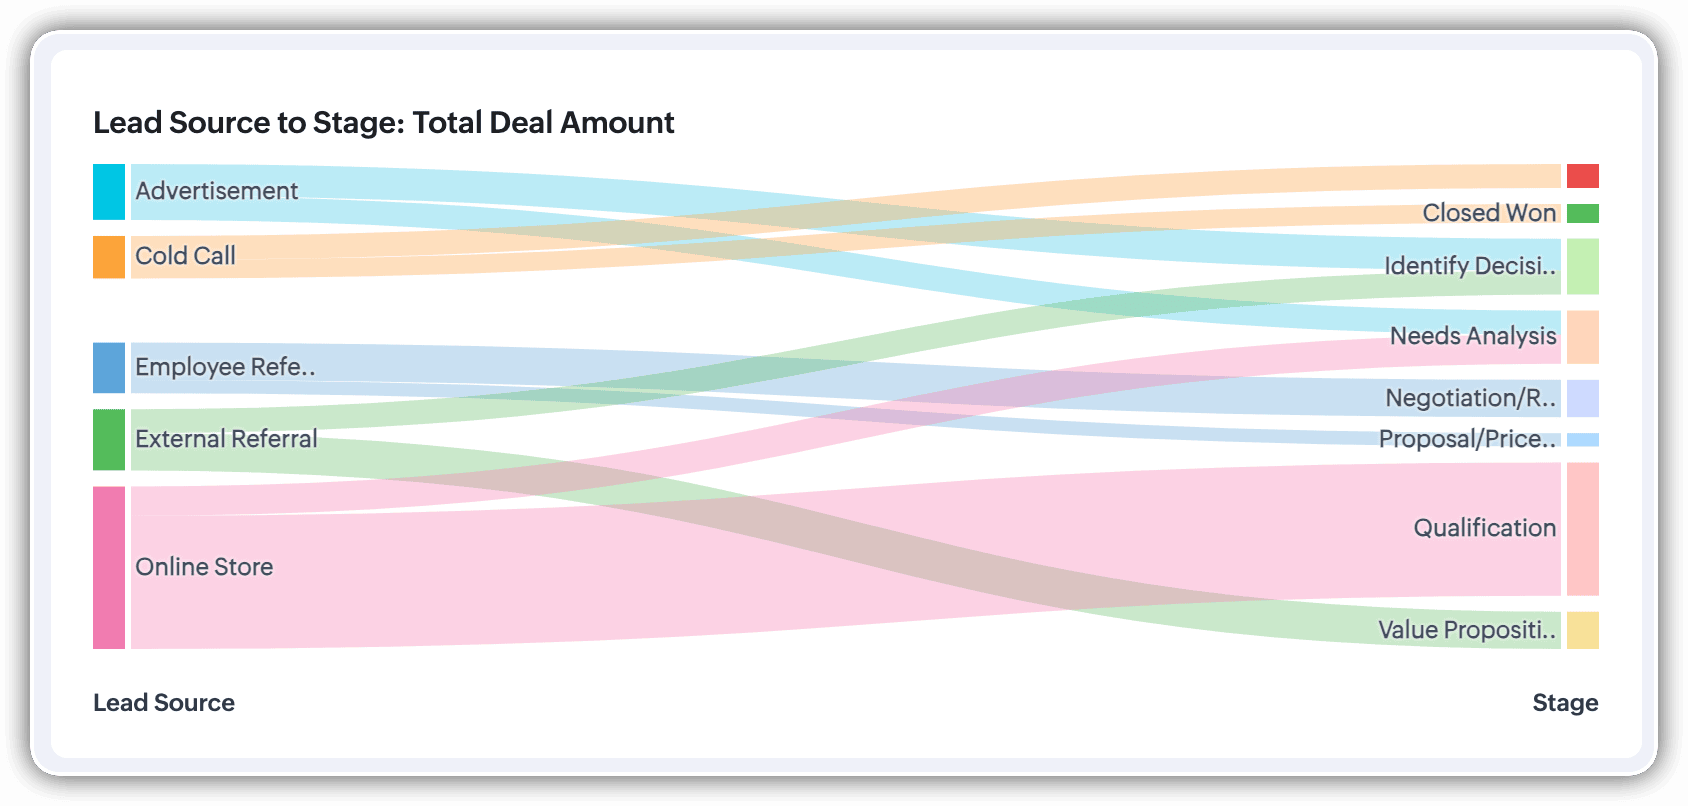
A Sankey Chart is designed to visualize the movement of data across different data groups. Unlike traditional charts—such as bar, column, pie, or donut—that mainly provide a static distribution of values, the Sankey Chart focuses on illustrating the flow between multiple segments or grouping fields. This makes it an ideal choice when you want to track how values (like lead counts, revenue, or deal statuses) move from one category to the next.

Key features
- Flow visualization: With the Sankey Chart, you can observe the movement of data between different groups.
- Multiple grouping fields: This chart works best when you have at least two grouping fields. You can go even further and add a third grouping to see an even more detailed mapping of your data flow.
- Simple configuration: The configuration for the Sankey Chart is as simple as any other chart type in Analytics.
Business scenarios:
Imagine you’re a sales manager trying to get a better handle on your team’s performance and your company’s pipeline. You want to understand not just how many deals are coming in, but also which sources are contributing the most value—and how those deals are progressing through different sales stages.
Let’s say you want to understand which lead sources are driving the most deal activity and how those deals progress through the pipeline. You can create a Sankey chart that maps the count of deals from Lead Source to Stage.

After analyzing the chart, you might notice that Online Store brings in a high volume of early-stage deals, while sources like External Referral contribute fewer deals that are more likely to reach advanced stages like Proposal or Negotiation.
This insight helps you prioritize nurturing the most profitable channels.
Sankey charts can also be helpful in other operational scenarios where understanding transitions across stages or teams is essential:
- Regional revenue distribution: Visualize how revenue flows across different regions, product categories, and their corresponding annual revenue. This helps you compare which regions contribute the most to each product line and where your high-value segments lie.
- Ticket handling flow: Visualize the flow of support tickets from their origin channel to internal departments and finally to resolution statuses. This can reveal workload imbalances or common points of delay in your support process.
Cluster
A cluster chart is similar to stacked column charts, but instead of stacking horizontally, the data is represented as vertical bars. As you create a column chart with multiple groupings, you can change the type of column chart to a cluster chart to achieve this representation.

In the above image, you can see the stacked column chart compares the number of lead conversions based on popular sources between countries. The stacks appearing on top of existing stacks ask you to calibrate the record count (y-axis) based on the previous stacks, which can lead to inaccurate interpretations. In this case, a cluster representation will paint a clearer picture of the analyses.
Other minor enhancements:
In addition to the three charts we mentioned above, we've also made the following minor changes:
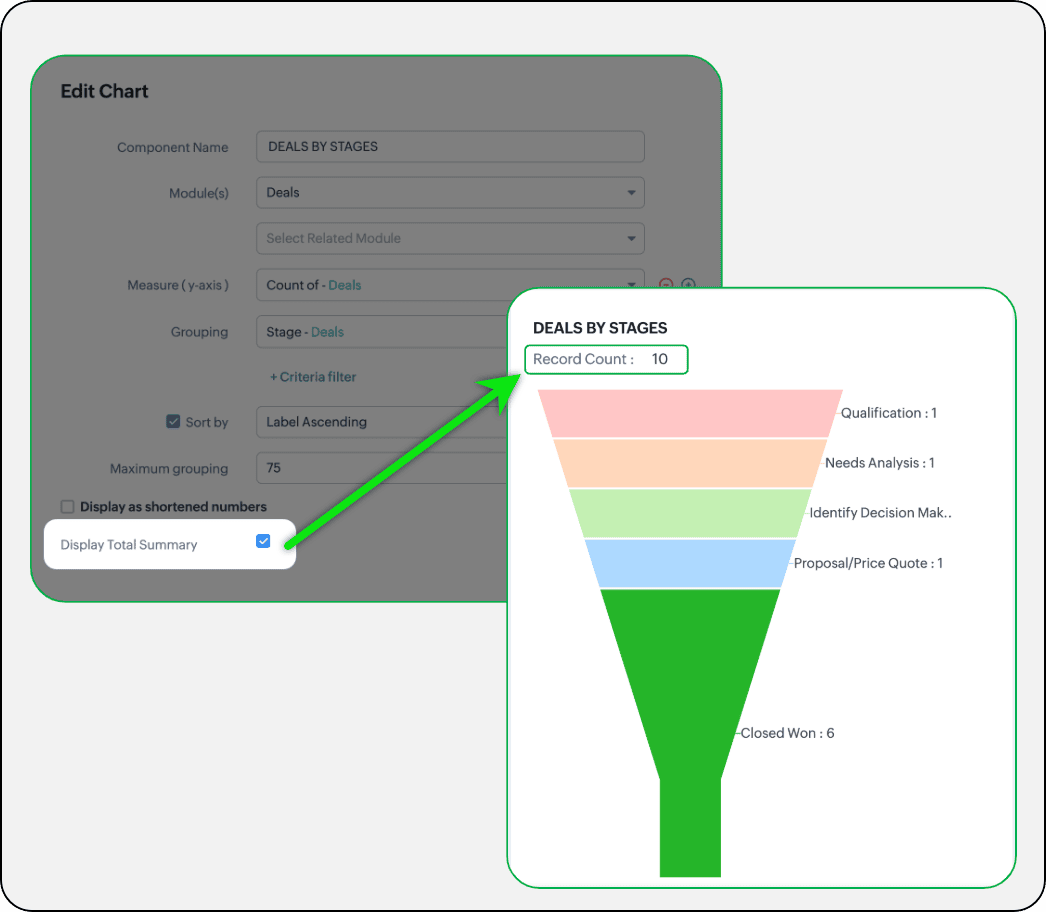
- Display total summary: Thus far, for all charts, each participating measure included labels. Now, to better understand overall contributions, a check box to display the total summary is provided under More options on the Chart Configuration page. Based on the configuration, the total revenue or the rolled-up quantities will be prominently displayed.
- Merge Y-axis: For charts that use two y-axis measurements, the intention is to view the progression of one entity against these two measures. Despite the scale, if the y-axis on the left is disproportionate to the values of the y-axis on the right, the plotted graph will result in a graphically and logically incorrect representation.
As you can see in the image below, the plot area of the sum of amount bar and the sum of expected revenue aligns close together, while, the difference between $700,000 and $40,500 is drastic, creating inaccurate interpretations.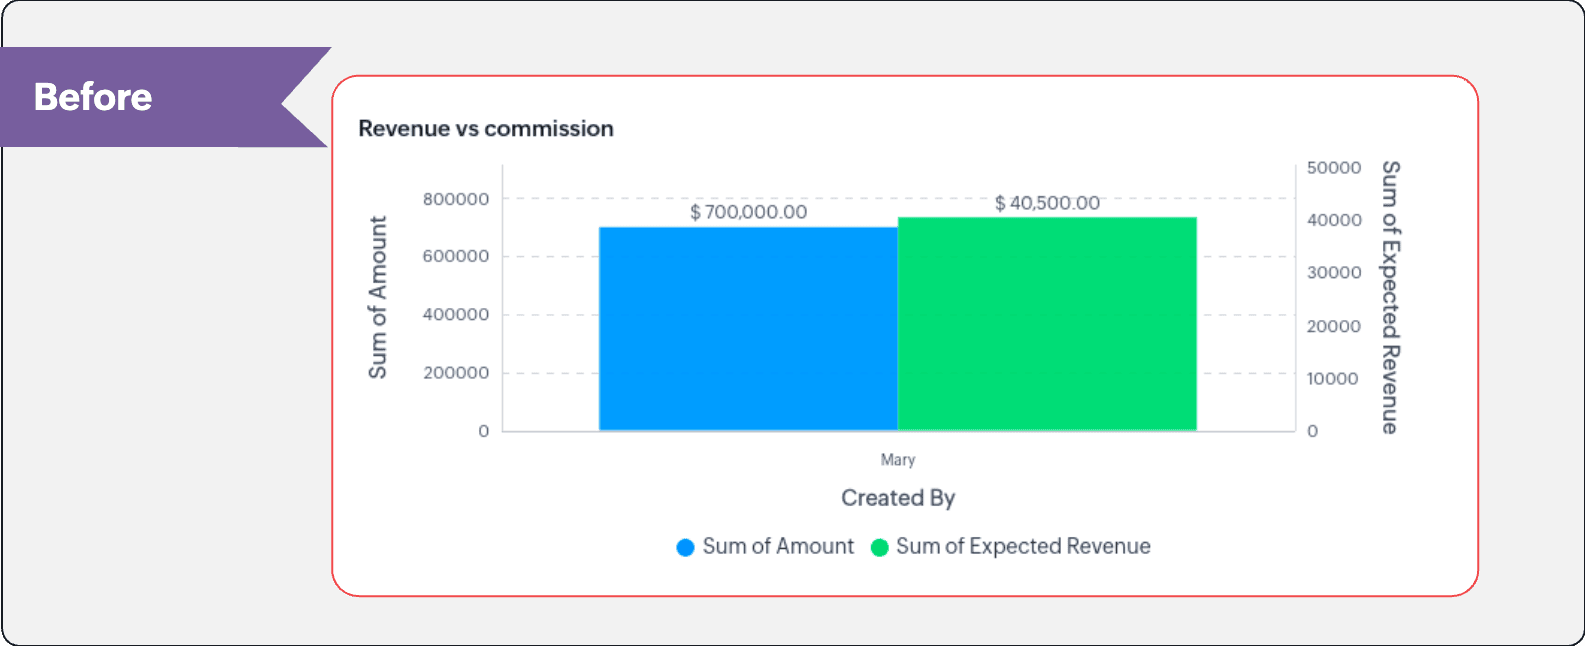
In this enhancement, we're allowing neighboring values of measures to merge so that the interpretation can be more visually accurate.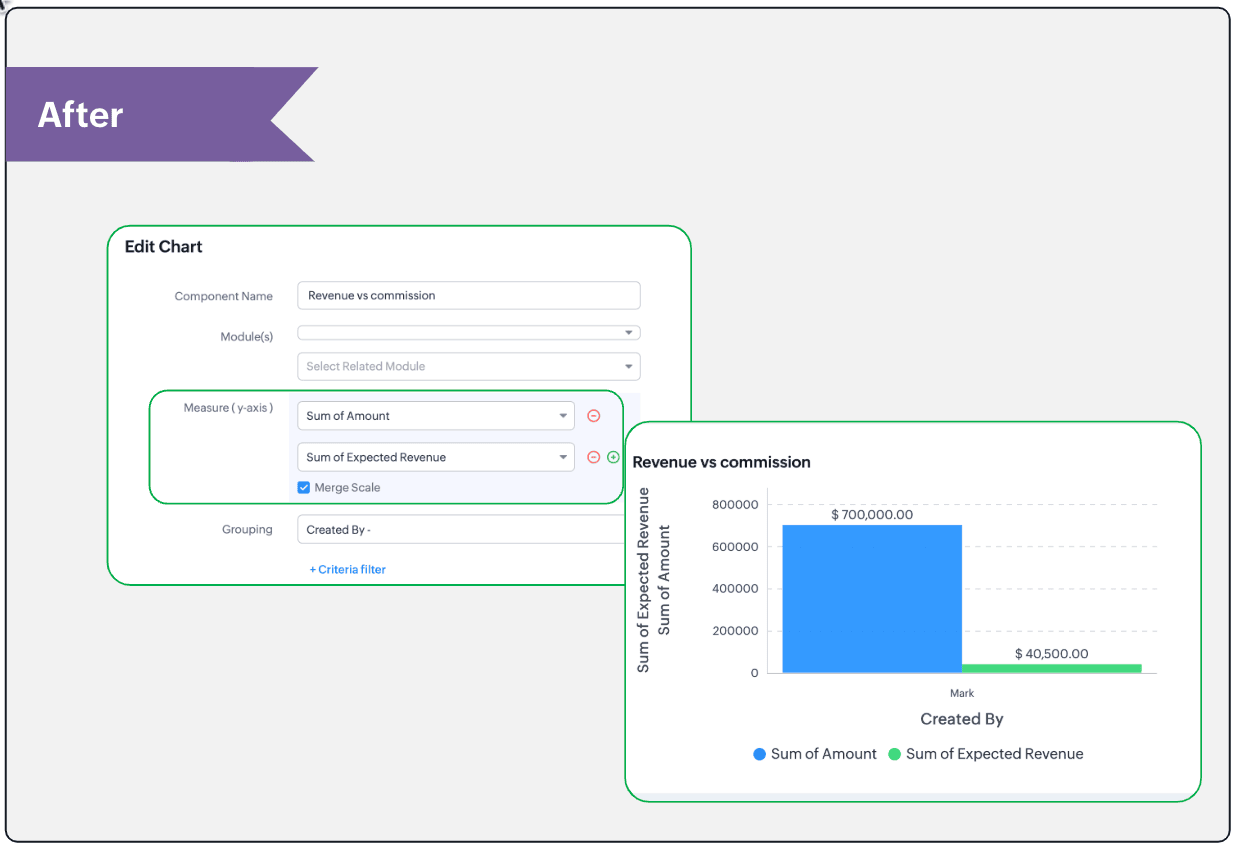
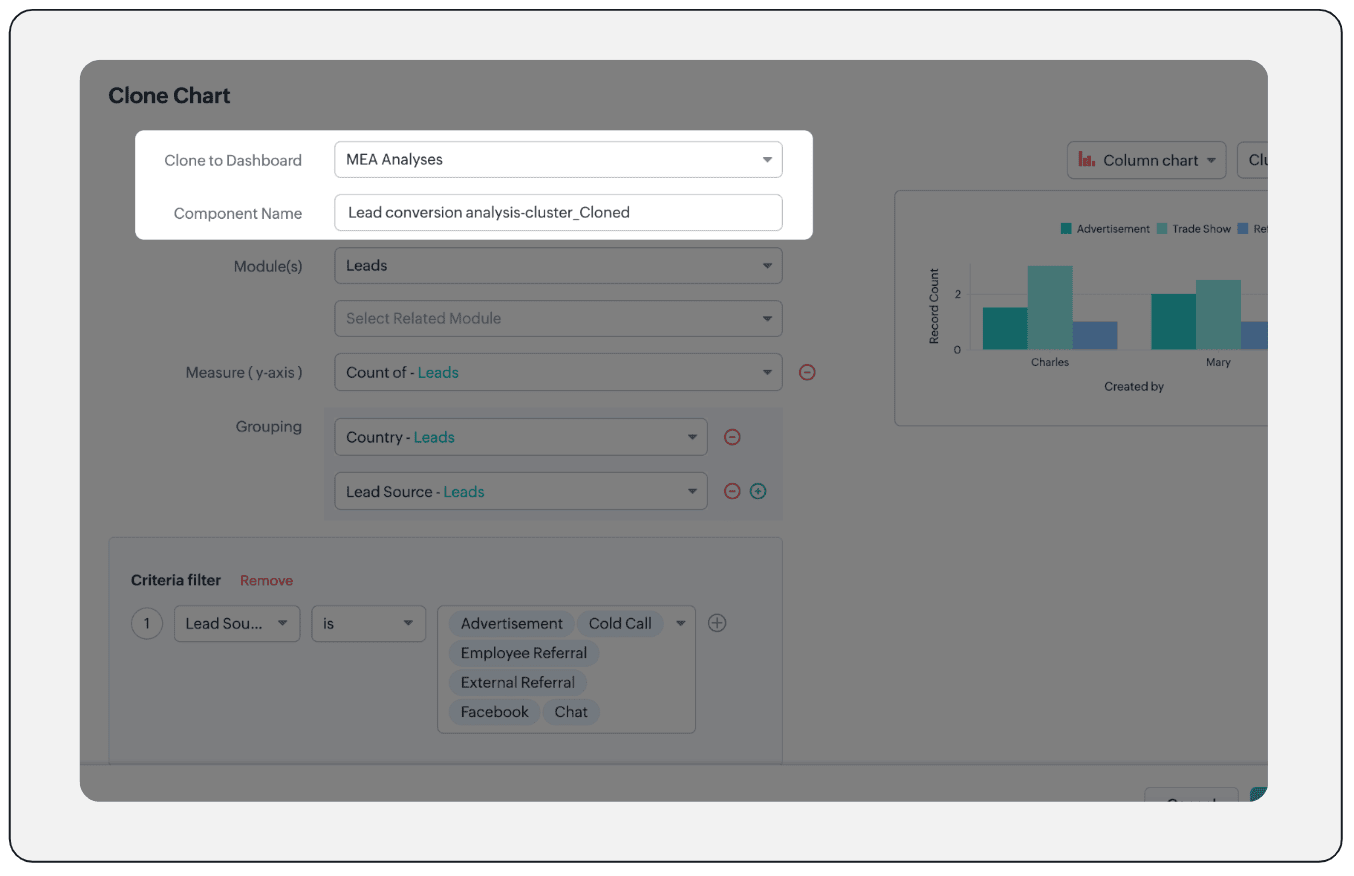
- Clone components to a different dashboard: Dashboards in Analytics serve in unique ways for various audiences—there can be separate dashboards for the sales team, marketing team, engineering team, and so on, and the chances of using the same measure for reference is common. Thus, when you clone a chart, you can now determine the target dashboard in which the cloned chart can be placed.
Resource: Help document
Thanks and have a good one!
Kind regards,
Saranya Balasubramanian
Saranya Balasubramanian
Topic Participants
Saranya Balasubramanian
Sticky Posts
Presenting ABM for Zoho CRM: Expand and retain your customers with precision
Picture this scenario: You're a growing SaaS company ready to launch a powerful business suite, and are looking to gain traction and momentum. But as a business with a tight budget, you know acquiring new customers is slow, expensive, and often deliversGood news! Calendar in Zoho CRM gets a face lift
Dear Customers, We are delighted to unveil the revamped calendar UI in Zoho CRM. With a complete visual overhaul aligned with CRM for Everyone, the calendar now offers a more intuitive and flexible scheduling experience. What’s new? Distinguish activitiesNimble enhancements to WhatsApp for Business integration in Zoho CRM: Enjoy context and clarity in business messaging
Dear Customers, We hope you're well! WhatsApp for business is a renowned business messaging platform that takes your business closer to your customers; it gives your business the power of personalized outreach. Using the WhatsApp for Business integrationConsumers are talking about your business. Are you listening?👂
A loyal customer might be praising your product in a forum. A frustrated user could be posting a harsh review on a public site. An excited partner may have left a comment on your campaign. A domain expert might be deconstructing your product. A prospectEnhancements to the formula field in Zoho CRM: Auto-refresh formulas with the "Now" function, stop formula executions based on criteria, and include formulas within formulas
Dear Customers, We hope you're well! By their nature, modern businesses rely every day on computations, whether it's to calculate the price of a product, assess ROI, evaluate the lifetime value of a customer, or even determine the age of a record. With
Recent Topics
openUrl in blueprints
My customer wants to open a URL at the end of a blueprint transition. Seems this isn't possible right now but it would be very useful. In this thread, https://help.zoho.com/portal/en/community/topic/openurl-not-working the Zoho agent said that it's logicallyIs it possible to pull the Zoho desk data into Zoho analytics in real time
Hi - I am looking to add more dashboards and reports of Zoho Desk in analytics. I see there is a schedule to pull the data into analytics, but I'm wondering if there is an option to pull the data in real time instead of a specific interval?CRM x WorkDrive: File storage for new CRM signups is now powered by WorkDrive
Availability Editions: All DCs: All Release plan: Released for new signups in all DCs. It will be enabled for existing users in a phased manner in the upcoming months. Help documentation: Documents in Zoho CRM Manage folders in Documents tab Manage filesIntroducing the revamped What's New page
Hello everyone! We're happy to announce that Zoho Campaigns' What's New page has undergone a complete revamp. We've bid the old page adieu after a long time and have introduced a new, sleeker-looking page. Without further ado, let's dive into the mainAbility to Add YouTube Video to Playlist During Publishing
Hi Zoho Social Team, How are you? While publishing YouTube videos through Zoho Social, we noticed that the platform currently does not allow selecting a playlist at the time of publishing. Instead, we can only add the video to a playlist after it hasIntroducing Zoho Creator's 2025 Release Projection 2
Hello Creators! I'm Prakash, from the Creator product management team, and today I'm delighted to unveil our next set of features as part of Release Projection 2 for 2025. With thoughtful analysis and planning, we've curated powerful new capabilitiesSharing Form Ownership Among Multiple Users
I would really like the ability to share form ownership among multiple users. It's frustrating to me that if a co-worker wants to make an edit to a form, I have to transfer ownership to them. It would be great if forms could act like google forms, where multiple people can edit a form and view responses.Marketer’s Space - Ace Your Spooky-Season Marketing with Pre-designed Templates in Zoho Campaigns
Hello marketers, Welcome back to another post in Marketer’s Space! We’re in Q4, which means that you have endless opportunities to connect with your audience, starting with Halloween campaigns! In this post, we’ll show you how to design the perfect HalloweenZia expands to China with native features and DeepSeek-powered generative AI features
Hello everyone, We are glad to support Zia native features and Zia generative AI features for our customers in China. From hereon, all AI-features in Desk will be accessible in China data center with the integration of DeepSeek generative AI model. DeepSeekEmail in each module
We have a contact ,module which then has a link to customer assets which in turn the asset has a multiple link to service visits. When we link assets to customers we choose by name and it brings over the associate email via the lookup. Great feature.Global Search placement in the new UI
Having a hard time with the global search placement in the UI redesign. Surely I can't be the only one. Previously global search placement was perfect. A bar at the top/center of the page. Exactly where you would expect it to be. Since the new UI hasIntroducing Skill-Based Ticket Assignment
The goal of every support team is to provide great support, and to do so as fast as they can. To make this possible, it is important that agents spend their time judiciously, especially when they're dealing with a large number of tickets of varying urgencyKaizen #213 - Workflow APIs - Part 1
Welcome to another week of Kaizen! If you have ever managed complex business processes, you know that Workflows are the quiet backbone of any well-run business process. They keep things moving; assigning owners, sending alerts, keeping deals on track,Browser and address bar hide
Hi, How i can do hide the address bar with browser headline when i am working on the sheet, because i am using (freeze panes) which i want visible for full work. For your reference here i am attached the screen shot and marked yellow lines which reallyCells Border
Hi I am using Zoho Sheet on S Tab , is there any option to make all border of any cell at once. I think this is very basic which we are missing. This is available in mobile but not in tab or suggest if i am missing this function. And for Tab can you giveCredit Management: #2 Configuring Right Payment Terms for Credit Control
Think about the last time you ordered something online and saw that little note at the checkout, "Pay on Delivery" or "Pay later". It's simple, but it actually sets the tone. As a business owner, you know exactly when payment is expected. Now, imagineZobot and Sales IQ
What will happen to the Zoho Sales IQ being integrated to the website after creating the Zobot on the website tooWorkflow workdrive rollout
Hi! When will workflow be rolled out to all users? Thanks.Help Center and SEO: Any Benefit to My Domain-Mapped Website Ranking?
First of, I love the Help Center which I've just decided to integrate into my website to replace its old-fashioned FAQs. So much more to achieve there now! Lots of new benefits to the site visitors and to me in terms of organizing and delivering all theBlueprint status change
I want to change the Blueprint status of a workflow. The status is completed automatically when I added the record through API call. But I want to make it active, I don't see any options for this. Even if I draw transition from any stage , it is not visibleSupport french language options
Greetings, I want to use Zoho with the french language portal, however the supplied translation is not very good (google translate). There are many basic mistakes on the main most important sections (my requests, submit a request). Is there a way forAutomation #7 - Auto-update Email Content to a Ticket
This is a monthly series where we pick some common use cases that have been either discussed or most asked about in our community and explain how they can be achieved using one of the automation capabilities in Zoho Desk. Email is one of the most commonlyfilter broke my data
I uploaded a file recently from Sheets and it has top 2 rows frozen, with table headers in second row and each one is filterable. somehow my first 2 columns became unfiltered and no matter what I do I cannot reapply the filter?? also didn't realize theyIntroducing the Workflow and Actions APIs for Zoho CRM
We are absolutely thrilled to announce the release of Workflow APIs and Actions APIs in Zoho CRM’s v8 API suite! This powerful new set of endpoints gives developers unprecedented programmatic control over business automation. For years, Workflow RulesZoho CRM Analytics - Allow To Reorder Dashboards
I would like to suggest that you add the ability to reorder dashboards in the Analytics Module. I can see that this has been requested some time ago, the latest 9 years ago. I am not sure if this is a big or small endeavor, but such a small fix can goZoho Form URL displays incorrect name
Hi, I have a form I created called "Design Request form". It displays this way everywhere I look. However, in the URL, it shows up as "DesignJobRequestFormFINAL011325PROOFV1B" and I'm not sure why. I can't find where to fix this. Does anyone have anyConsumers are talking about your business. Are you listening?👂
A loyal customer might be praising your product in a forum. A frustrated user could be posting a harsh review on a public site. An excited partner may have left a comment on your campaign. A domain expert might be deconstructing your product. A prospectWhat counts as a Temp for Billing Purposes in Workerly
I'm considering trying this product but am not sure how the temp count is used for billing purposes. For example, if we keep a large data base of 500 potential workers.....are we billed for that or only if they are assigned to a client at a given pointForm name incorrectly displayed in URL
Hi, I have a form I created called "Design Request form". It displays this way everywhere I look. However, in the URL, it shows up as "DesignJobRequestFormFINAL011325PROOFV1B" and I'm not sure why. I can't find where to fix this. Does anyone have anyI can't receive mail
Hello, I can't receive e-mail. I no longer receive e-mails to the e-mail I received for my site. I also edited the DNS settings, but it doesn't work at all.1‑to‑1 invite missing post-setup (needs re-invite) vs channel invite auto-joins without business prompt
1. Zoho Cliq 1‑to‑1 external invite The inviter sent a 1‑to‑1 invite to an invitee who didn’t have a Cliq account. After the invitee completed account setup and created a business/organization, the website redirected them to Cliq, where they opened Cliq【開催報告】東京 ユーザー交流会 Vol.3 2025/10/17 Zoho サービスの活用促進を外部ツールとの連携で実現!
ユーザーの皆さま、こんにちは。コミュニティチームの藤澤です。 10月17日(金)に新橋で「東京 ユーザー交流会 Vol.3」を開催しました。ご参加くださったユーザーの皆さま、ありがとうございました! この投稿では、当日のセッションの様子や使用した資料を紹介しています。残念ながら当日お越しいただけなかった方も、ぜひチェックしてみてください😊 ユーザー活用事例セッション:Zoho Flowと決済システムの連携 あみろくの岡島さんに、Zoho サービスの活用事例として、Zoho Flow を活用した外部サービスとの連携事例をご共有いただきました。received email opens in a new tab every time I log in
as per the title: since about when I first made my email account, every single time Ive logged in to view my inbox, a new tab opens for an email I viewed once as if restoring a closed session. I thought I just didnt understand the "starting up" settingsEngage with your customers at scale using WhatsApp Marketing Template messages
Hi everyone, To make it easier for organizations to communicate with customers, Desk now allows you to send individual, mass, and bulk WhatsApp template messages from both the Ticket and Contact modules. How is this going to benefit your business? WhatsAppImportation Tickets error
Hi, I'm newbie here 🤓 So, i'm importing data from csv, but when I try advance to mapping fields the importer tool show this message: Previously I try import, other data, and not show errors in this step. Some ideas? Best Regards,Showing description in timesheet and timelogs.
I am wondering if it’s possible in version 5 of Zoho People to have the description show by default or with a manipulation on the user’s part. Let me show you what I mean. As you can see this is the view for the users. Now if they want to see the fullDirect “Add to Google Calendar” Option in Zoho Meeting
Hello Zoho Meeting Team, Hope you are doing well. We would like to request an enhancement related to the “Add to Calendar” functionality in Zoho Meeting. Currently, when we open Zoho Meeting and view our meetings under My Calendar, there is an Add toWorkaround: openURL in Blueprints - An alternate approach
There is a roundabout way to open a URL in blueprints after a save event. By using the 'onBeforeMandatoryFormSave' in Client Script, you can open an external URL. Now, the problem is, this is designed to be run BEFORE the blueprint is saved, not after,MTD SA in the UK
Hello ID 20106048857 The Inland Revenue have confirmed that this tax account is registered as Cash Basis In Settings>Profile I have set ‘Report Basis’ as “Cash" However, I see on Zoho on Settings>Taxes>Income Tax that the ‘Tax Basis’ is marked ‘Accrual'Migrate file from Single File Upload to Multi File Upload
Dears, I have created a new field Multi File Upload to replace the old Single File Upload field. I'd like to ask you guys what is the best way to migrate the files to the new field?Next Page