Visualize your data with a new set of charts: Treemap, Butterfly, Sankey, and Cluster charts in Zoho CRM
Dear customers,
When it comes to analytics, it's not just about the numbers; it's about understanding the story behind them.
With that philosophy in mind, we’re excited to introduce a line of representations to the existing array of chart types in Zoho CRM: Treemap, butterfly, sankey and cluster charts. Let's go!
Treemaps
Treemap charts are used to visually represent hierarchical datasets in a rectangular layout. It aligns its parent categories as larger tiles with their sub-categories nested within them. The size of each tile is proportional to its corresponding value, making it easy to compare different segments within the hierarchy.
This is how a treemap chart looks:

These structured data representations help you understand overall performance and contributions, as well as compare participating entities at a glance.
Unlike traditional bar charts or pie charts, treemaps can be used if your datasets are large and exhibit parent-child relationships.
Here are some examples to better understand their usage:
Comparing revenue distribution between functions
A company's revenue is distributed among its functions before it gets further disbursed to its employees. Treemap charts can be used to depict this distribution and compare it between functions. As you can see below, the hierarchy can be represented as a treemap to compare it directly with other functions:

The hierarchy at the top shows just the numbers and levels, but the treemap chart represents the numbers proportionally, allowing leaders to visualize the difference in distribution.
Interpretation: As you can easily see in the treemap, sales and marketing receive the same amount of revenue, while engineering is given significantly more than the other two.
Likewise, with treemap charts, you can:
- Compare popular lead sources with lead counts is the measure and lead source being the participating entity—a classic single-grouping configuration.
- View cost savings achieved across departments. With the departments as the grouping parameters and the cost saved as the measured amount, the chart lays out all the departments as tiles in proportion, based on money saved.
- Compare ad spends across channels, where channels are the parent grouping and ad spend is the measured unit.
Butterfly
Butterfly charts are used to compare two related datasets side-by-side, resulting in a representation that looks like a butterfly or tornado.
Now, how does it differ from bar charts?
The standard bar chart can compare two entities for a given measure. Say, you are comparing the performance of Mary and Charles. The two users' data is represented using bars, and the length will denote their performances. But, when it comes to comparing their performances over a period or their contribution across different stages, a bar chart is not sufficient.


With butterfly charts, you can:
- Compare revenue between two of your branches each month. With branches being compared for sum of sales revenue, grouped by closing date.
- Compare the performance of two reps in a given quarter. Compared between two users for average of amount of deals, grouped by closing date until today.
In addition to the user-based comparison above, butterfly charts are well-suited to visualizing other types of data comparisons, like:
- Picklist-based comparisons
- Duration-based comparisons
- Aggregate-based comparisons
Business scenario
Comparing the number of deals closed for each lead sources: Duration-based comparison
You can identify the productive lead source by comparing the number of deal closures for every lead source in your organization based on their closing week.

Analyzing effective sales methodology, inbound vs. outbound: Picklist-based comparison
Businesses use both inbound and outbound lead generation strategies, and each of these methods can reap different results based on the season and occasion. By comparing inbound versus outbound each month, you can identify which works best at what time.

Analyze the amount versus the expected revenue between accounts: Aggregate-based comparison
Expected revenue is a result of a deal's progression in the sales pipeline. Comparing the amount versus their expected revenue will not only help visualize the expected revenue of participating accounts but also indicate the accounts' stage in the sales pipeline.

Sankey
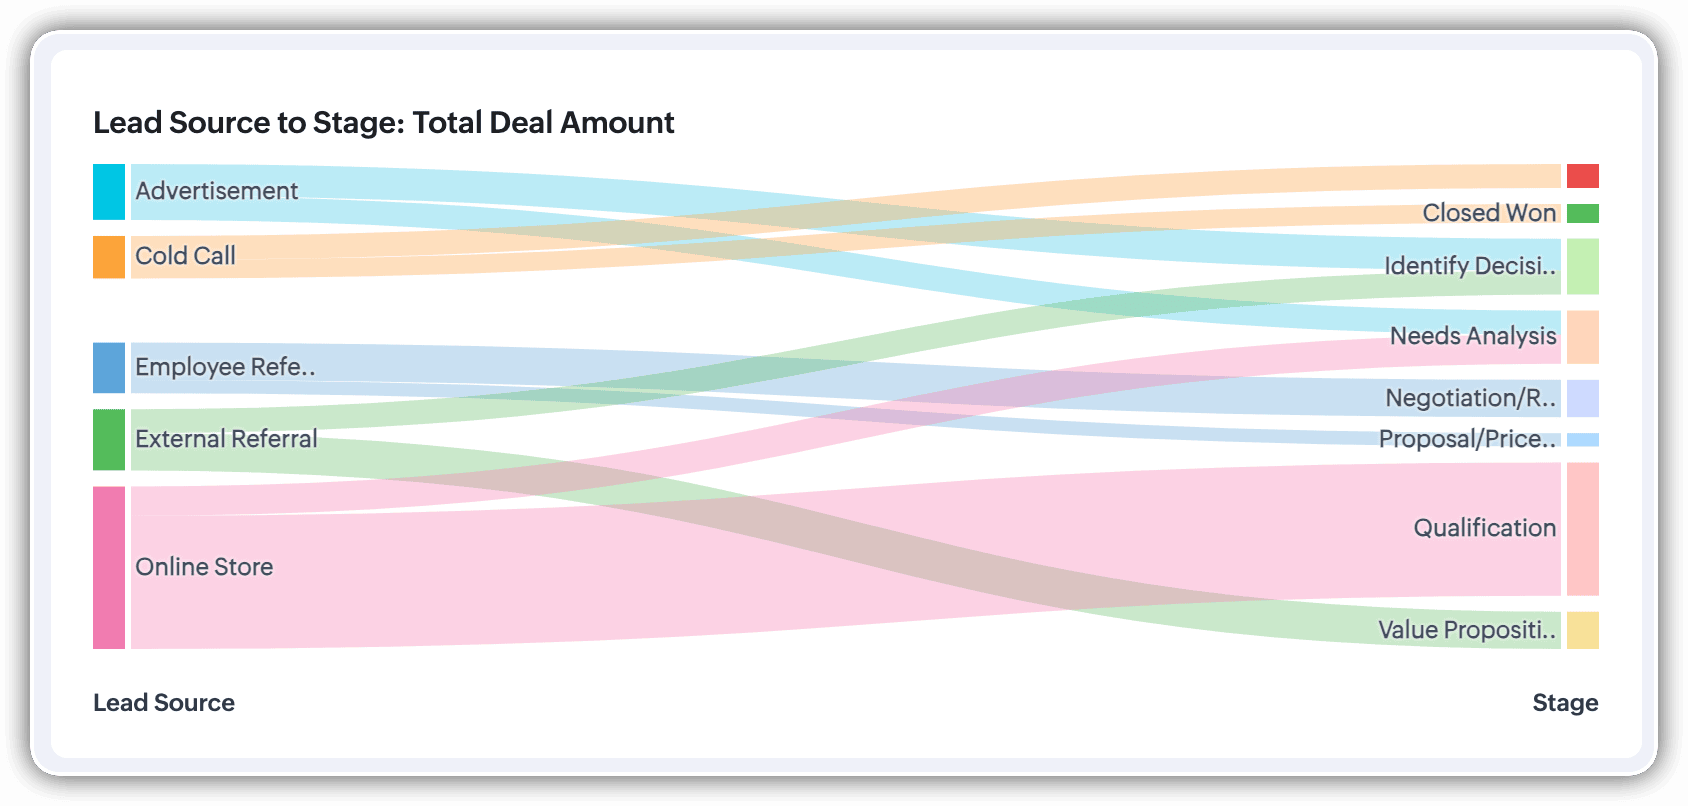
A Sankey Chart is designed to visualize the movement of data across different data groups. Unlike traditional charts—such as bar, column, pie, or donut—that mainly provide a static distribution of values, the Sankey Chart focuses on illustrating the flow between multiple segments or grouping fields. This makes it an ideal choice when you want to track how values (like lead counts, revenue, or deal statuses) move from one category to the next.

Key features
- Flow visualization: With the Sankey Chart, you can observe the movement of data between different groups.
- Multiple grouping fields: This chart works best when you have at least two grouping fields. You can go even further and add a third grouping to see an even more detailed mapping of your data flow.
- Simple configuration: The configuration for the Sankey Chart is as simple as any other chart type in Analytics.
Business scenarios:
Imagine you’re a sales manager trying to get a better handle on your team’s performance and your company’s pipeline. You want to understand not just how many deals are coming in, but also which sources are contributing the most value—and how those deals are progressing through different sales stages.
Let’s say you want to understand which lead sources are driving the most deal activity and how those deals progress through the pipeline. You can create a Sankey chart that maps the count of deals from Lead Source to Stage.

After analyzing the chart, you might notice that Online Store brings in a high volume of early-stage deals, while sources like External Referral contribute fewer deals that are more likely to reach advanced stages like Proposal or Negotiation.
This insight helps you prioritize nurturing the most profitable channels.
Sankey charts can also be helpful in other operational scenarios where understanding transitions across stages or teams is essential:
- Regional revenue distribution: Visualize how revenue flows across different regions, product categories, and their corresponding annual revenue. This helps you compare which regions contribute the most to each product line and where your high-value segments lie.
- Ticket handling flow: Visualize the flow of support tickets from their origin channel to internal departments and finally to resolution statuses. This can reveal workload imbalances or common points of delay in your support process.
Cluster
A cluster chart is similar to stacked column charts, but instead of stacking horizontally, the data is represented as vertical bars. As you create a column chart with multiple groupings, you can change the type of column chart to a cluster chart to achieve this representation.

In the above image, you can see the stacked column chart compares the number of lead conversions based on popular sources between countries. The stacks appearing on top of existing stacks ask you to calibrate the record count (y-axis) based on the previous stacks, which can lead to inaccurate interpretations. In this case, a cluster representation will paint a clearer picture of the analyses.
Other minor enhancements:
In addition to the three charts we mentioned above, we've also made the following minor changes:
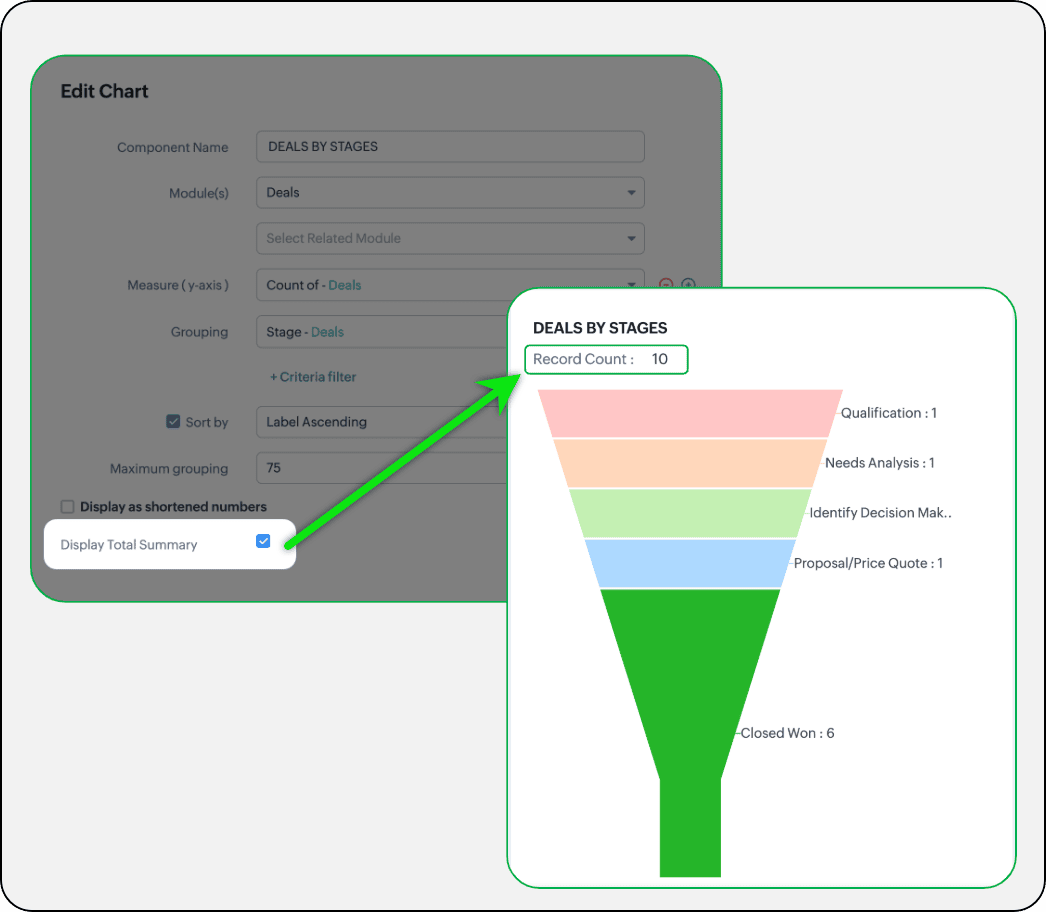
- Display total summary: Thus far, for all charts, each participating measure included labels. Now, to better understand overall contributions, a check box to display the total summary is provided under More options on the Chart Configuration page. Based on the configuration, the total revenue or the rolled-up quantities will be prominently displayed.
- Merge Y-axis: For charts that use two y-axis measurements, the intention is to view the progression of one entity against these two measures. Despite the scale, if the y-axis on the left is disproportionate to the values of the y-axis on the right, the plotted graph will result in a graphically and logically incorrect representation.
As you can see in the image below, the plot area of the sum of amount bar and the sum of expected revenue aligns close together, while, the difference between $700,000 and $40,500 is drastic, creating inaccurate interpretations.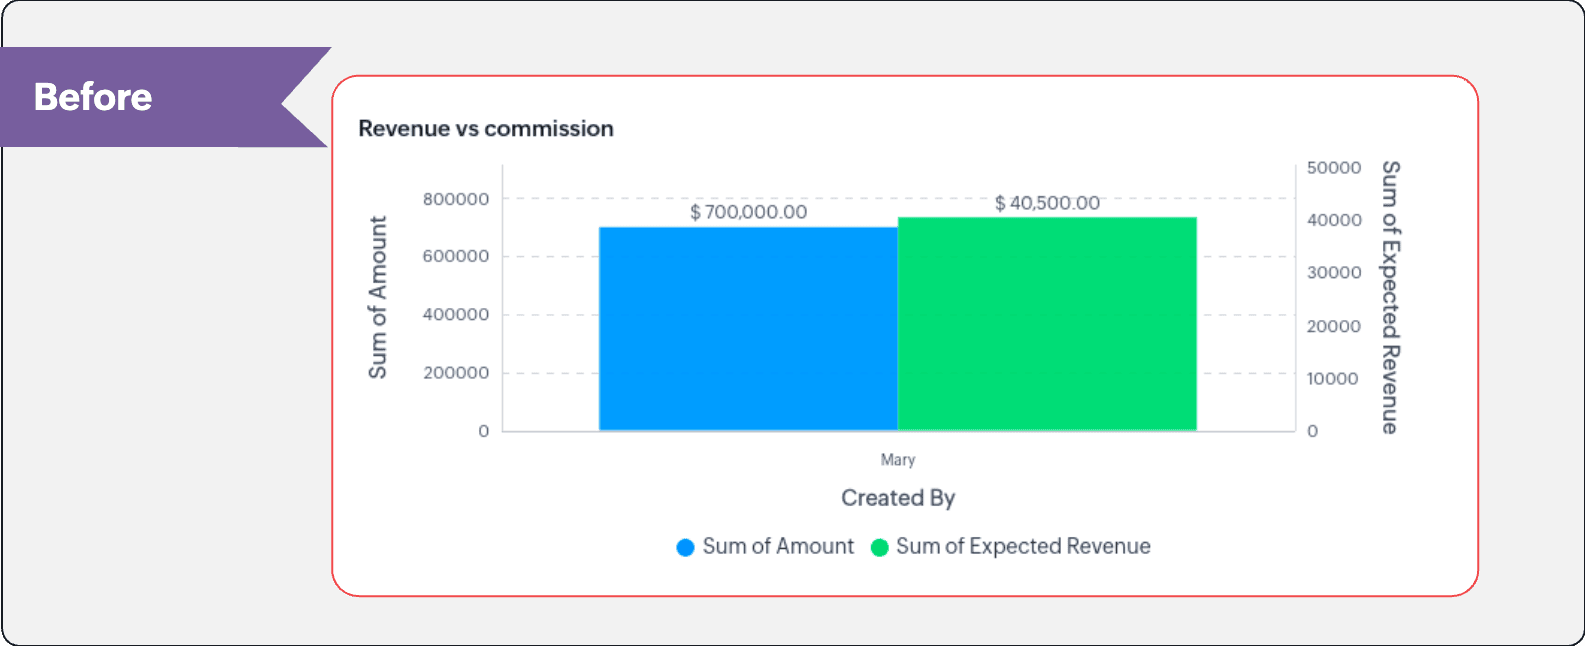
In this enhancement, we're allowing neighboring values of measures to merge so that the interpretation can be more visually accurate.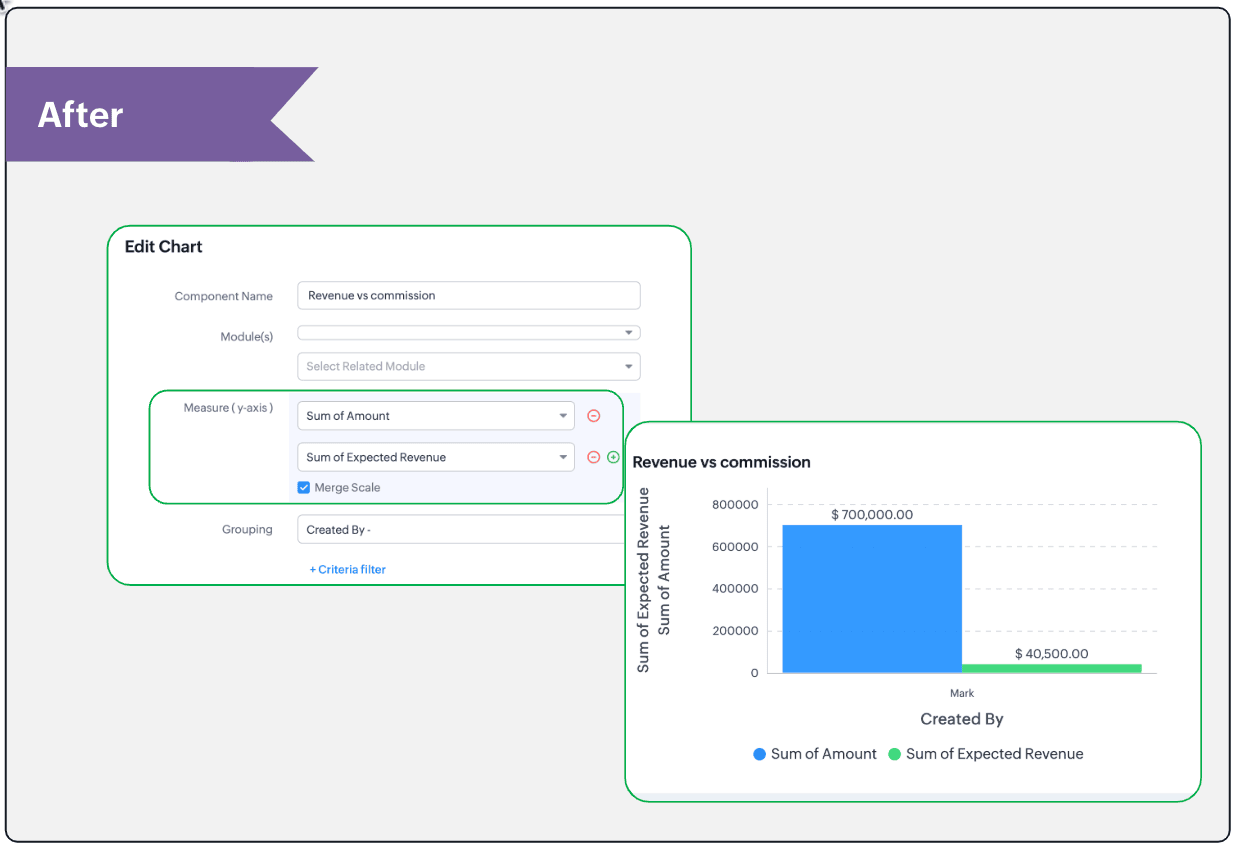
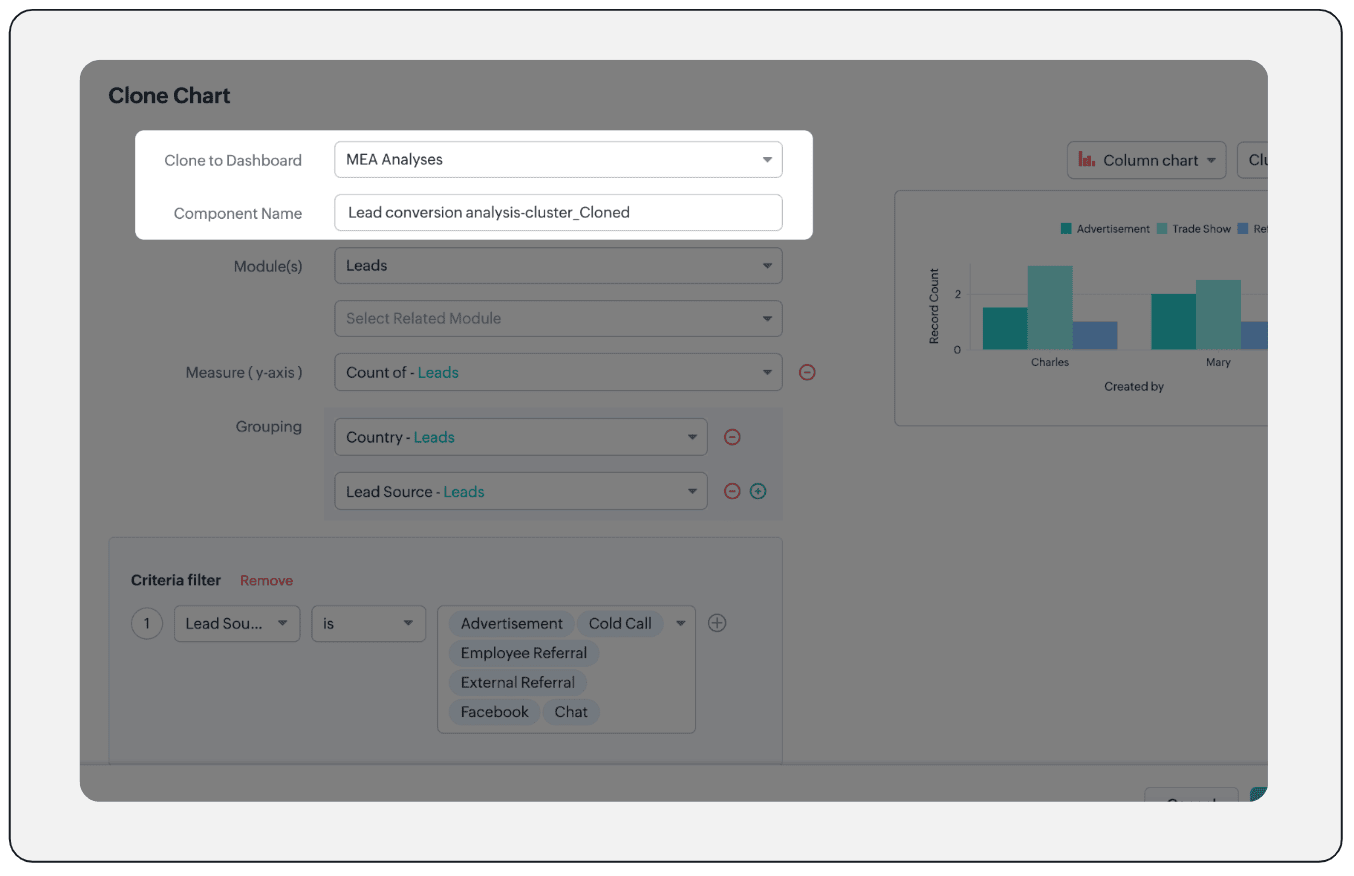
- Clone components to a different dashboard: Dashboards in Analytics serve in unique ways for various audiences—there can be separate dashboards for the sales team, marketing team, engineering team, and so on, and the chances of using the same measure for reference is common. Thus, when you clone a chart, you can now determine the target dashboard in which the cloned chart can be placed.
Resource: Help document
Thanks and have a good one!
Kind regards,
Saranya Balasubramanian
Saranya Balasubramanian
Topic Participants
Saranya Balasubramanian
Sticky Posts
Good news! Calendar in Zoho CRM gets a face lift
Dear Customers, We are delighted to unveil the revamped calendar UI in Zoho CRM. With a complete visual overhaul aligned with CRM for Everyone, the calendar now offers a more intuitive and flexible scheduling experience. What’s new? Distinguish activitiesNimble enhancements to WhatsApp for Business integration in Zoho CRM: Enjoy context and clarity in business messaging
Dear Customers, We hope you're well! WhatsApp for business is a renowned business messaging platform that takes your business closer to your customers; it gives your business the power of personalized outreach. Using the WhatsApp for Business integrationPresenting ABM for Zoho CRM: Expand and retain your customers with precision
Picture this scenario: You're a growing SaaS company ready to launch a powerful business suite, and are looking to gain traction and momentum. But as a business with a tight budget, you know acquiring new customers is slow, expensive, and often deliversConsumers are talking about your business. Are you listening?👂
A loyal customer might be praising your product in a forum. A frustrated user could be posting a harsh review on a public site. An excited partner may have left a comment on your campaign. A domain expert might be deconstructing your product. A prospectEnhancements to the formula field in Zoho CRM: Auto-refresh formulas with the "Now" function, stop formula executions based on criteria, and include formulas within formulas
Dear Customers, We hope you're well! By their nature, modern businesses rely every day on computations, whether it's to calculate the price of a product, assess ROI, evaluate the lifetime value of a customer, or even determine the age of a record. With
Recent Topics
How to send certain invoices for Approval based on condition?
To streamline operations, I need the invoices to go for approval when certain conditions are met. For example, if my staff gives a discount of x amount, it must go for approval. If there is no discount, then the invoice will be approved automatically.Unable to continue payment
Hi, I want to make a payment for my email subscription, but I cannot proceed with the payment because my NITKU is invalid. In Indonesia, the NITKU consists of 22 digits, but Zoho only provides 20 digits, causing my NITKU to be invalid. Please help meIs there a way to show contact emails in the Account?
I know I can see the emails I have sent and received on a Contact detail view, but I want to be able to see all the emails that have been sent and received between all an Accounts Contacts on the Account Detail view. That way when I see the Account detailMassive spam pretending to come from our address – is this a Zoho security issue?
Hi, We’ve been receiving more and more suspicious emails lately — many of them clearly look like scams. But yesterday, we got an email that appeared to be sent from our own address, which was very concerning. We're starting to wonder if this might beCant recieve mails
I’m having an issue with my external IMAP account not fetching any emails into Zoho Mail, even though the connection test says “Success”. I can send, if someone sends an email to me. my original directory (home.pl host) recieves it in their portal butZoho Sheet Autofit Data
While using Autofit Data function in Zoho Sheets with Devnagri Maratji or Hindi Fonts, a word or a number, it keeps couple of characters outside the right side border.Enhancements to finance suite integrations
Update on the migration (October 28, 2025): Starting this week (October 29 tentatively), we’ll begin migrating Zoho CRM users to Zoho Books as integration users. This means actions will now run under each user’s own Zoho Books access, instead of the admin’s.Edit 'my' Notes only
The permissions around Notes should be more granular, and allow to user to be able to edit the notes he created only. The edit Notes permission is useful as it allows the user to correct any mistakes or add information as needed. However, with this sameHow do I filter contacts by account parameters?
Need to filter a contact view according to account parameter, eg account type. Without this filter users are overwhelmed with irrelevant contacts. Workaround is to create a custom 'Contact Type' field but this unbearable duplicity as the information alreadyJob Alerts for Candidates
hi All, I have 2 questions relating to sharing job details with candidates. 1. is there a way to notify candidates that meet certain criteria of current jobs available? eg. I run a candidate search, and identify 50 candidates that might be suitable. CanAdd multiple users to a task
When I´m assigning a task it is almost always related to more than one person. Practical situation: When a client request some improvement the related department opens the task with the situation and people related to it as the client itself, the salesmanEnhancing Task Accuracy: Automatically notify the owners upon Task duplication.
Hello Everyone, A Custom function is a user-written set of code to achieve a specific requirement. Set the required conditions needed as when to trigger using the Workflow rules (be it Tasks / Project) and associate the custom function to it. The requirementShow/ hide specific field based on user
Can someone please help me with a client script to achieve the following? I've already tried a couple of different scripts I've found on here (updating to match my details etc...) but none of them seem to work. No errors flagged in the codes, it justWhere are Kanban swimlanes
So i've been playing with Zoho Projects Kanban view a bit more. It appears that task lists are being used as the Kanban columns, which makes sense from the implementation point of view but not the logical one. Kanban columns are statuses that a task can flow through, while a task list has been a logical way to organize related tasks and relate them to a mislestone. In other words a task in a particular task can go through several stages while remaining in the same task list. After doing some researchTip 19: How to display images in Pages using ZML snippets
Hi folks, We're back with another tip on how to use Zoho Markup Language (ZML) to create interactive pages in Zoho Creator. You can use ZML snippets to add various kinds of components to your pages and structure them in meaningful ways. That's not all, though—using ZML you can ensure your application is automatically compatible with all kinds of devices without any inconsistencies. We often get questions from users about how to invoke Deluge scripts within ZML code. Here's a simple use case for addingCan zoho swign format block text spacing automatically when prefilled from zoho crm?
I'm sending zoho sign template from zoho crm, so that zoho crm pre-populates most fields. I have existing pdf documents that i am having signed. I have no ability to change the pdf documents, they are standardized government forms. The problem I am facingZoho Inventory / Finance Suite - Add feature to prevent duplicate values in Item Unit field
I've noticed that a client has 2 values the same in the Unit field on edit/create Items. This surprised me as why would you have 2 units with the same name. Please consider adding a feature which prevents this as it seems to serve no purpose.Reference lookup field values in Client script
hello all, I'm using a "ZDK.Apps.CRM.Products.searchByCriteria" function call, which is returning the matching records correctly; however, one of the fields is a lookup field which I need the associated data. I believe there is a way to get this dataIn App Auto Refresh/Update Features
Hi, I am trying to use Zoho Creator for Restaurant management. While using the android apps, I reliased the apps would not auto refresh if there is new entries i.e new kitchen order ticket (KOT) from other users. The apps does received notification but would not auto refresh, users required to refresh the apps manually in order to see the new KOT in the apps. I am wondering why this features is not implemented? Or is this feature being considered to be implemented in the future? With theEvery time an event is updated, all participants receive an update email. How can I deactivate this?
Every time an event is updated in Zoho CRM (e.g. change description, link to Lead) every participant of this meeting gets an update email. Another customer noticed this problem years ago in the Japanese community: https://help.zoho.com/portal/ja/community/topic/any-time-an-event-is-updated-on-zohocrm-calendar-it-sends-multiple-invites-to-the-participants-how-do-i-stop-that-from-happeningHow can I filter a field integration?
Hi, I have a field integration from CRM "Products" in a form, and I have three product Categories in CRM. I only need to see Products of a category. Thanks for you answers.How to implement new online payment gateway?
Hello, Can you tell me how to proceed to implement my local payment gateway? DIBS has an open avaiable API that should be easy to implement into ZOHO BOOKS. http://tech.dibspayment.com/dibs_payment_windowZoho CRM - Portal Users Edit Their Own Account Information
Hi Community, I'm working on a client portal and it seems like the only I can make the Account record editable to the Contact, is if I add another lookup on the Account to the Contact record. Am I missing something as the account already has a list ofConnecting Zoho Mail with Apollo.io
Hi, I am trying to connect my Zoho Mail account with my Apollo.io account to start sending cold email for prospecting purposes. I have activated the IMAP setting but I am still unable to connect to the Apollo account. I am using my email credentials butWhere does this report come from in the Zoho One ecosystems?
Is this directly from MA, Analytics or ??? ???Contact's title in "Contact Role Mapping"
When I'm creating a deal, I'd like to see the contacts title in the listing. Right now, I only see this: How can I get the contact's title in there?Zoho CRM - Client Portal - Hide Notes Related List
Hi Community, I'm building a customer portal and I can't find a way to hide the notes related list. I don't want the client to see the notes I have about them. Is there a way to do this as it is no bin/trash icon when I hover over."Pivot Table" Conditional Formatting
Team, I there a way to use conditional formatting a "Pivot Table" report? Thanks, Arron Blue Pumpkin Hosting | Solutions Made SimpleHow many clients can be added to Zoho Practice?
How many clients can be added to Zoho Practice without having their zoho app?Stage History
when viewing a ticket , and you look at stage history tab (kanban view) and look at the stage duration column in days, it shows the current stage of the ticket as " current stage ". Should it not rather show the amount of days it has been in that currentAutomating Ticket Responses Using Zoho Desk's AI Features
We’re looking to set up an automation within Zoho Desk that can analyze incoming emails or tickets and automatically respond with relevant knowledge base articles based on the content of the request. Could you please guide us on how to configure thisOptimising CRM-Projects workflows to manage requests, using Forms as an intermediary
Is it possible to create a workflow between three apps with traceability between them all? We send information from Zoho CRM Deals over to Zoho Projects for project management and execution. We have used a lookup of sorts to create tasks in the past,Service locations are tied to contacts?
Trying the system out. And what I discovered is that it seems that the whole logic of the app is, I'd say, backwards. There is a Customer - a company. The company has contact persons and service locations can be associated with different contact persons.Enhancements to Zoho Map integration tasks
Hello everyone, We're excited to announce enhancements to the Zoho Map integration tasks in Deluge, which will boost its performance. This post will walk you through the upcoming changes, explain why we're making them, and detail the steps you need toBug in Total Hour Calculation in Regularization for past dates
There is a bug in Zoho People Regularization For example today is the date is 10 if I choose a previous Date like 9 and add the Check in and Check out time The total hours aren't calculated properly, in the example the check in time is 10:40 AM checkNarrative 12: Sandbox - Testing without the risk
Behind the scenes of a successful ticketing system: BTS Series Narrative 12: Sandbox - Testing without the risk What is a sandbox environment? A sandbox environment is a virtual playground that allows you to test freely and experiment with various elementsAnnouncing new features in Trident for Mac (1.27.0)
Hello everyone! Trident for macOS (v1.27.0) is here with new features and enhancements to improve scheduling and managing your calendar events. Let's take a quick look at them. Stay aligned across time zones. Both the scheduled and original time zonesBranding of native system emails
Make system emails adjustable in terms of branding. We want our system to be completely white label, because it is not a CRM anymore, it's way more than that. We are following the strategy of "CRM for everyone" to use the CRM in all departments, not onlySlow uploads of large files
I'm wanting to use Workdrive for transferring large images and video (we're talking things from 100MB-5GB). I'm running solo on a 500MBit/sec fiber connection. I'm getting upload speeds to Workdrive of no more than about 1-3Mbytes/sec when going throughMigrate Your Notes from OneNote to Zoho Notebook Today
Greetings Notebook Users, We’re excited to introduce a powerful new feature that lets you migrate your notes from Microsoft OneNote to Zoho Notebook—making your transition faster and more seamless than ever. ✨ What’s New One-click migration: Easily importNext Page