Announcing Zoho Analytics 6.0 - An AI Powered Self-Service BI & Analytics Platform!
That’s why we’re excited to announce the launch of Zoho Analytics 6.0! This powerful new version brings together business users, data analysts, data engineers, and data scientists on a single platform, making data-driven decision-making easier and more accessible for all. Welcome to a new era of analytics!
Data Connectors and Data Management
New Connectors
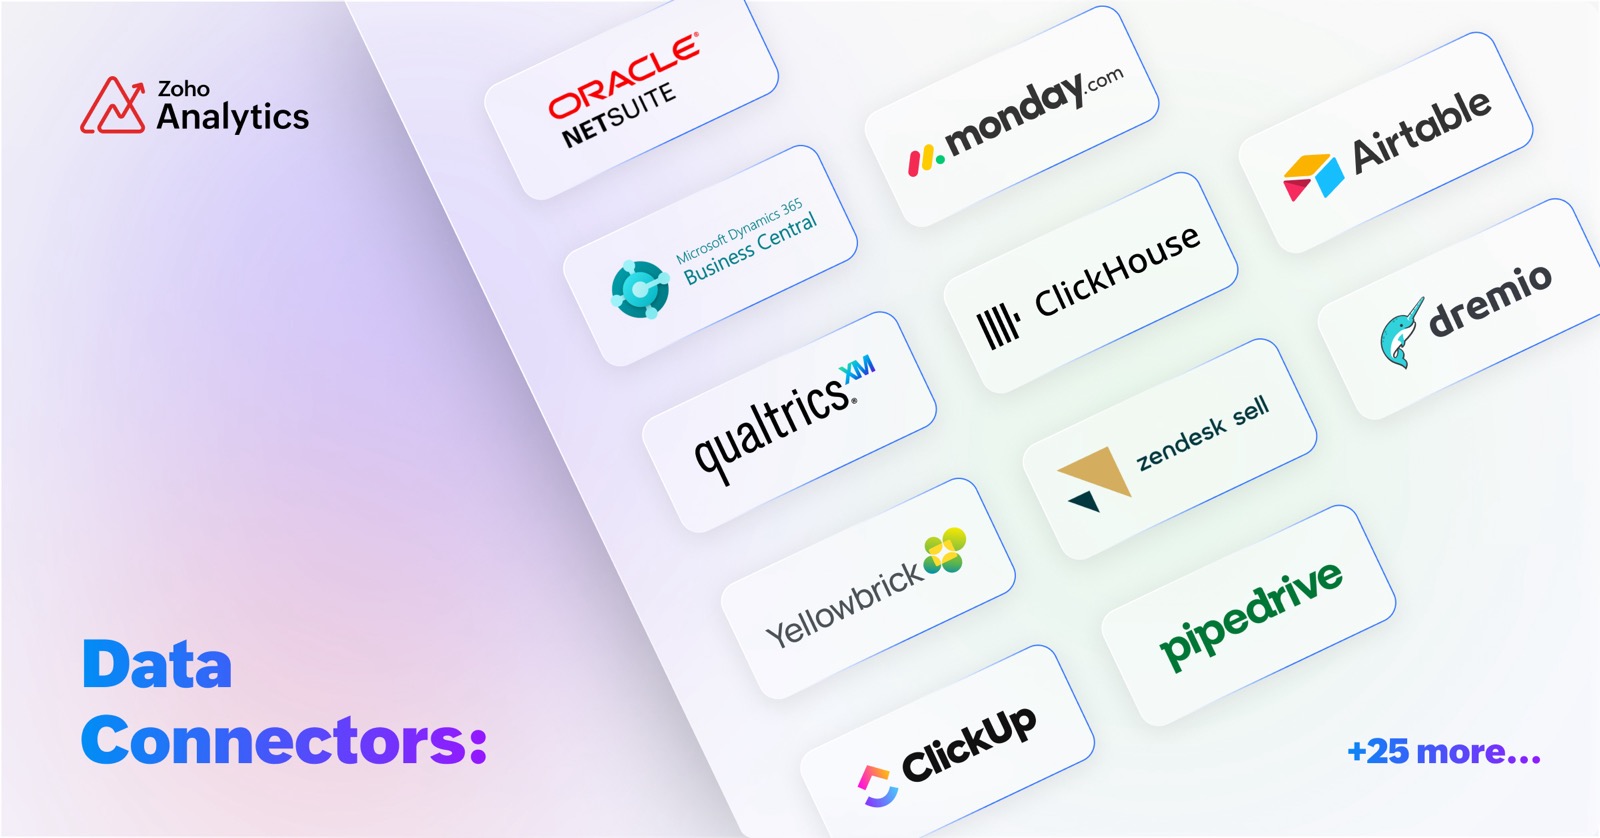
We are enhancing our existing portfolio of over 500+ advanced analytics connectors by adding more than 25 connectors to this list. These additions cater to big data platforms and business applications, including Yellowbrick, ClickHouse, Dremio, Oracle Netsuite, Databricks, Monday.com, Airtable, Qualtrics, ClickUp, and several others.
Effectively analyze your data from different business applications by using our pre-built reports and dashboards. Additional features in Zoho Analytics like Sync history, Audit History, and Undo Import allow you to manage all data sources, including the connectors.
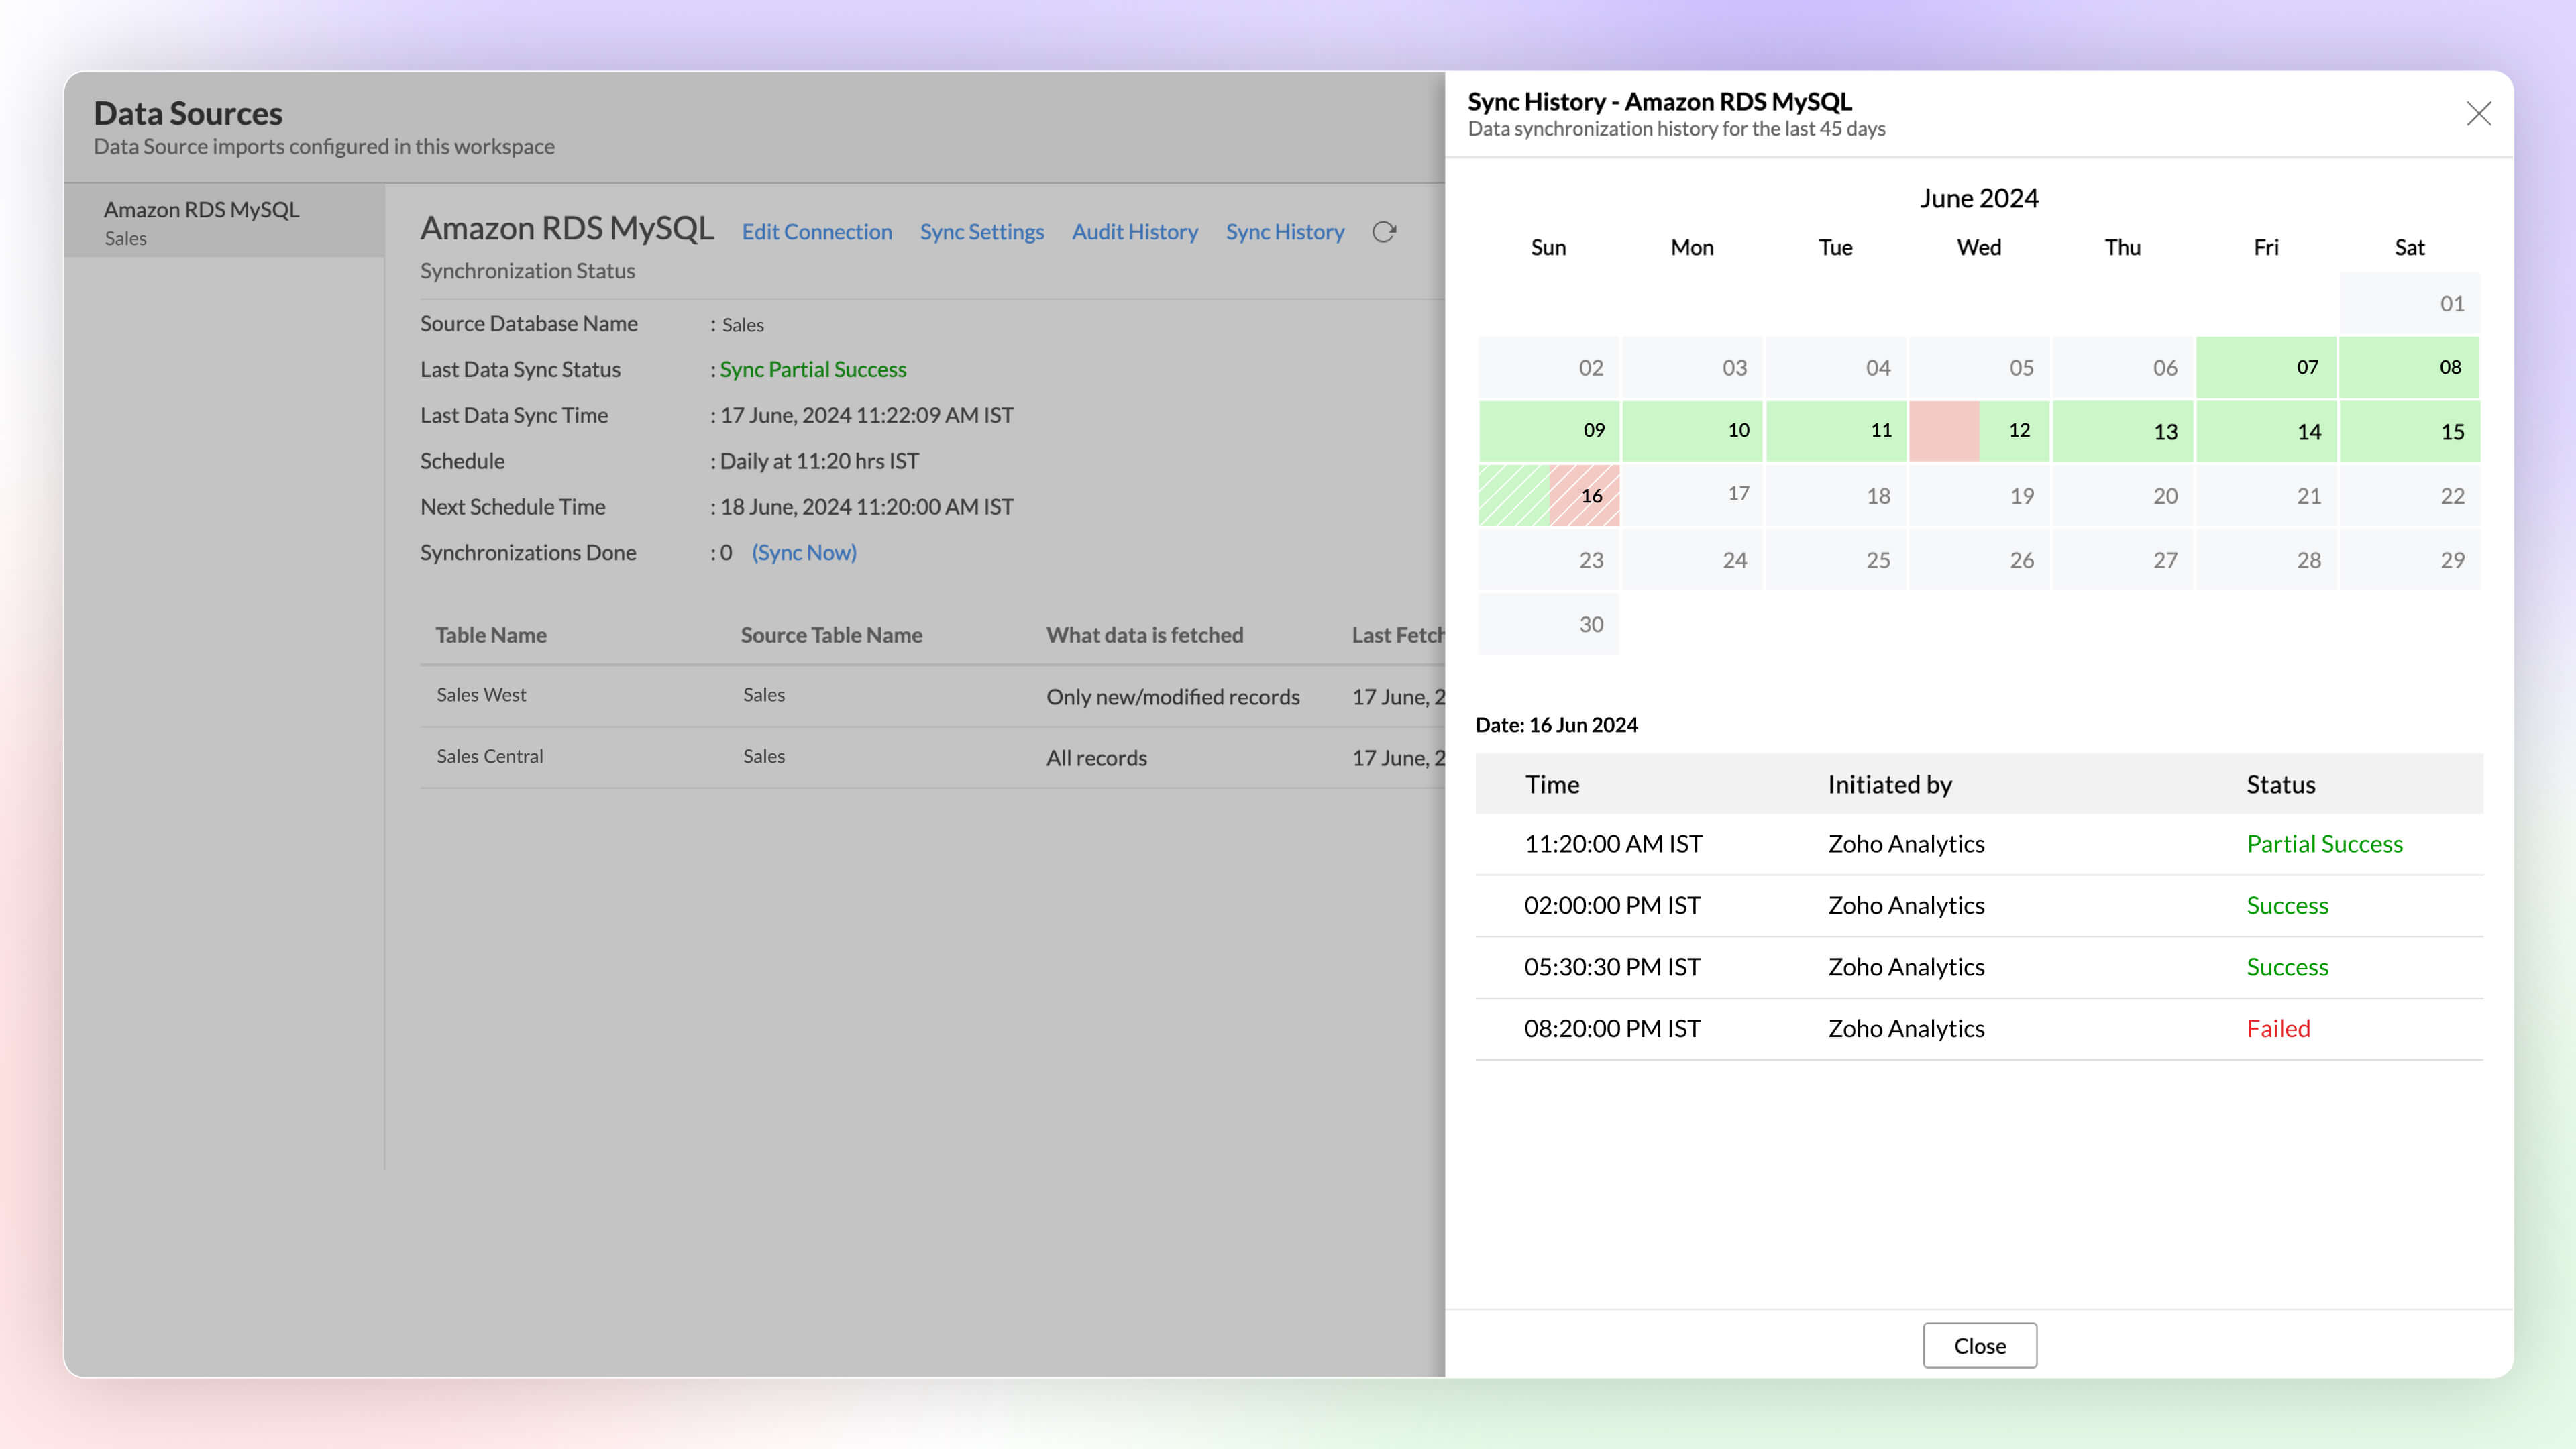
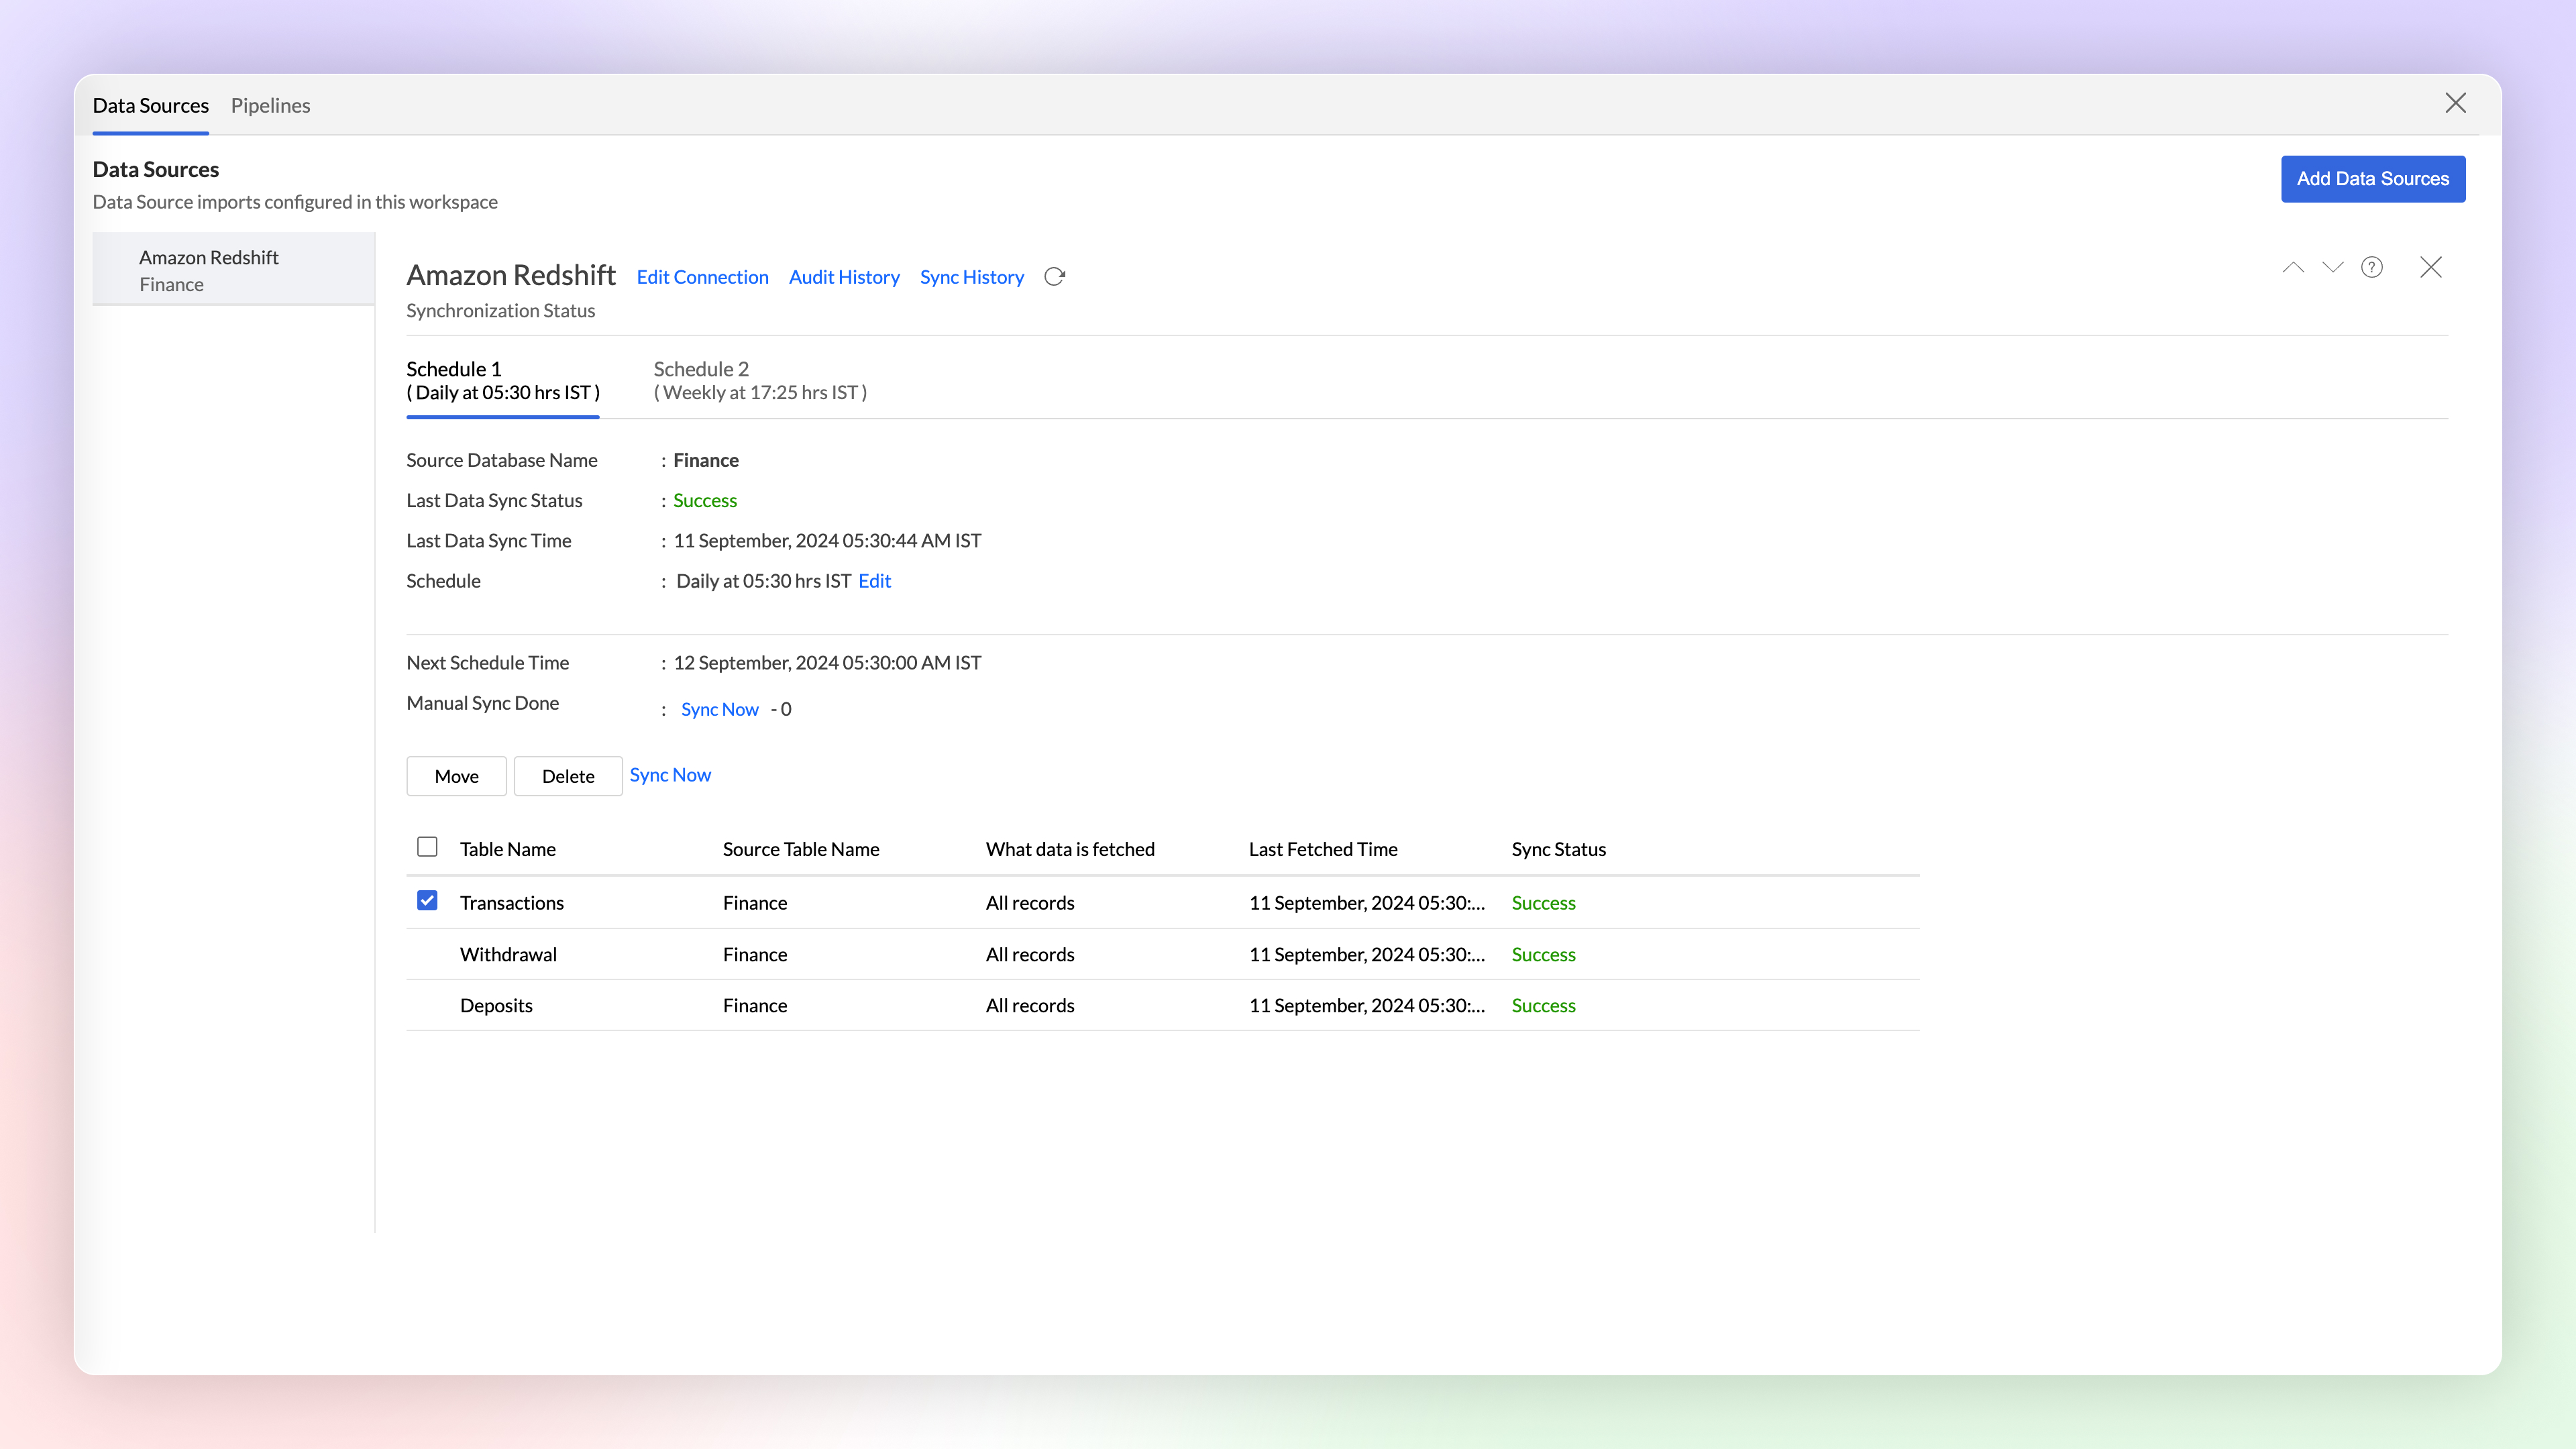
Sync History
Get a detailed overview of data synchronization activities using Sync history in Zoho Analytics. It helps administrators monitor the status of each sync easily, as successful syncs are highlighted in green, while failed syncs appear in red, along with reasons for the failure and required actions.
Click here to learn more.
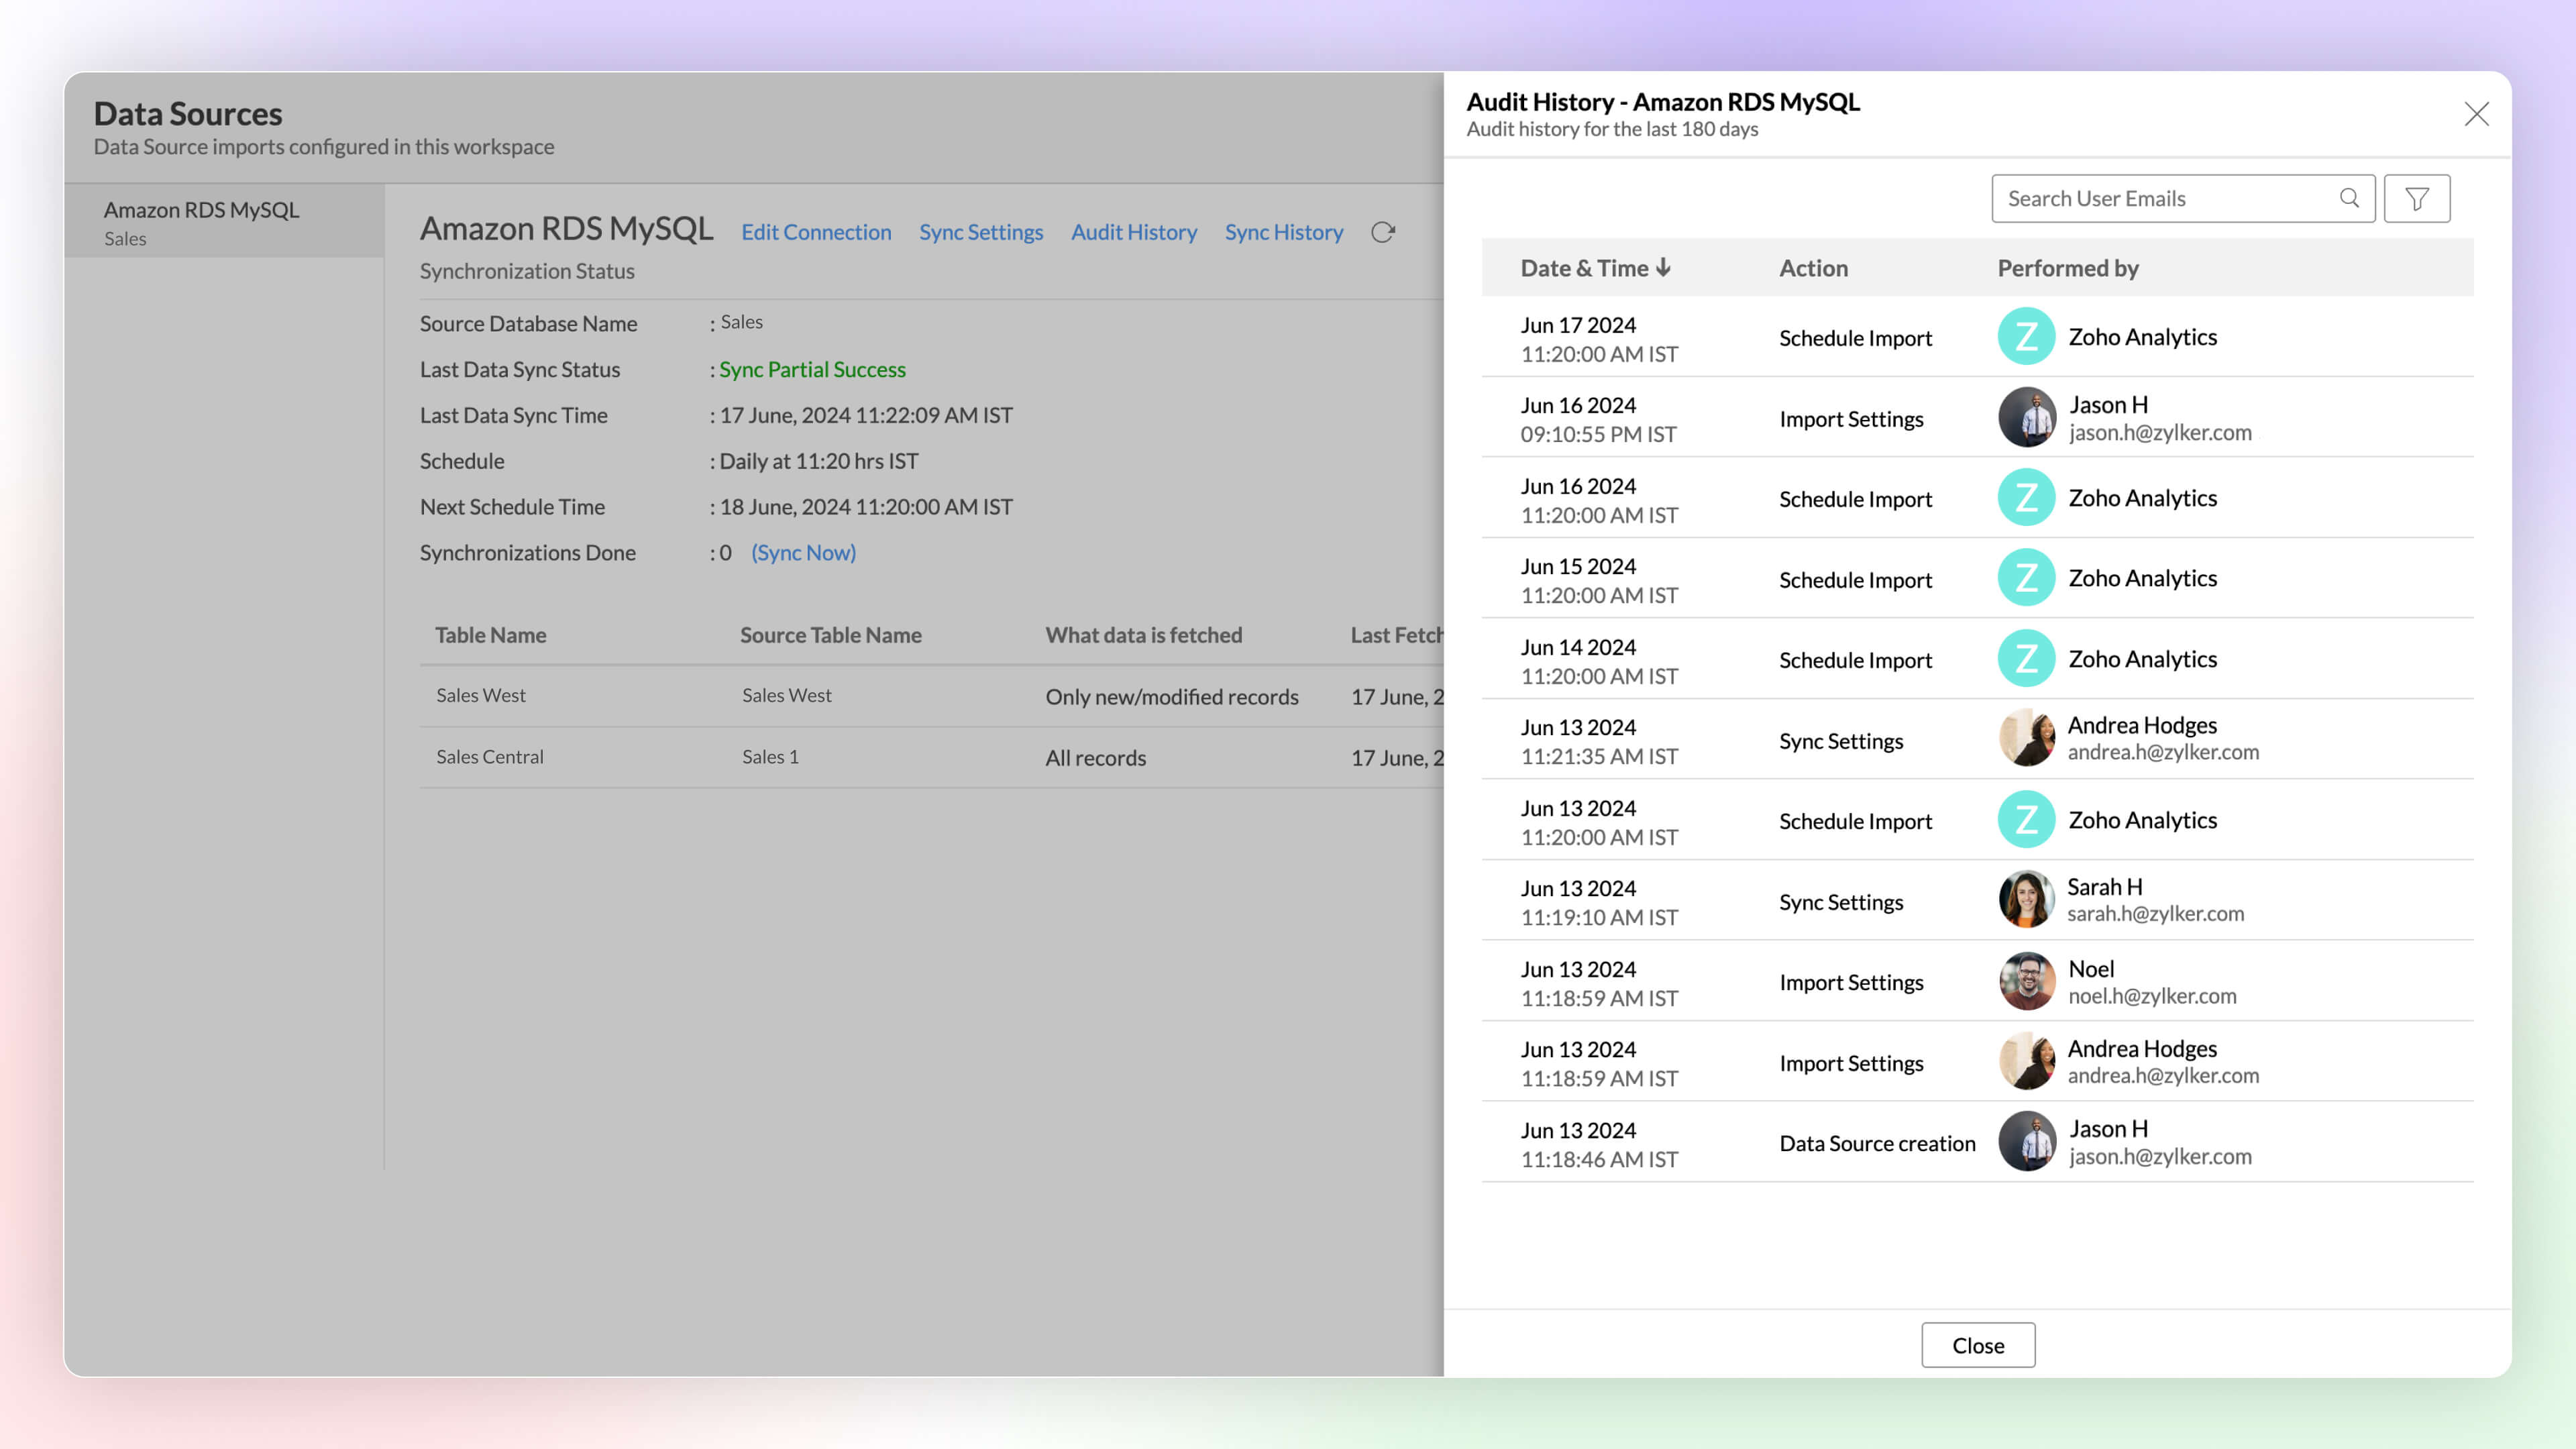
Audit History
Keep a full track of user and system activities using Audit History in Zoho Analytics. it helps you ensure security and resolve issues easily, using the timestamps and details of the administrator responsible for each action.
Click here to learn more.
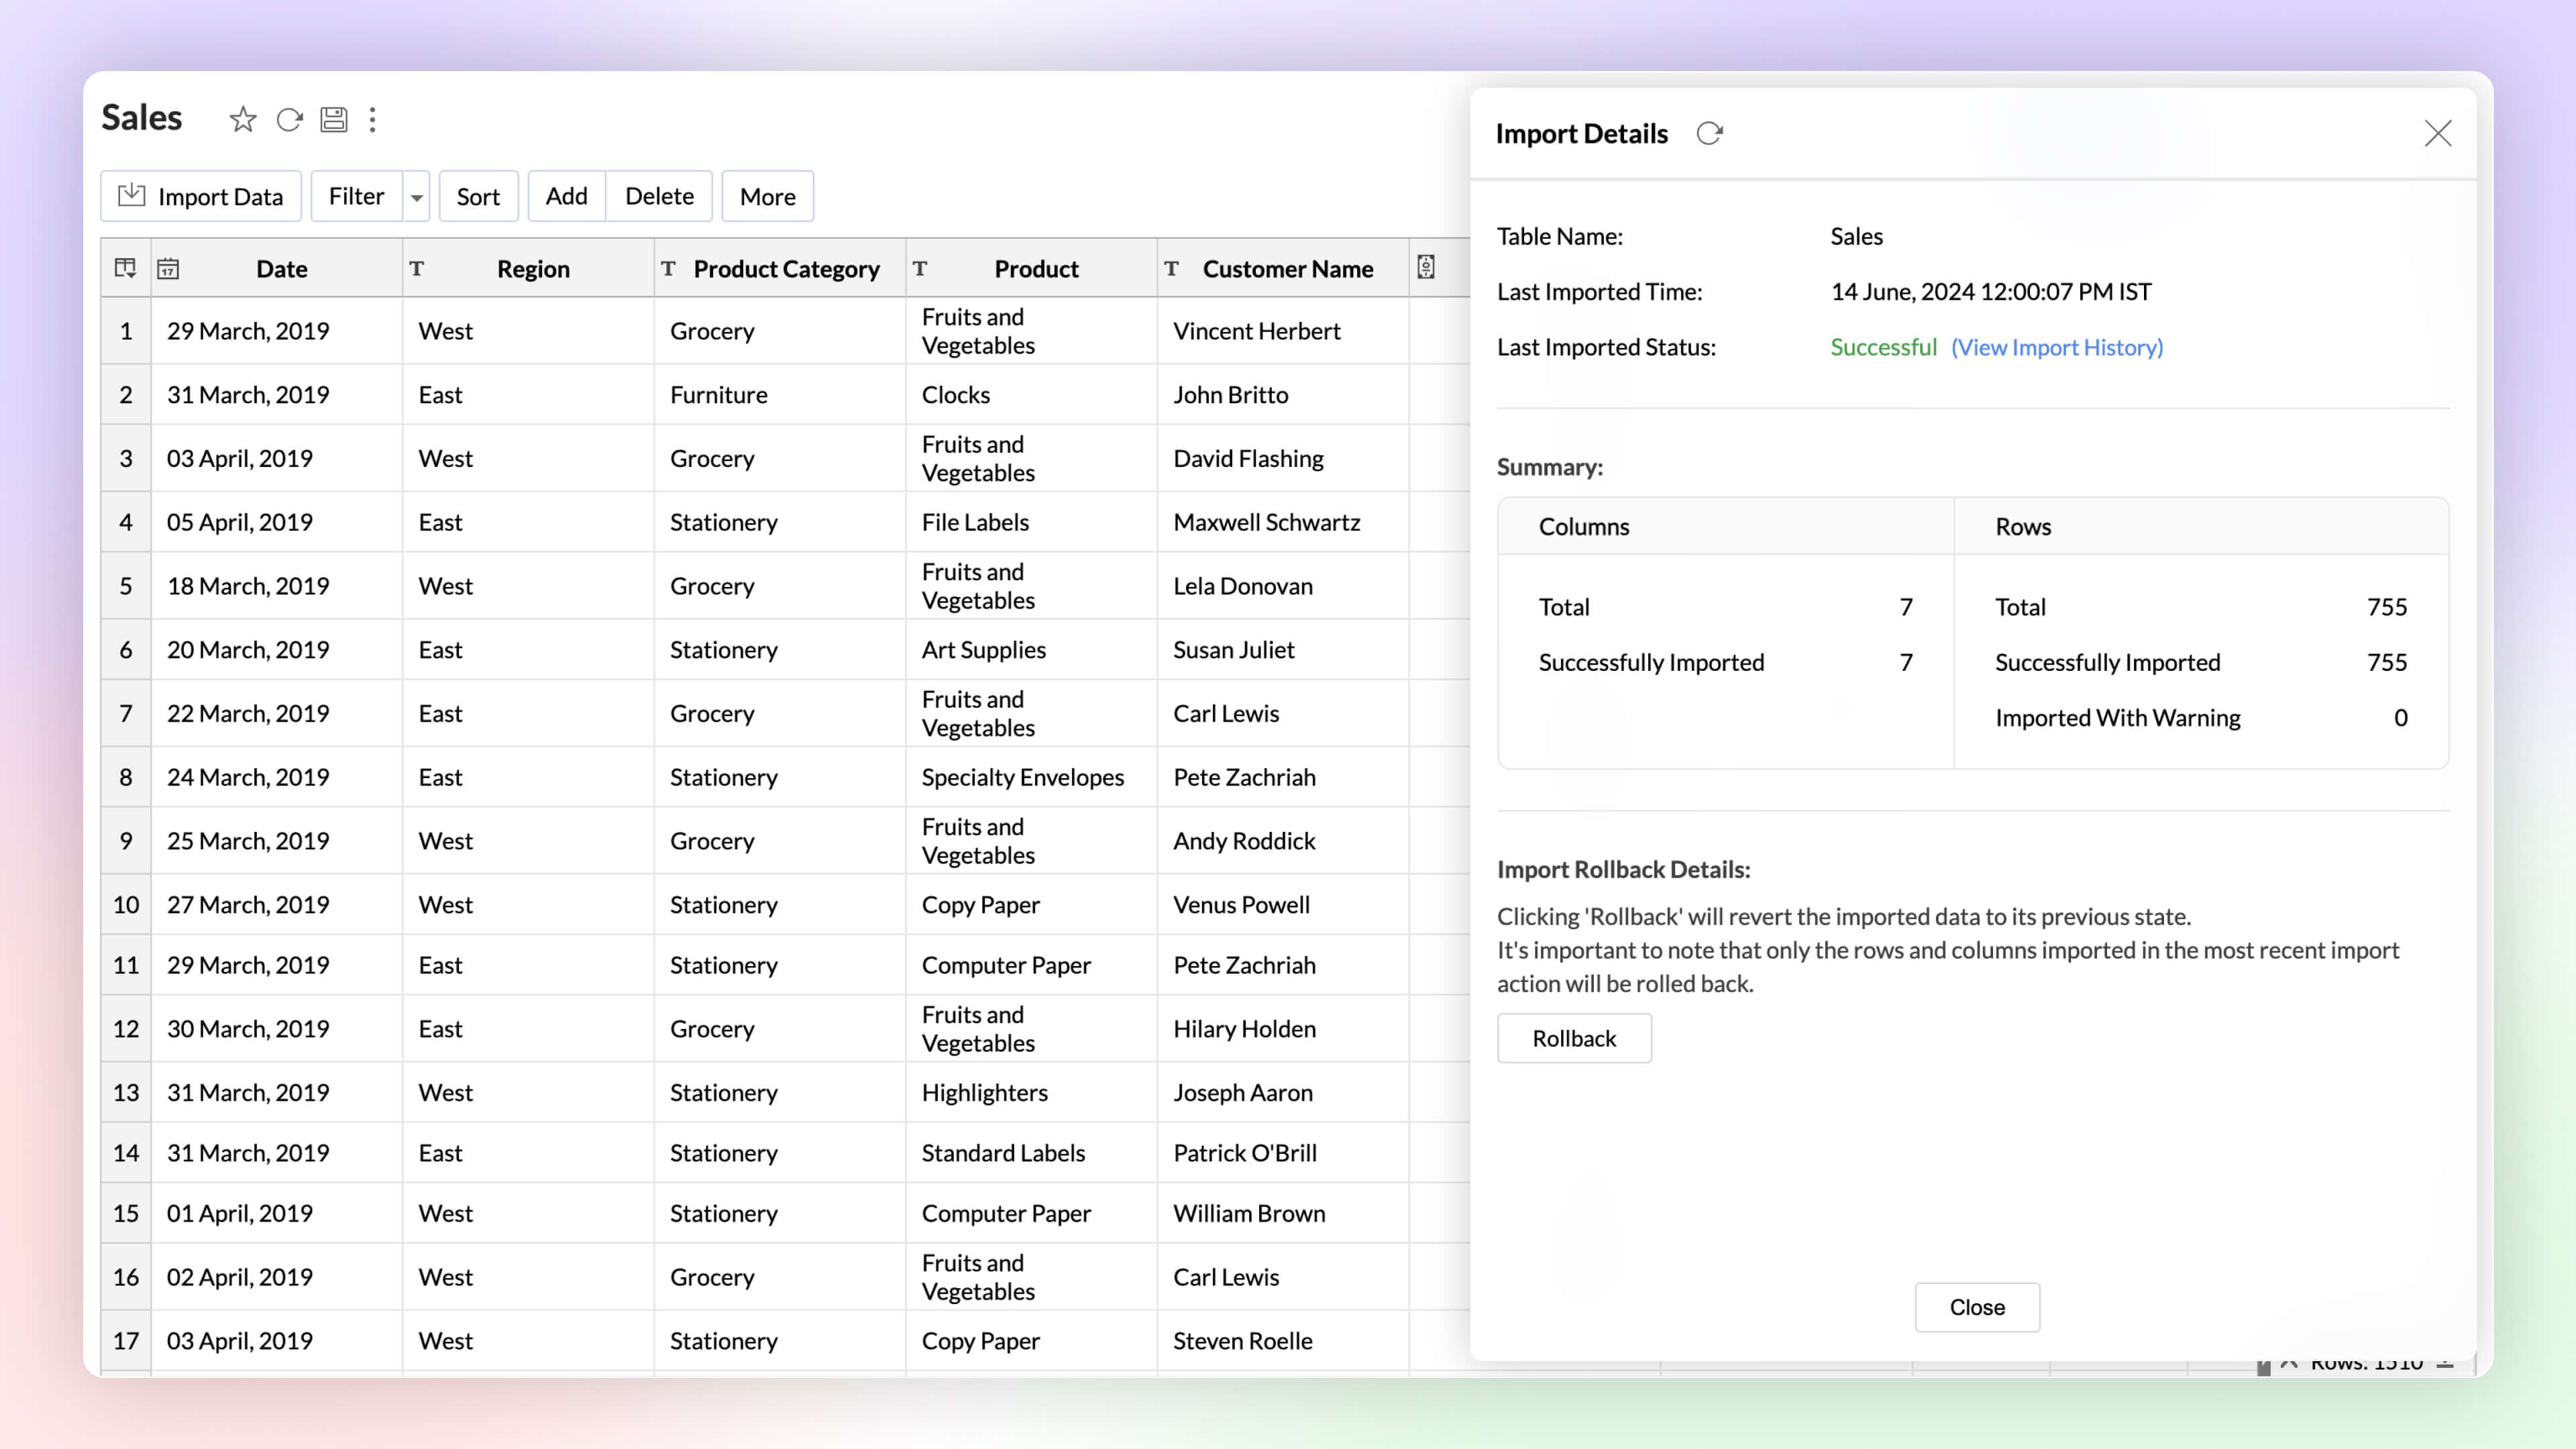
Undo Import Enterprise Plan
Automated imports can sometimes have errors and inconsistencies in data, and this can affect the data quality and the results. The import rollback capability reverts the current data import version to its previous version without affecting the existing data flow and analysis, ensuring data integrity.
Click here to learn more.
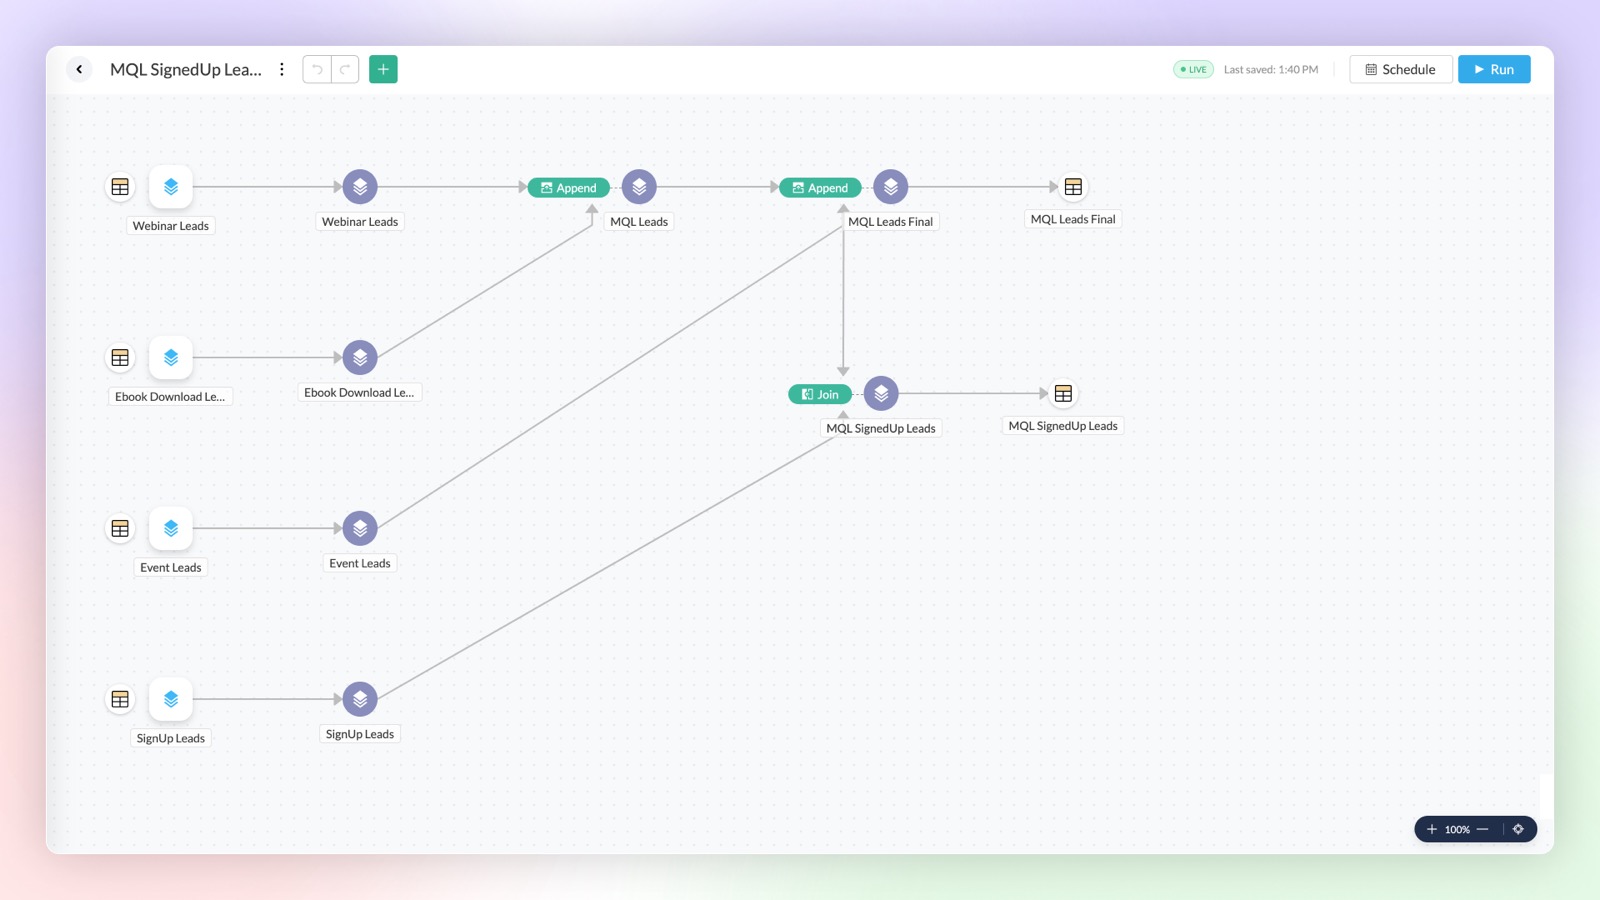
Data Pipelines Premium Plan
Set up and create data pipelines to setup powerful transformations on your datasets. You can create data pipelines with the no-code visual pipeline builder and perform various transforms on your data like join, append, pivot, and unpivot.
Click here to learn more.
Multiple Schedule Intervals for Tables
Syncing multiple tables at the same interval, just because they share a source, isn't always optimal. That's why we've introduced flexible scheduling options per connection. Now, each table can have its own unique sync interval, allowing you to better meet its specific requirements.
Click here to learn more.
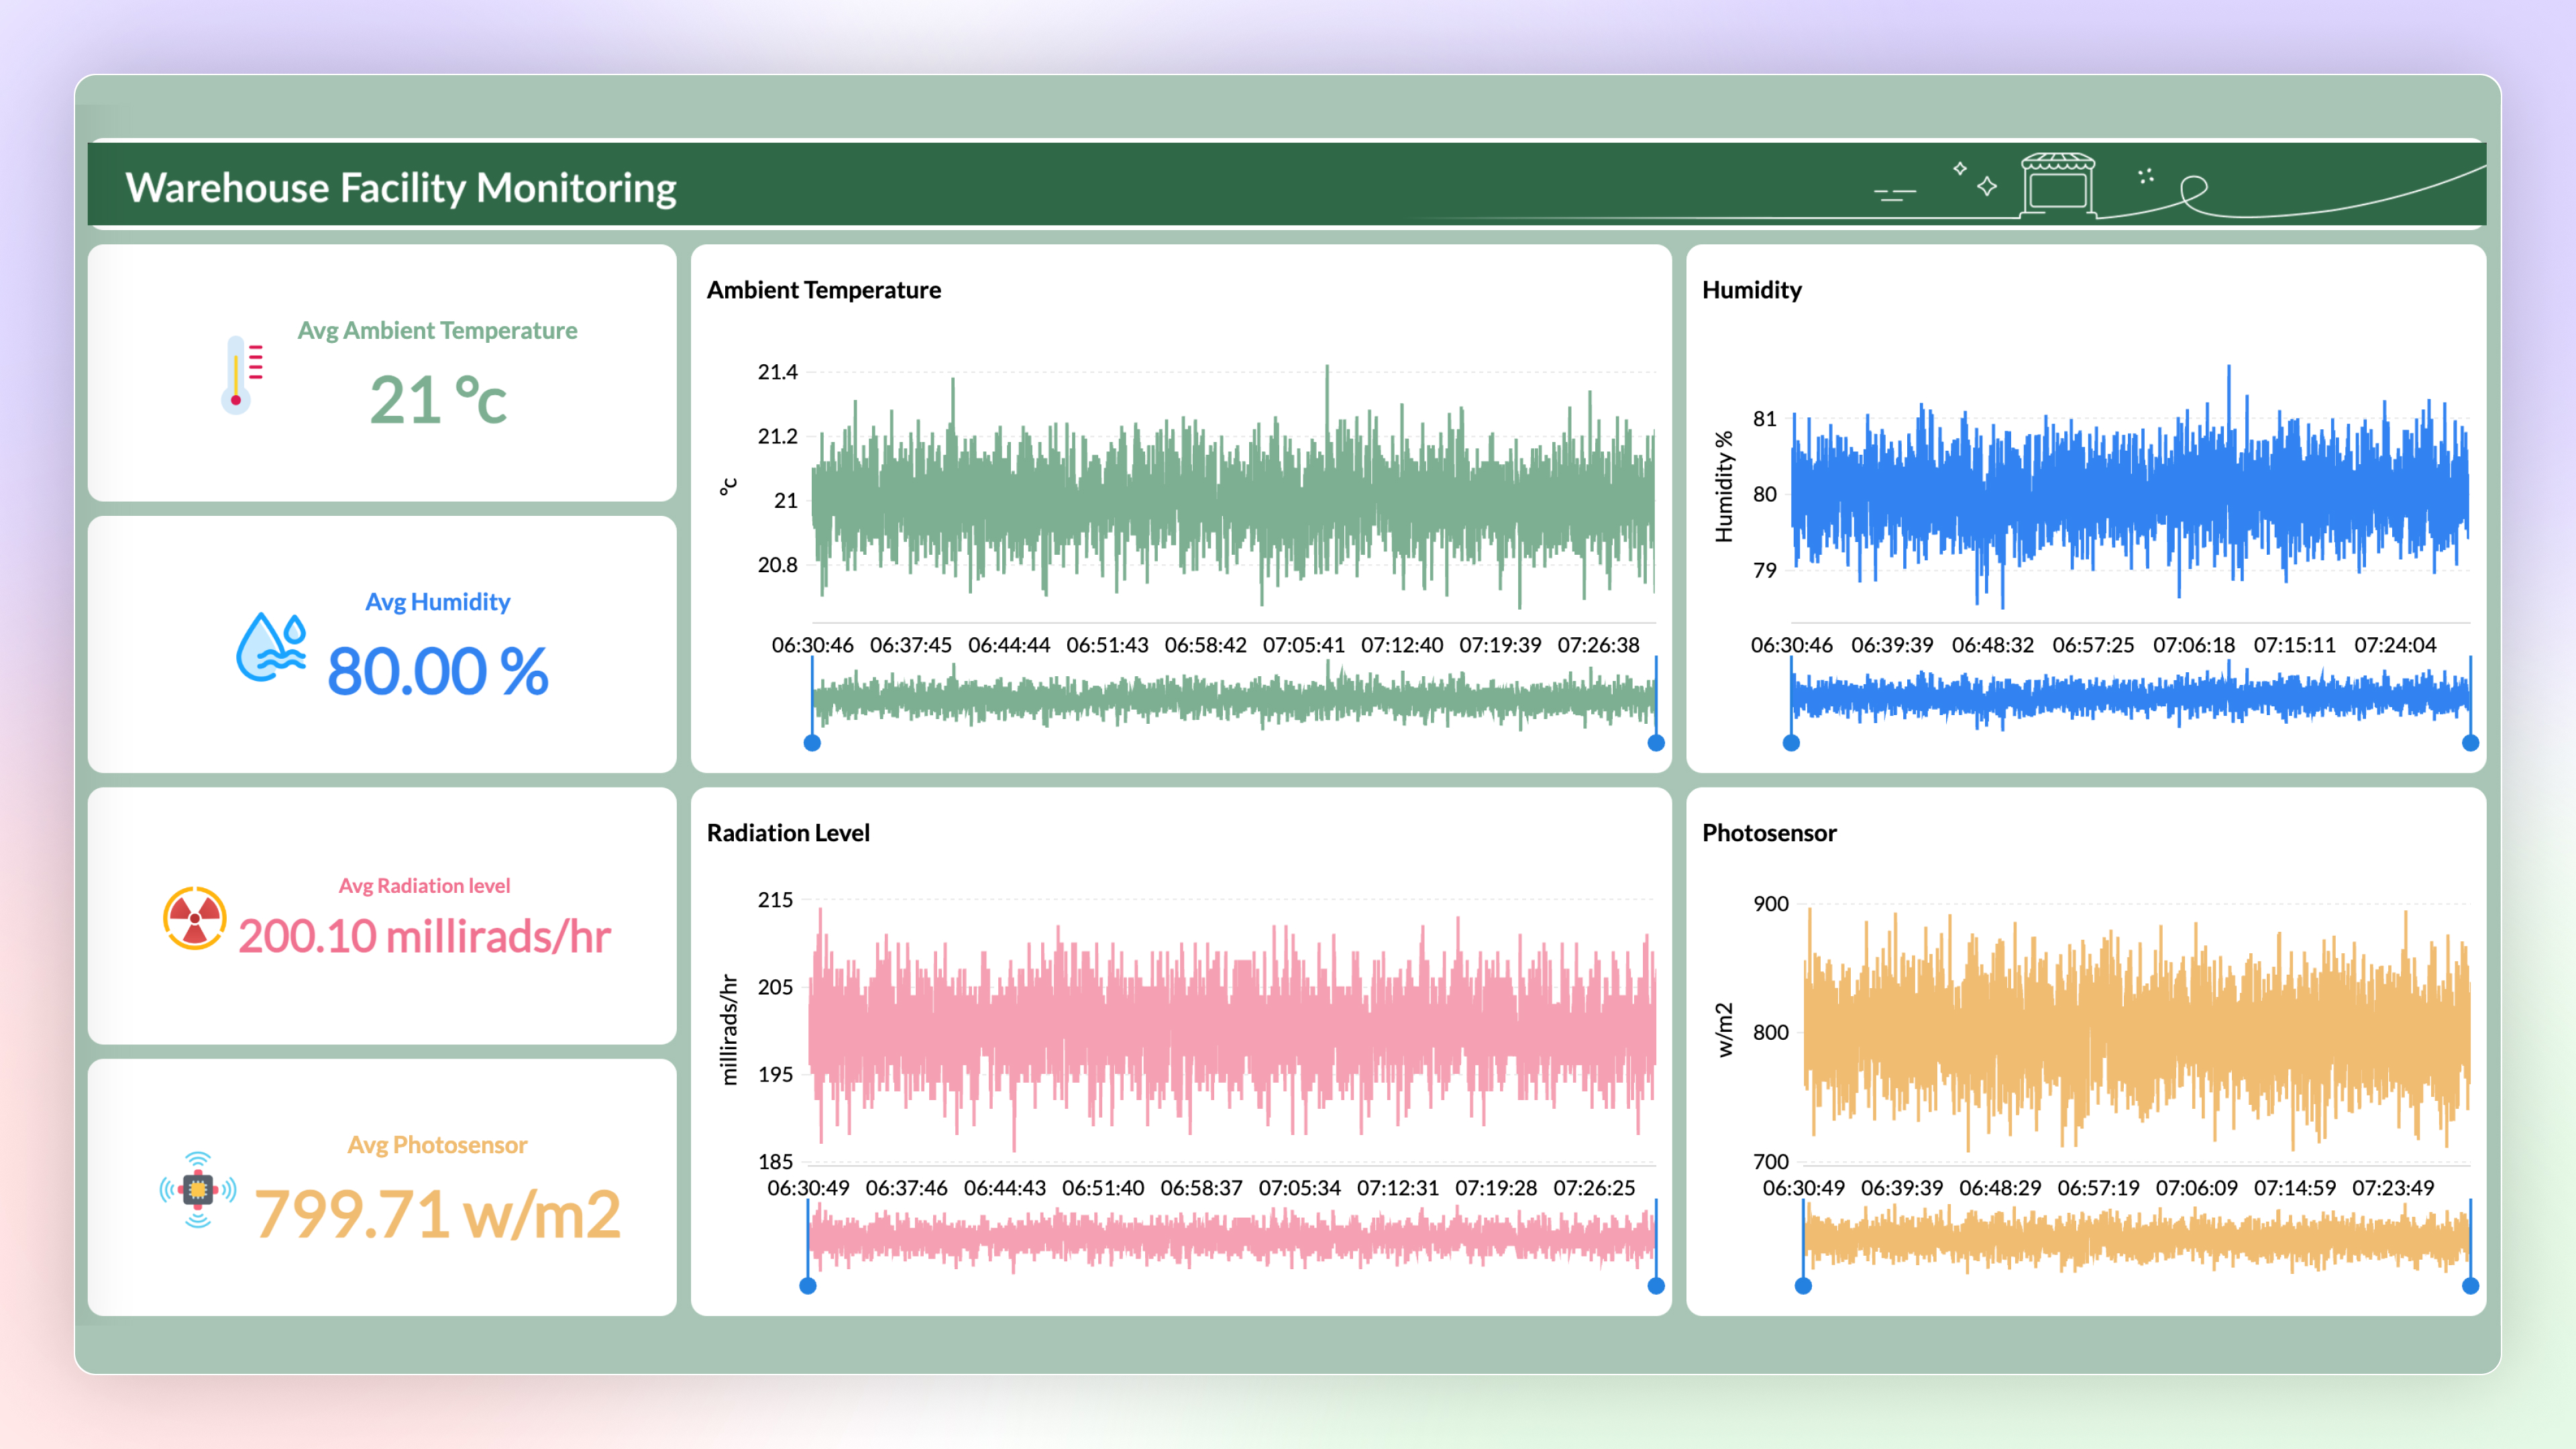
Stream Data Processing Premium Plan
Now you can use Stream Analytics to analyze the data from live streams. The data can be streamed into Zoho Analytics using API and Google Pub-Sub Push Subscription and can be visualized using Zoho Analytics to get real-time insights.
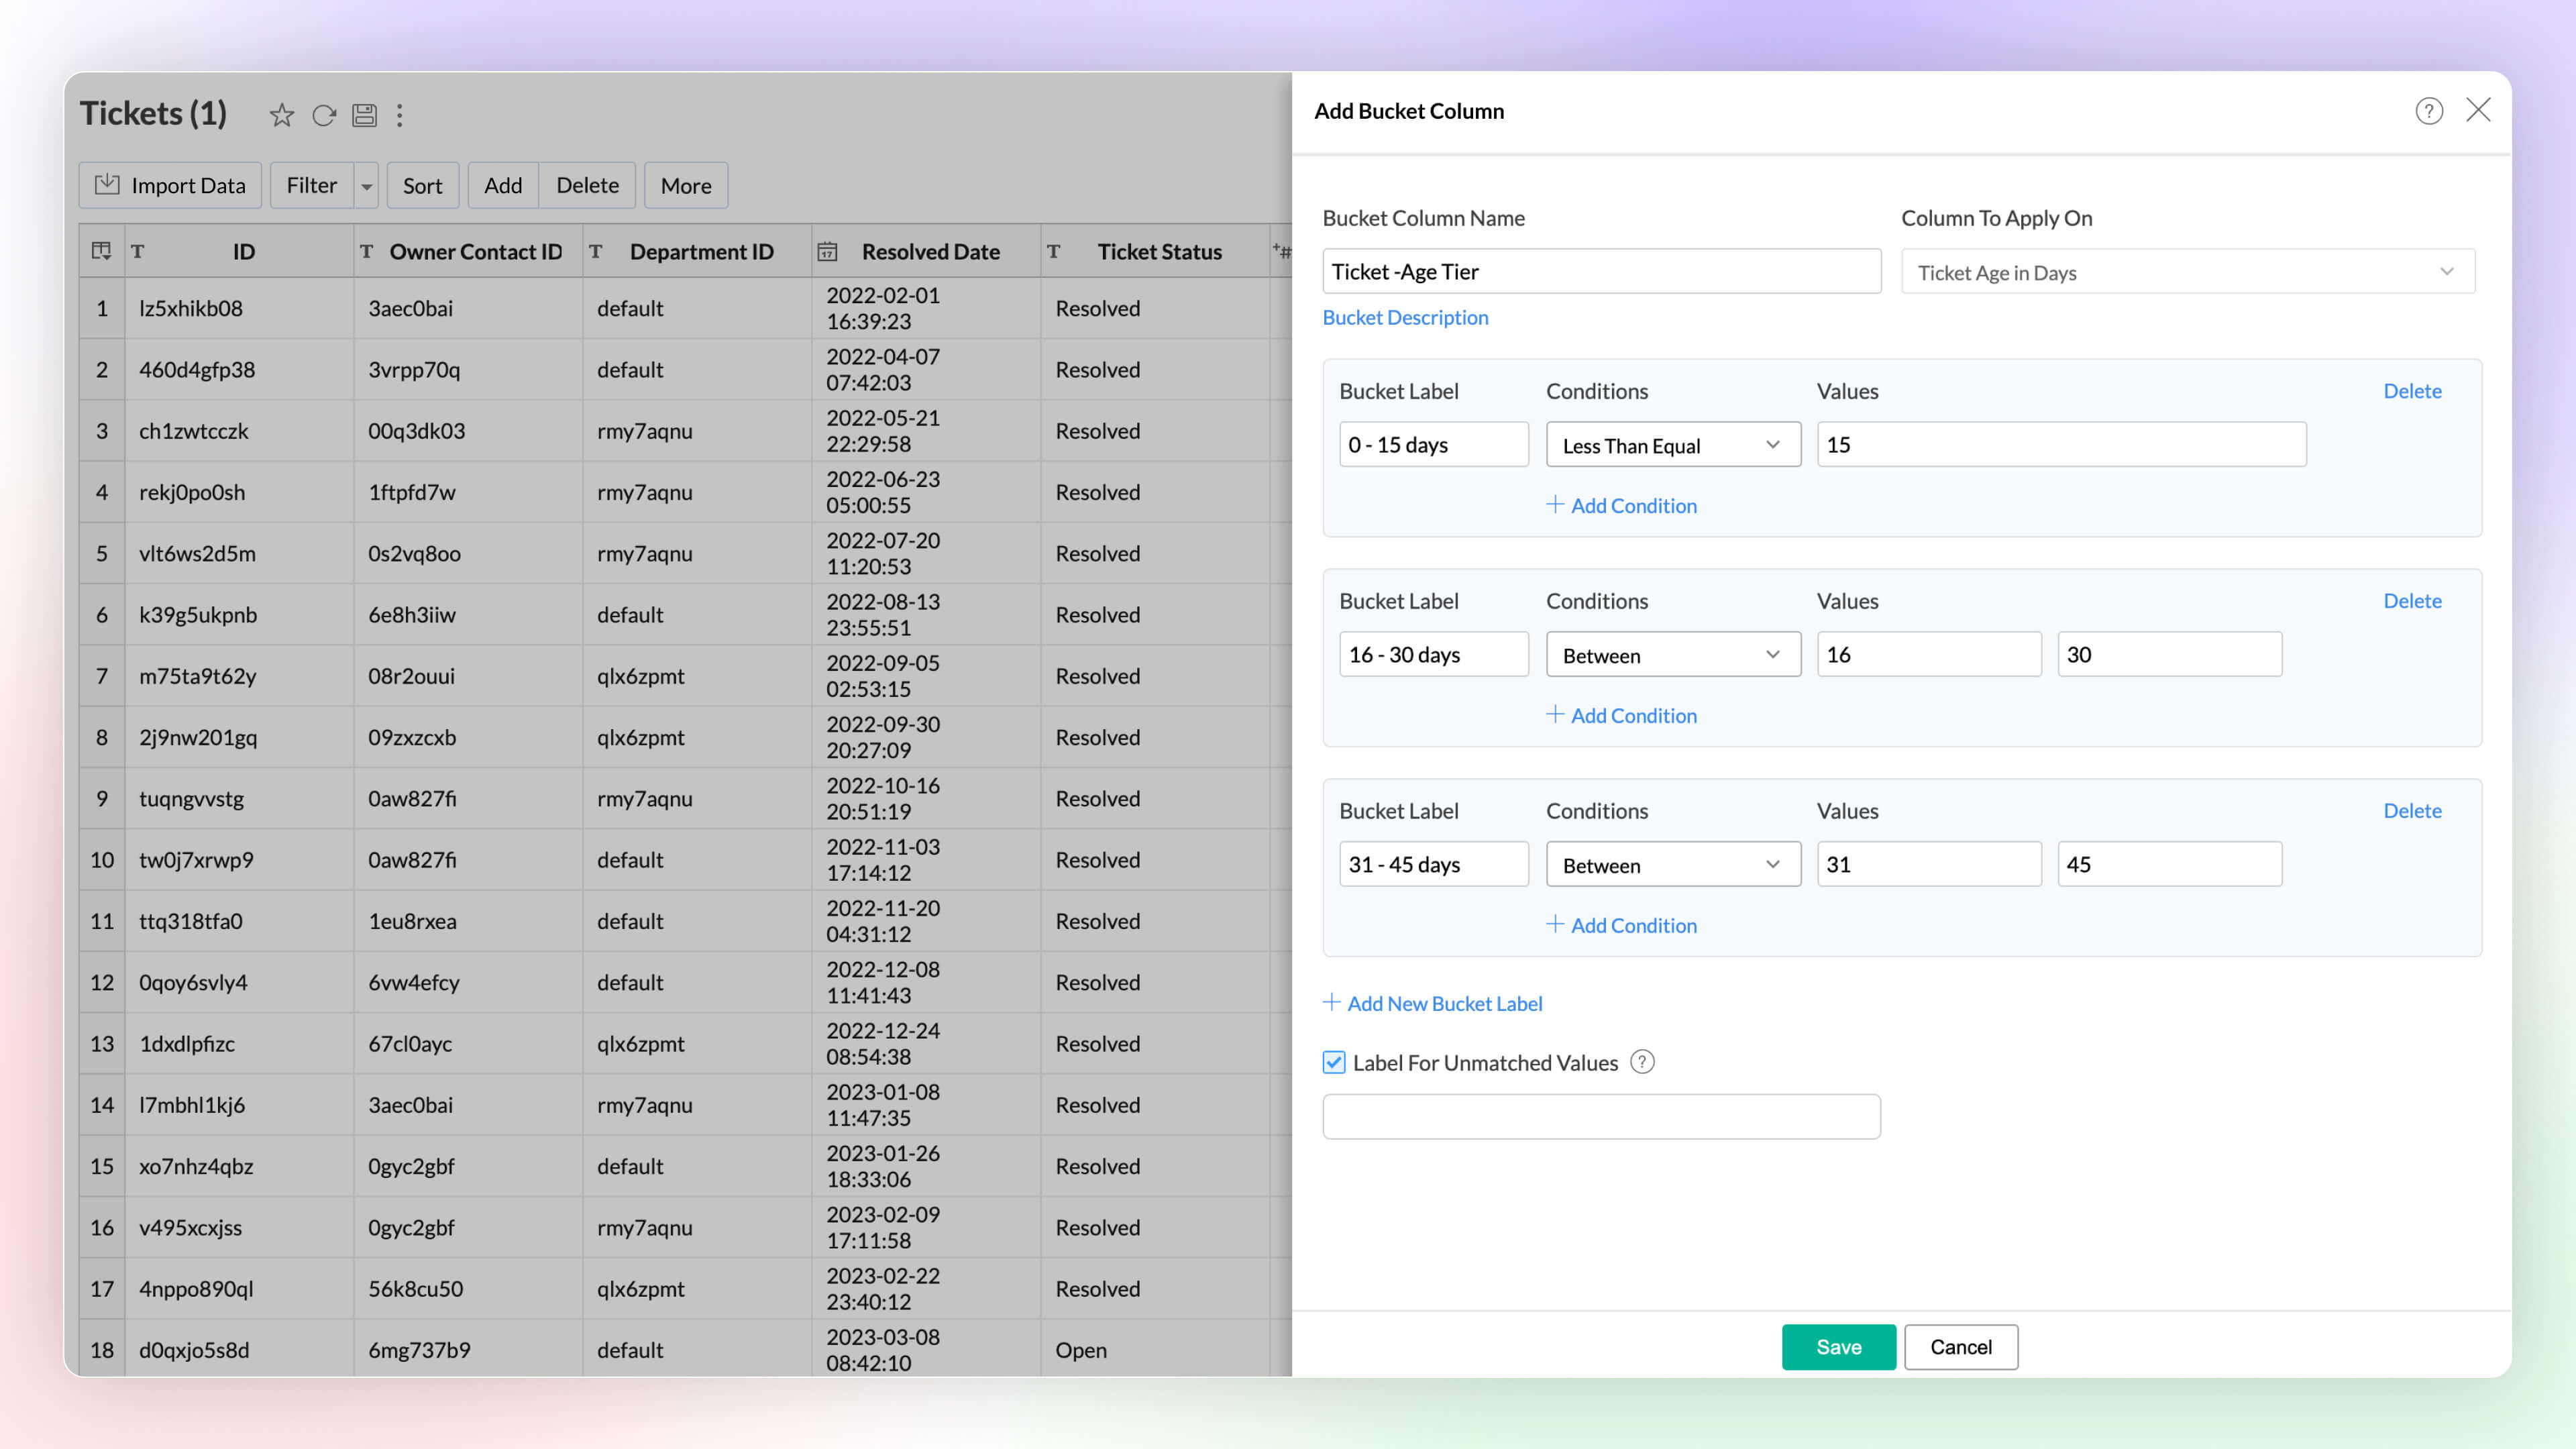
Data Bucketing
Data bucketing in Zoho Analytics allows you to transform your data into categorical bins, reducing distinct values and simplifying analysis. This feature, now built-in, replaces the need for complex formulas.
Click here to learn more.
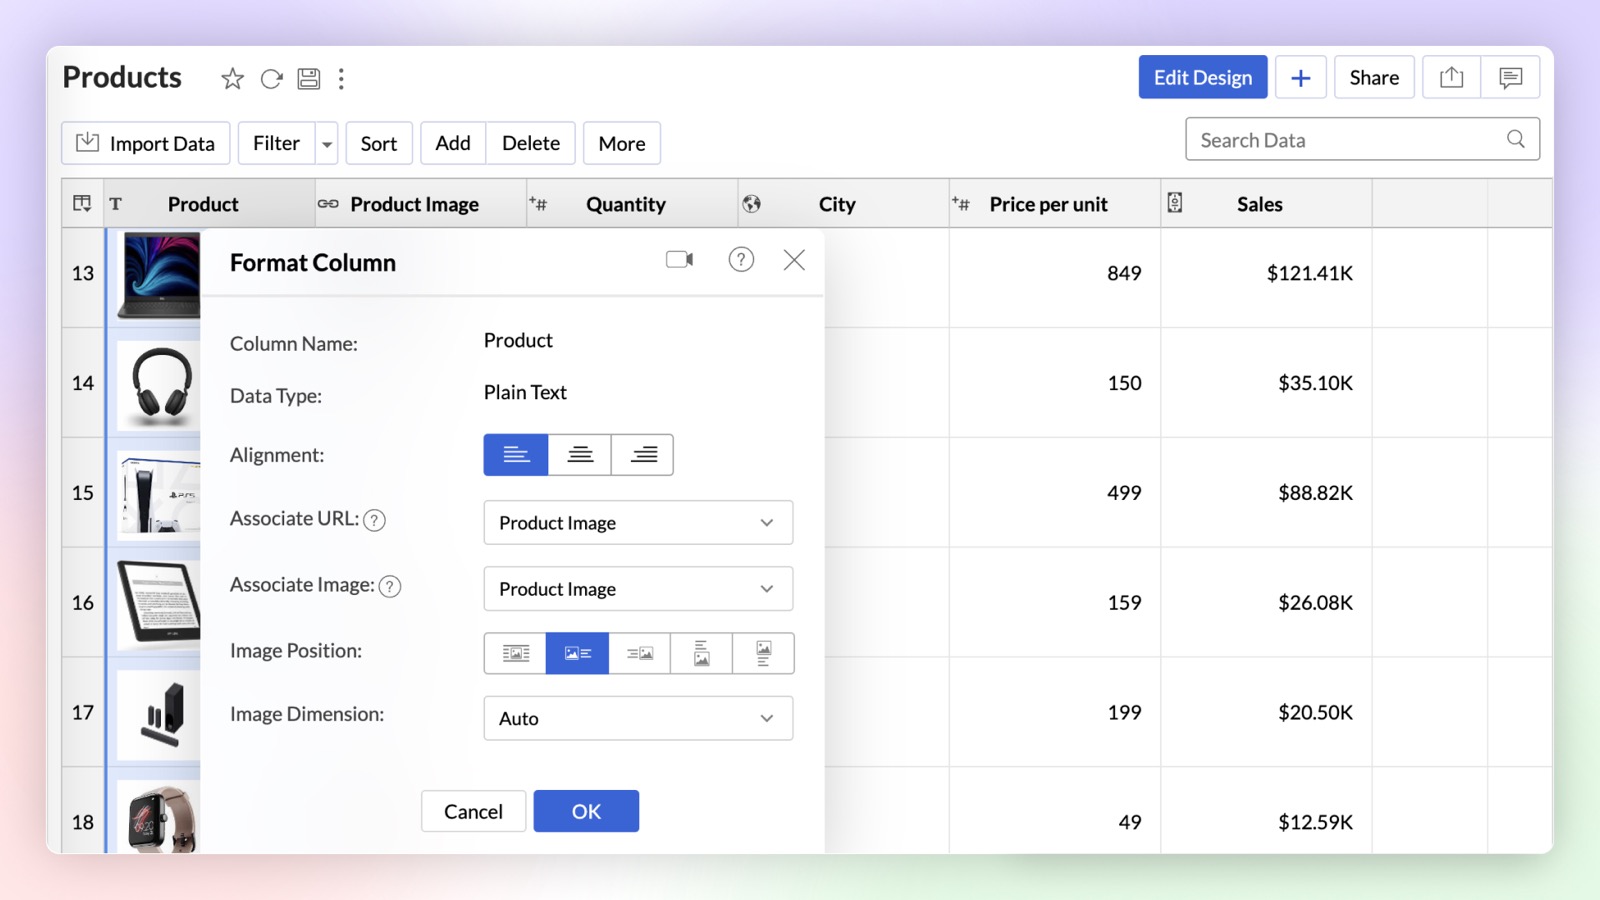
Dynamic Image / URL
You can now dynamically associate a URL column with a text column in Zoho Analytics. On associating URL as a link or image, the text column will be either hyperlinked or an image will be displayed alongside the text.
Click here to learn more.
Unified Metrics
Unified Metrics in Zoho Analytics consolidates and standardizes all the metrics (aggregates) from different data sources/tables in a workspace. Now you can promote consistency and avoid duplication of metrics across the tables with ease.
Click here to learn more.
Real-time data sync for Zoho CRM Enterprise Plan
You can now analyze up-to-the-minute CRM data in Zoho Analytics. Zoho CRM users can use the Advanced Analytic connector for Zoho CRM to analyze and visually present real-time data effortlessly.
Dataiku Plug-in
You can now analyze and visualize data in Dataiku ML models using the Zoho Analytics Plugin in Dataiku. Zoho Analytics plugin is now available in Dataiku Plugins page.
Enhancement in Live Connect
Zoho Analytics now allows data sources with Live Connect to be added to workspaces alongside other data sources. Previously, Live Connect sources could not be combined with other data sources in the same workspace.
Click here to learn more.
Visual Analytics
Chart Enhancements
New Chart Types
Zoho Analytics supports 7 new chart types (on top of 50+ existing ones) with extensive customization options to enhance the presentation and interpretation of the data.
- Sankey charts Sankey charts are ideal for visualizing data flow between nodes and tracking event movement through connected lines. In Zoho Analytics, you can customize node and link colors, adjusting them individually or globally, and set link colors based on source or target nodes. You can choose a basic Sankey chart for simple flows or an Alluvial Chart for complex, multi-stage flows.
- Racing charts are animated views that are best suited for visualizing the changes in the data over a period of time where the relative ranking of categories is important. They highlight and help comprehend the fluctuations and progression in the data. These types of charts grab the user's attention instantly, providing an immersive experience and helping craft a compelling story about the data.
- Spark lines are compact charts that show the trends and variations in the data without taking up much space. They are widely used alongside pivot tables and help grasp trends and allow quick comparison of metrics across different fields. Zoho Analytics supports three variations that includes line chart, area chart, and bar chart.
- Geo Map Layering, add multiple data layers to the geo map to visualize various dimensions of information. This feature includes interactive options for enhanced data exploration.
- Sunburst charts represent hierarchical data through a series of rings, or concentric circles. Each ring corresponds to a level in the hierarchy. The central or innermost circle represents the root node, or the top-level category. Moving outwards, each subsequent ring represents a subcategory, where the outermost ring is the leaf node. The size of each arc in the ring is proportional to the value of the data.
- Conversion bar charts show the connected stages of a process and the gradual decrease in data as it moves through different stages of the process. Each stage is represented by a bar, with a step or stair case pattern indicating the shift in values (along with conversion percentage) at each stage.
-
Tree Map is a visualization composed of differently-sized rectangles that represent your data values. This is beneficial when you want to depict the part to whole relationship among various categories.

Interactive Chart Customizations
Experience real-time updates as you customize your chart with the new Chart Settings interface, now available on the right side pane. It provides enhanced customization options with live visual feedback.
Click here to learn more.
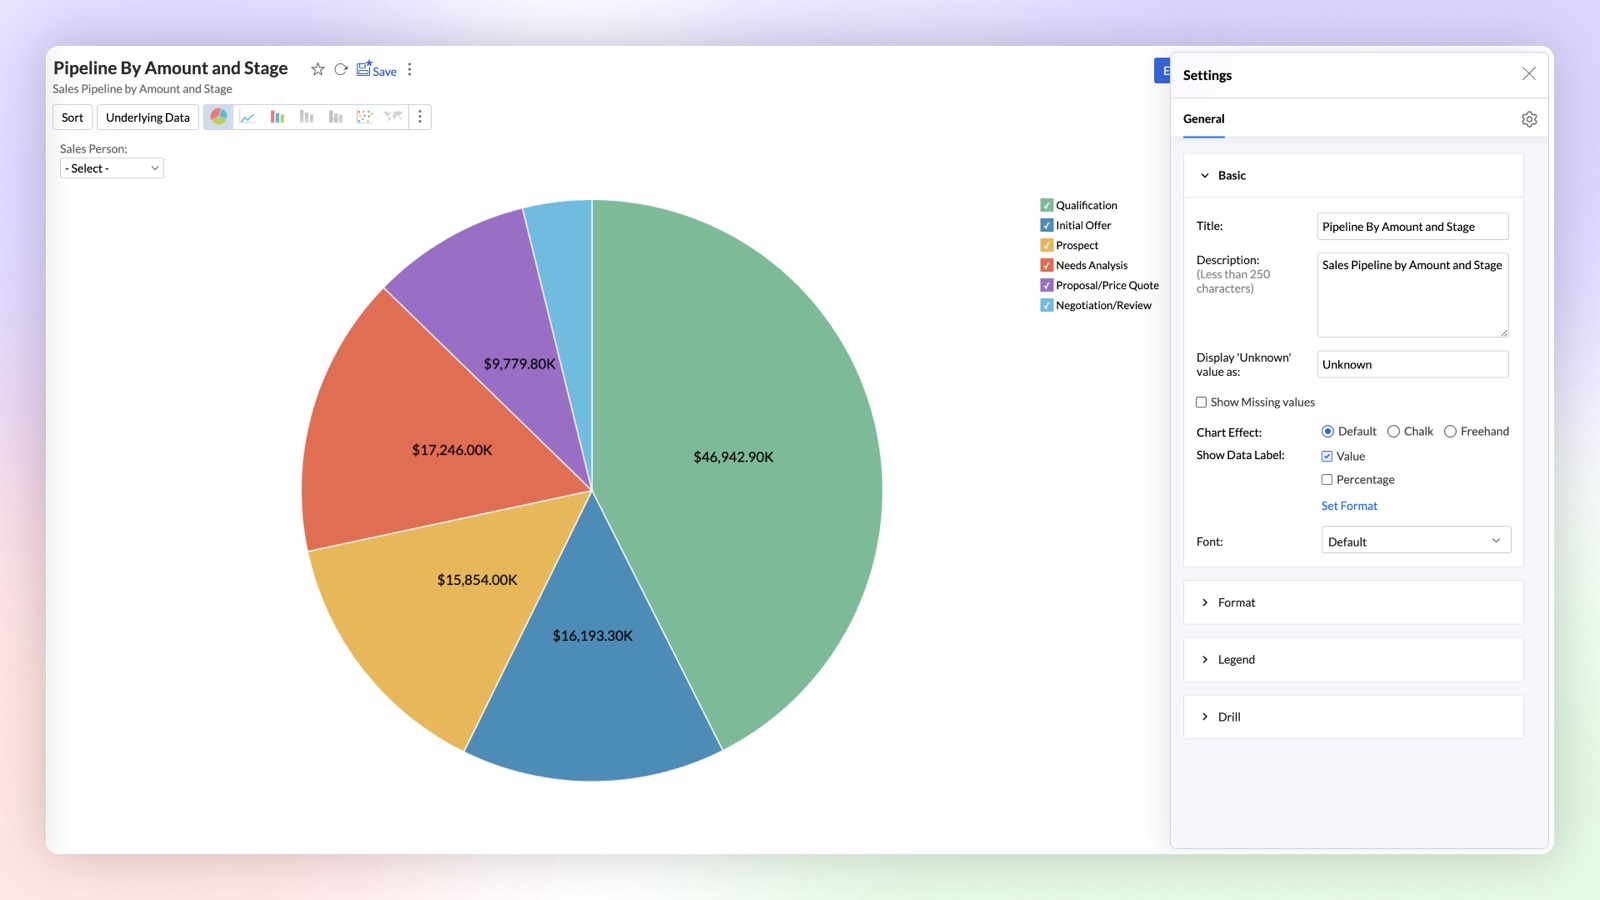
Chart Creation as API
Chart creation APIs in Zoho Analytics allow you to programmatically generate various types of charts by customizing data inputs, applying filters, and configuring chart properties. These APIs offer flexibility to create dynamic visual reports directly through code.
Pivot enhancements
Conditional Formatting over other columns in Pivot
This enhancement empowers you to create more dynamic and insightful Pivot Tables by allowing you to apply conditional formatting rules over any column based on the values of another column.
Click here to learn more.
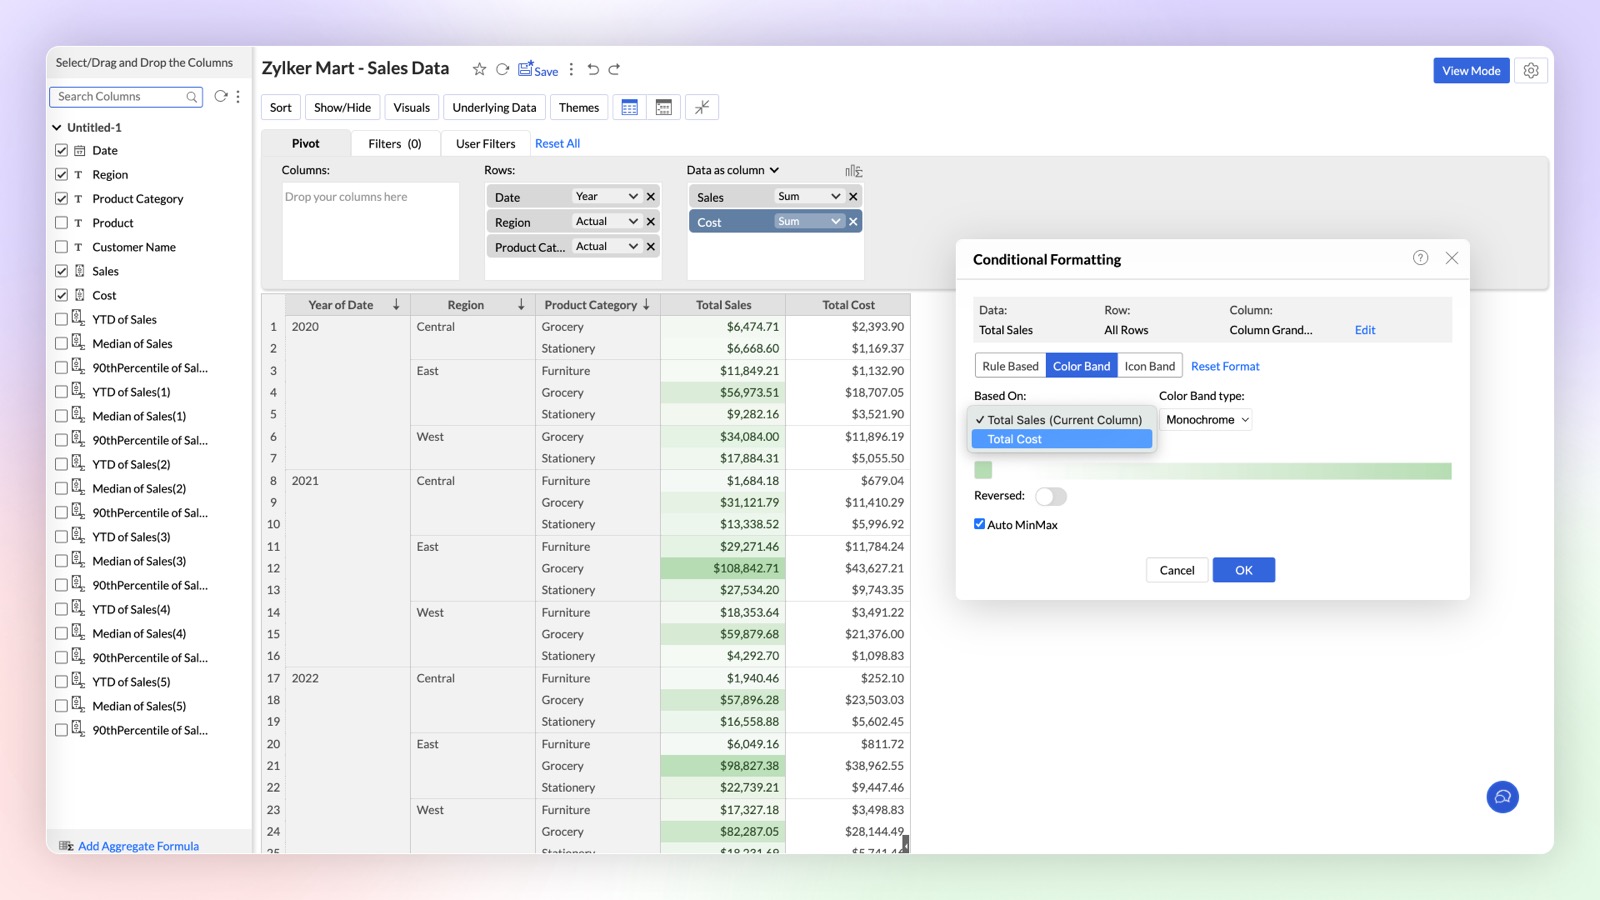
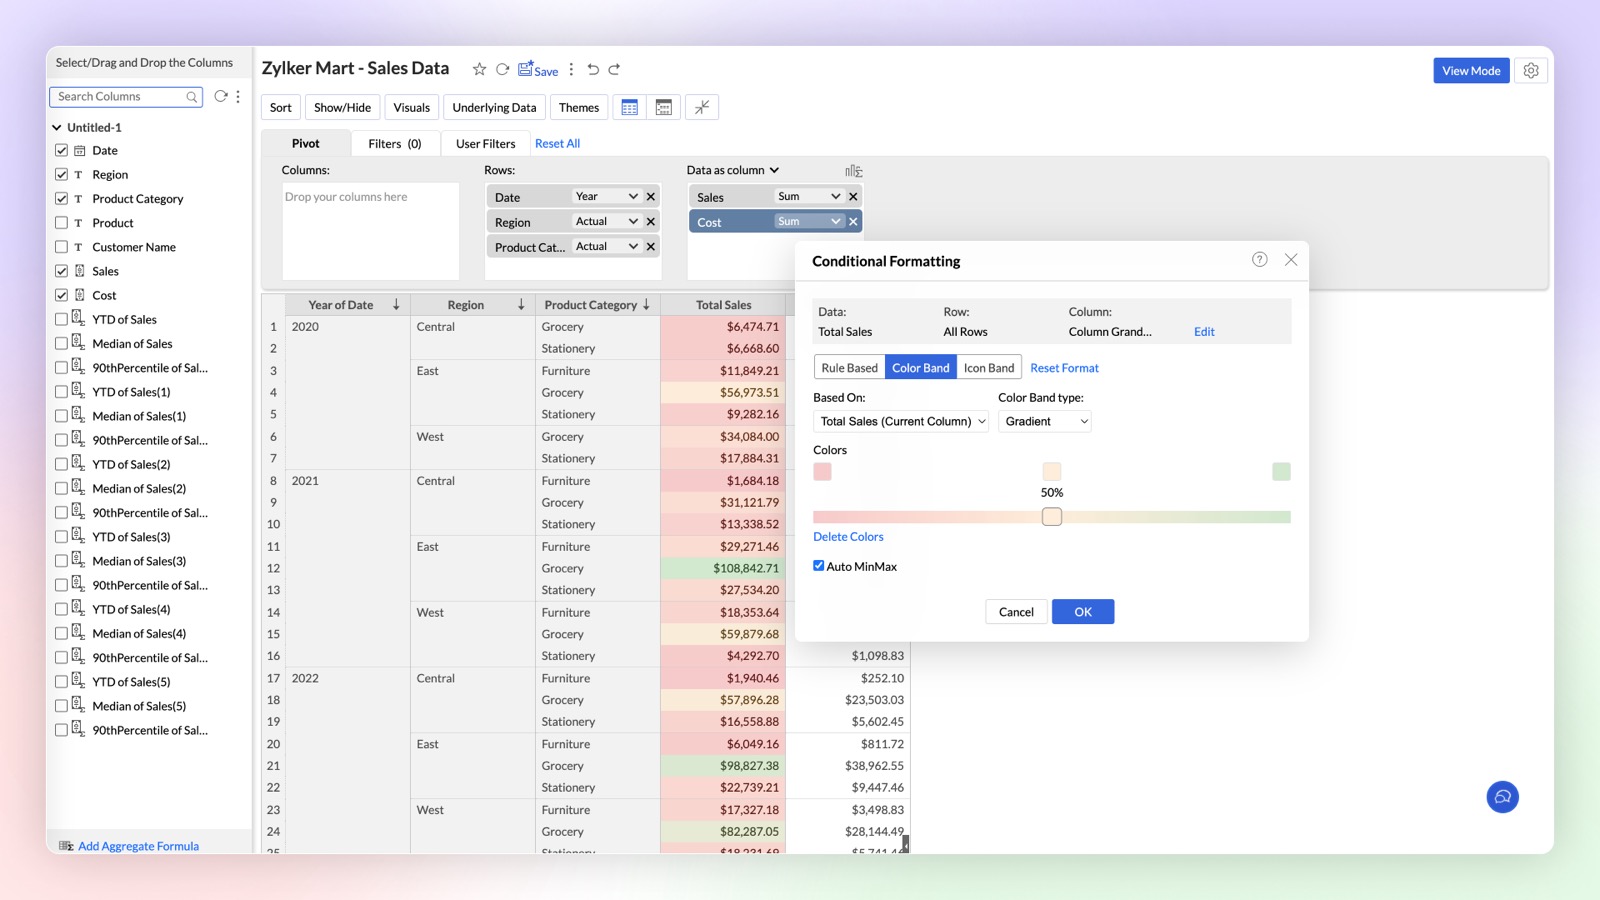
New Conditional Formatting: Color & Icon Bands
Zoho Analytics introduces enhanced Conditional Formatting with Color and Icon Bands in Pivot Tables. This update brings a new level of visual customization, allowing you to highlight critical data points and enhance data comprehension directly within your Pivot Tables.
Click here to learn more.
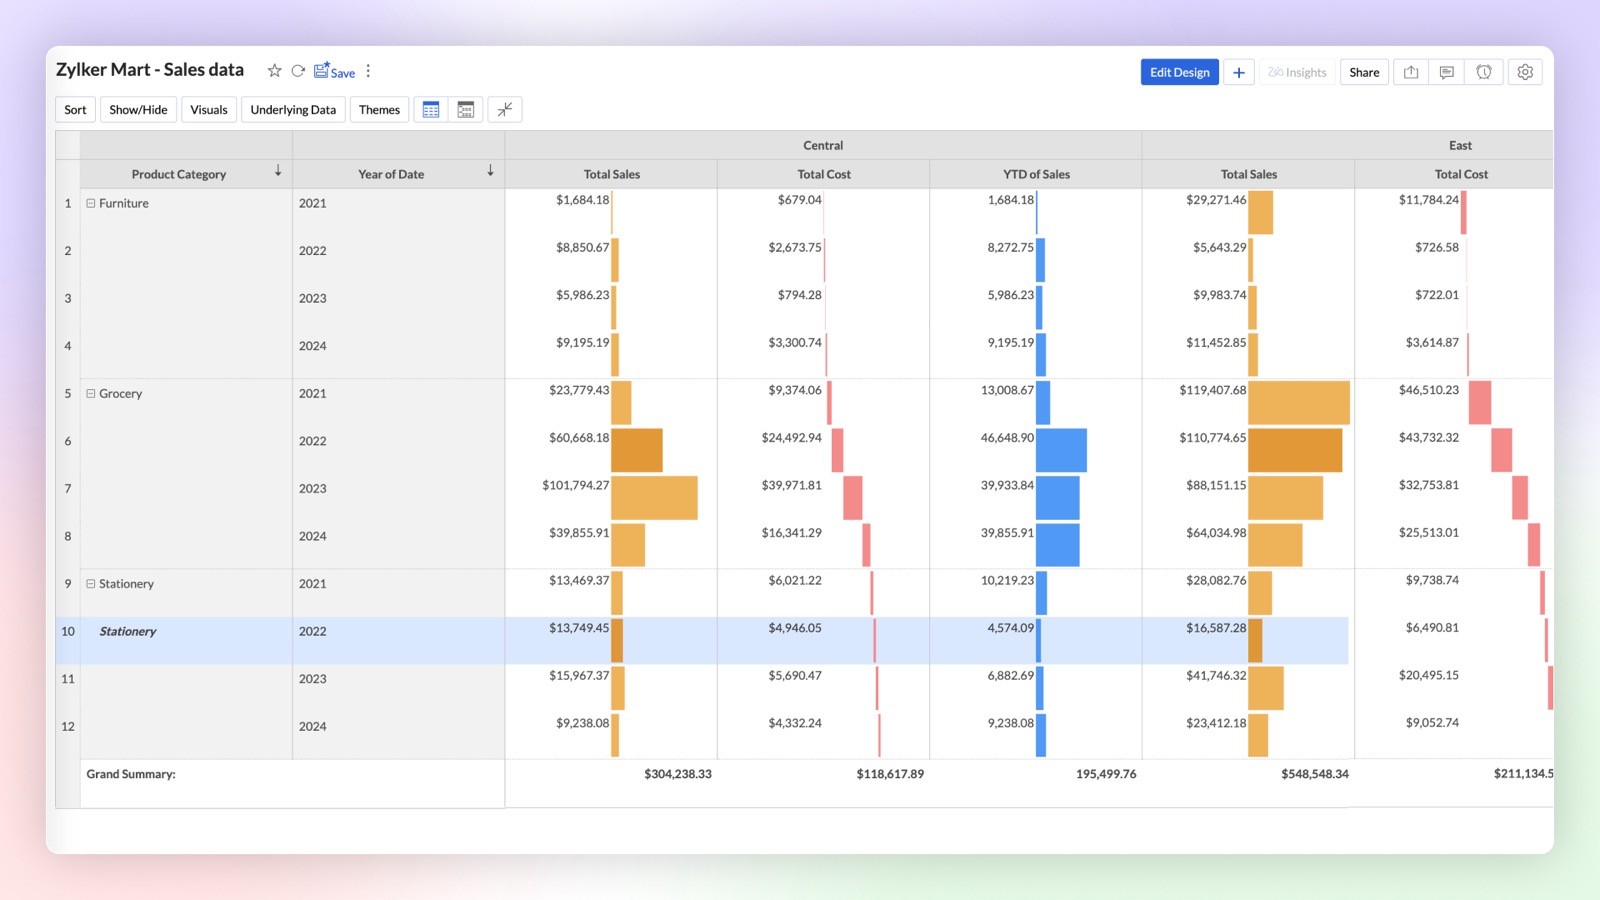
Data Bars & Waterfall Charts in Pivot
Introducing Data Bars and Waterfall (Bar Range) Charts in pivot tables to analyze complex data sets and highlight key insights directly within your pivot tables. Upgrade your data visualization game with Data Bars and Waterfall Charts in Zoho Analytics. Start transforming your Pivot Tables into powerful storytelling tools today!
Dashboard Enhancements
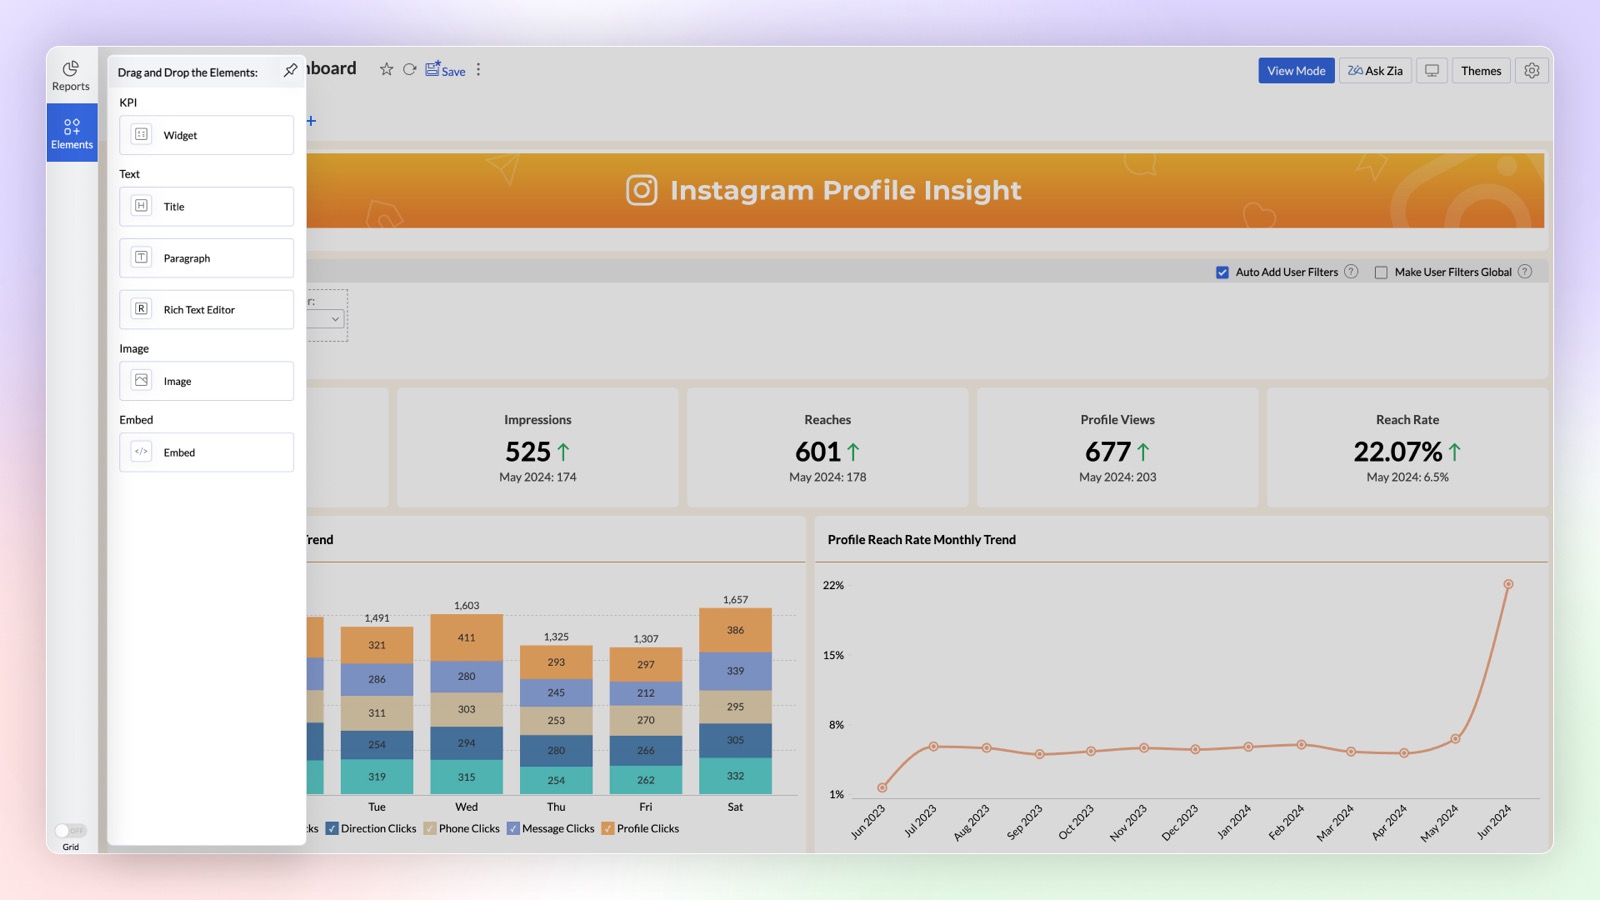
Add Elements in Dashboard
The Dashboard Designer interface now includes an "Add Elements" section for easily incorporating widgets, text, images, and embedded URLs into your dashboard. Simply drag and drop these elements to add them. The Text element offers enhanced formatting options, while the Image element features a built-in editor for direct image customization.
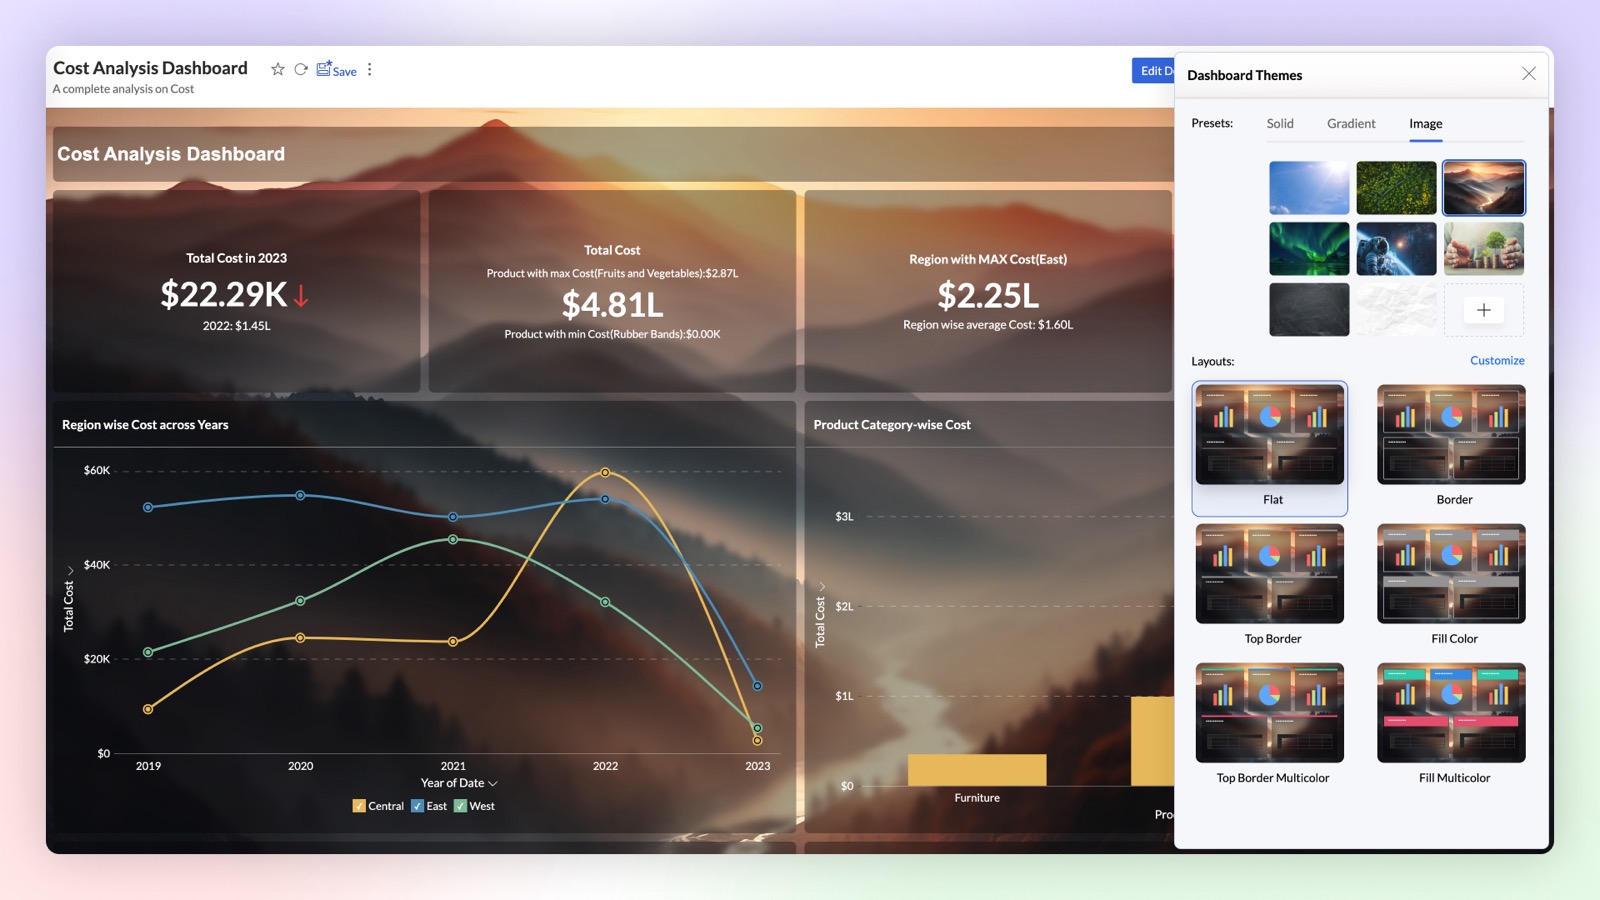
Enhanced Themes and Background in Dashboard
Want to create stunning dashboards with reports over transparent cards and image as background? Try our new themes and background card effect feature. With wide customization options to improve the visual aesthetics, this helps enhance the clarity of the reports and widgets.
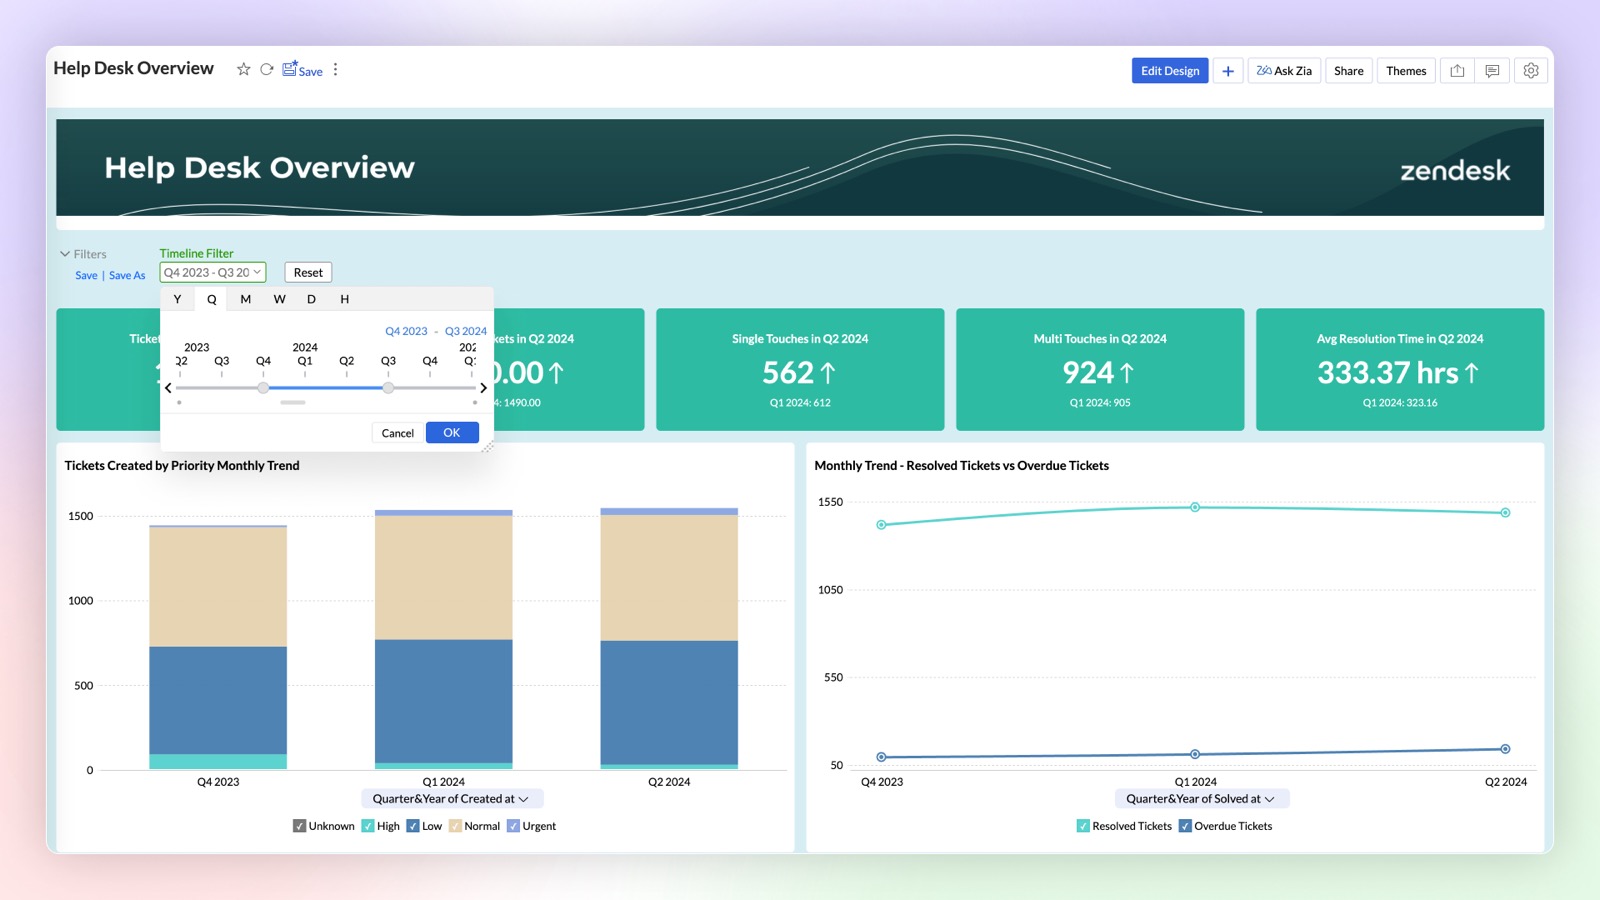
Changing date functions based on Time Slicer
Enhance user interaction on your dashboard by dynamically adjusting the date functions of reports based on the applied Time Slicer. The selected date function and interval in the Time Slicer will automatically update the date functions across all reports within the dashboard.
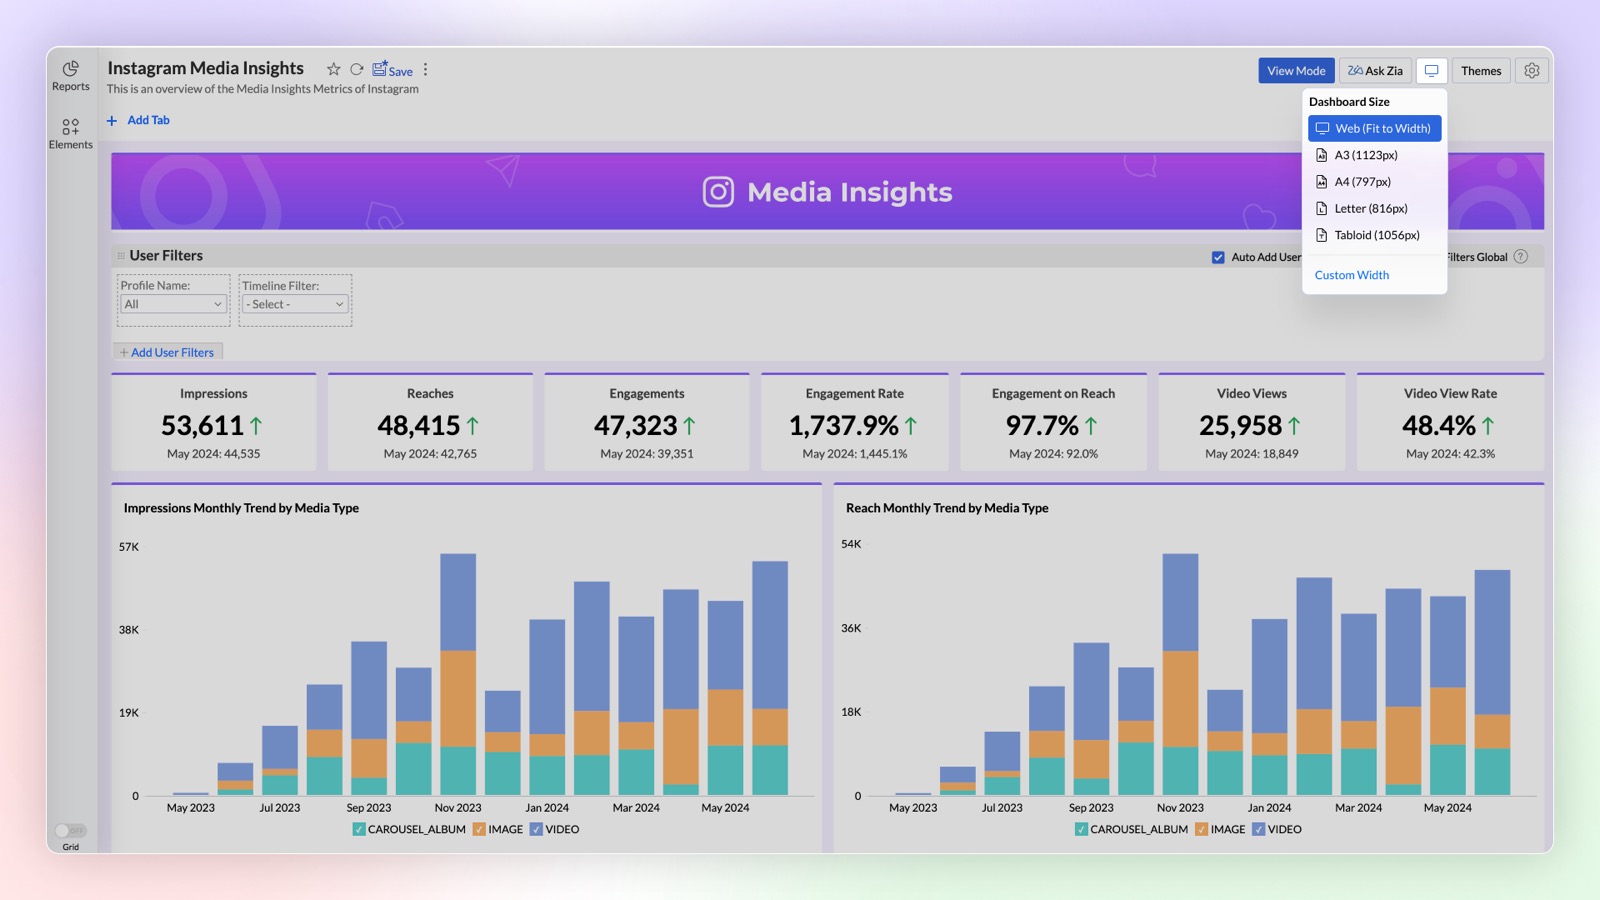
Customizing the width of Dashboard Designer Area
You can now customize the width of the Dashboard layout to suit your specific design needs. By setting the desired width, you can also design dashboards that could fit in applications where you are embedding them, ensuring a visually appealing layout.
Widget Enhancements
- Image support in widgets: Enhance your dashboard’s visual appeal and user engagement by adding custom icons to KPI widgets to convey information at a glance, without lengthy descriptions. You can use the in-built image customization options like changing color, cropping, etc., to cater your needs.
- Widgets with forecast: Based on your current data trend, get a better understanding of how close you are to your goals by adding forecast value to your widgets.
Export as PPT
You can now export a dashboard as a Microsoft PowerPoint file. The snapshot of each view in the dashboard will be exported as an individual slide.
Copy and Paste Reports in Dashboard
Now you can easily copy and paste the reports in your dashboard from one tab to another.
Interactive Customizations
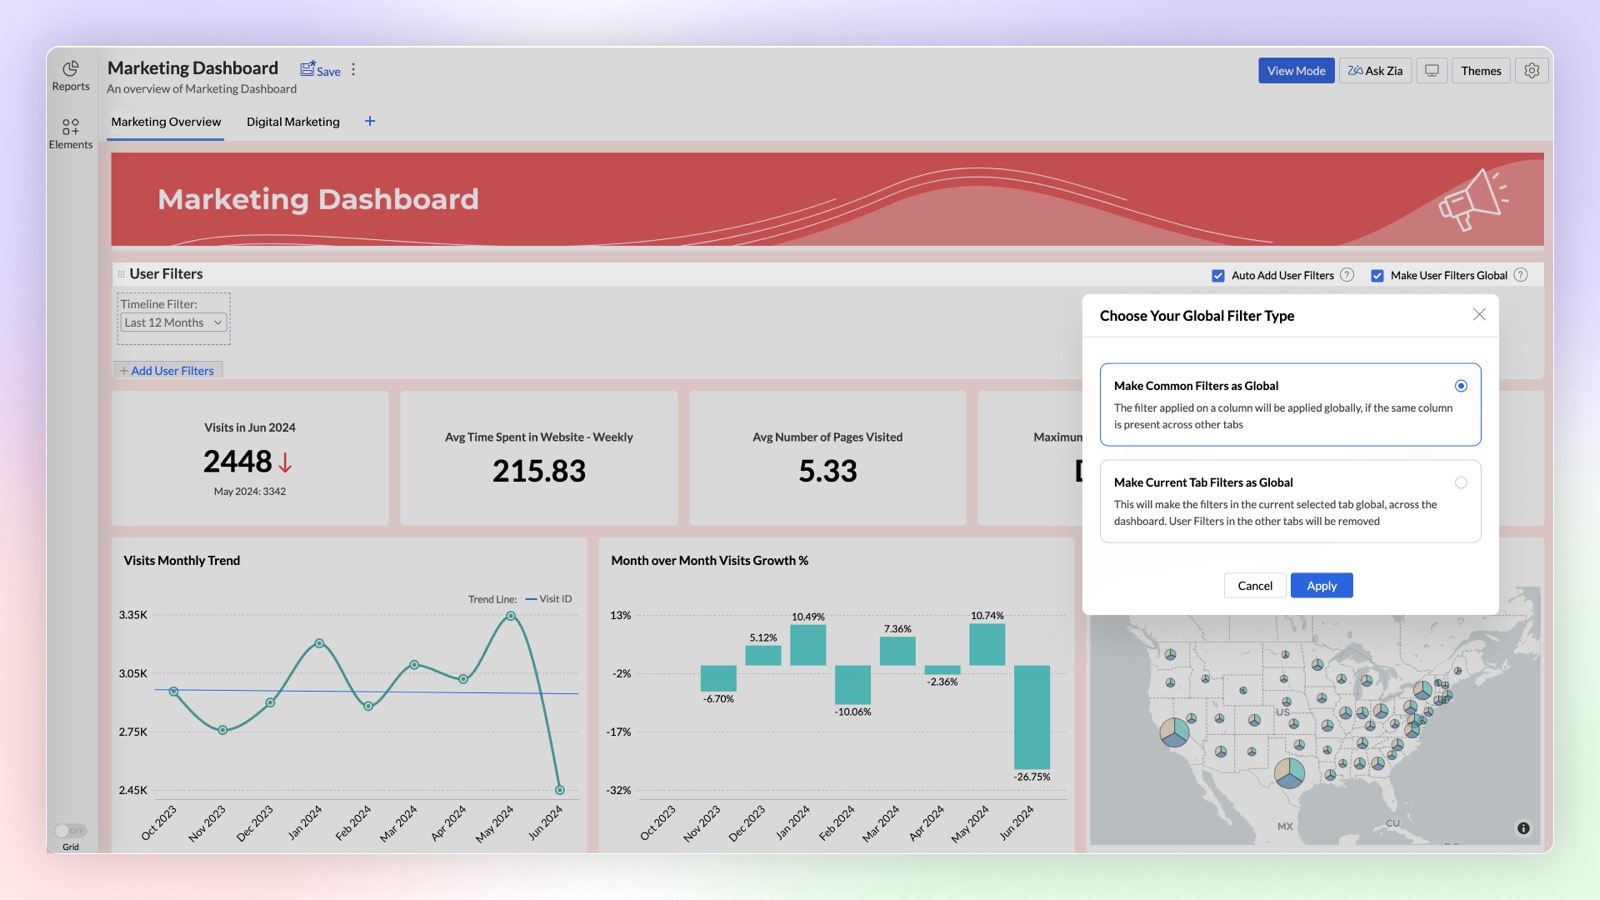
Global User Filters
Expand the functionality of Global User Filters in your dashboard for deeper analysis with our latest enhancement. You can either select common filters across tabs as global filters or apply the same filter to all tabs when they share the same base data.
Click here to learn more.
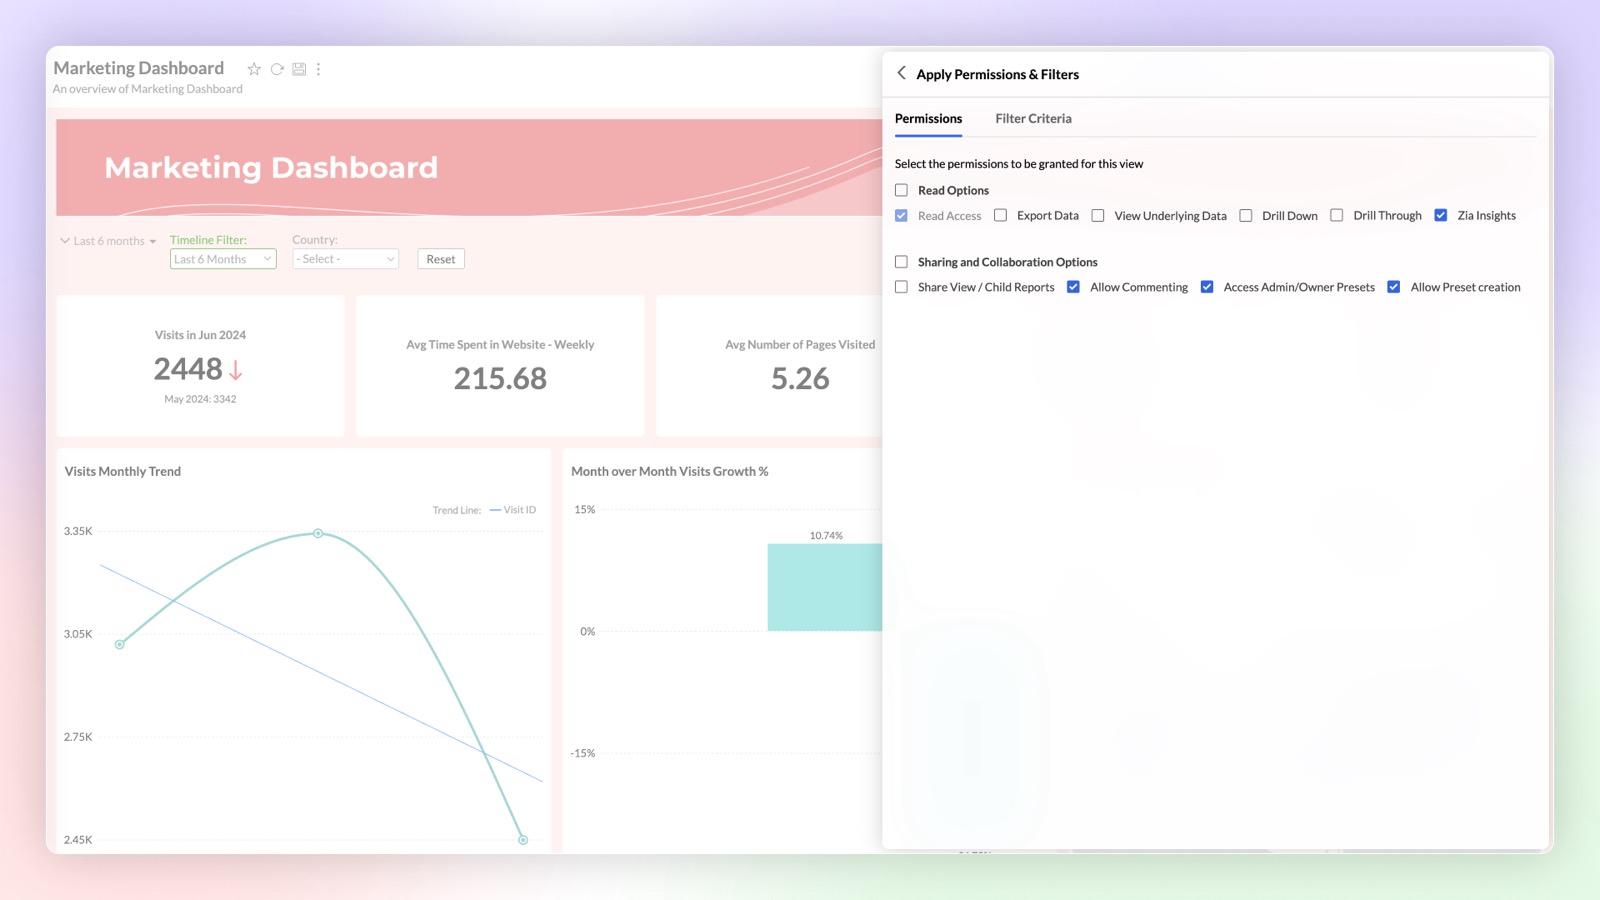
Sharing User Filter Presets
You can now share saved user filter presets with other users. Dashboard users can utilize the shared presets or create their own custom presets.
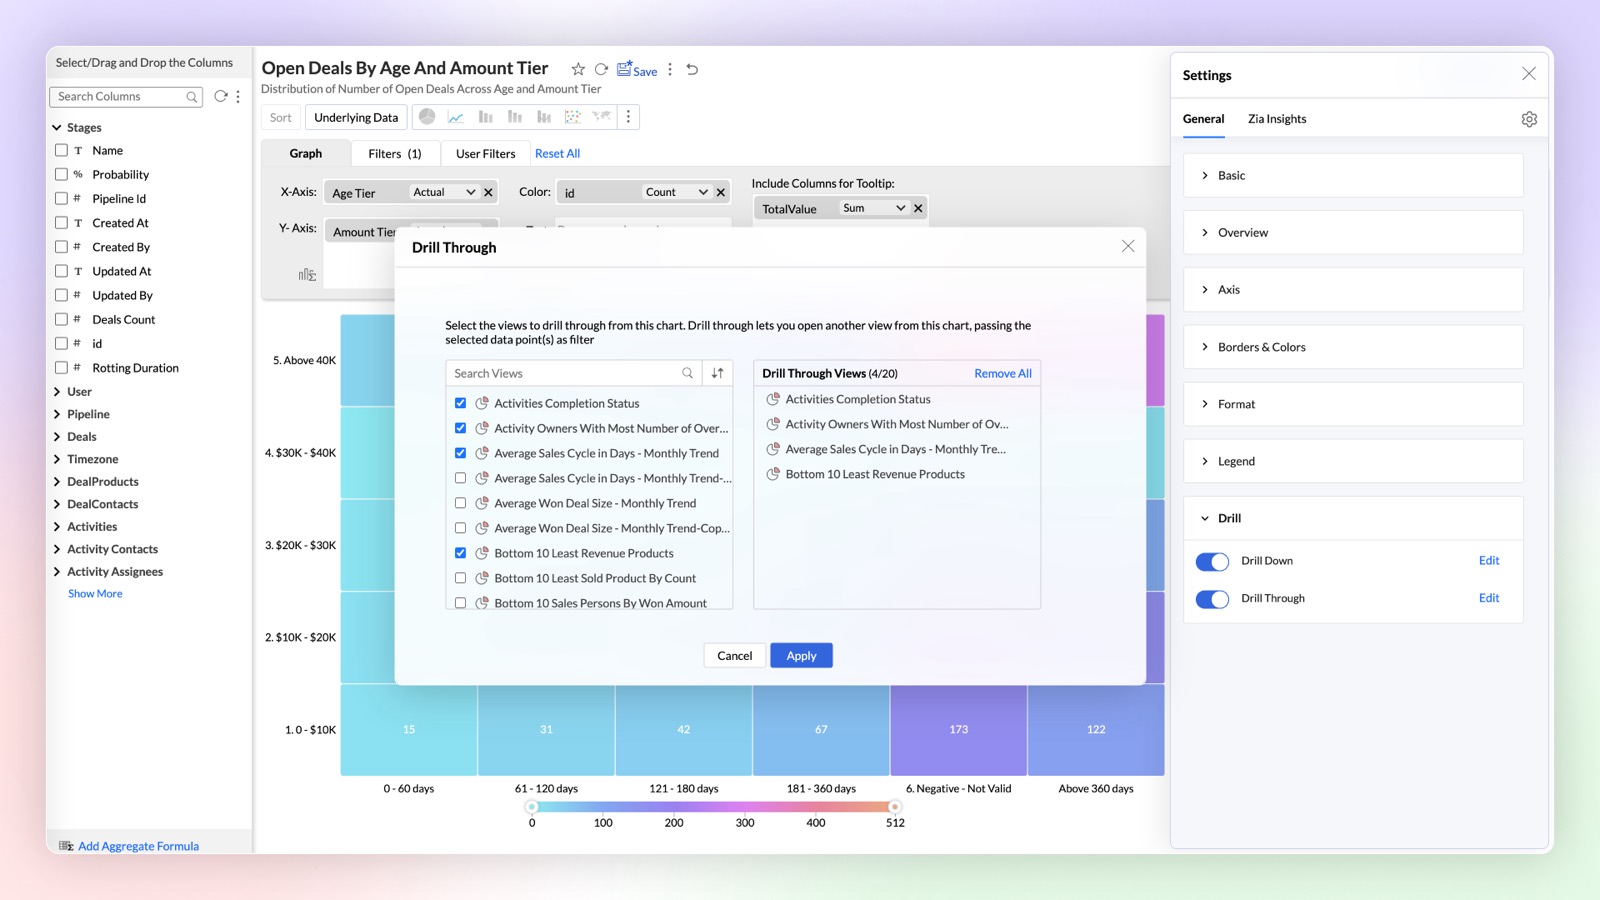
Drill Through
Navigate and view the reports related to the specific data points using the drill through function. You can easily link all the related reports specific to a metric or dimension.
Click here to learn more.
Generative AI Infused Analytics
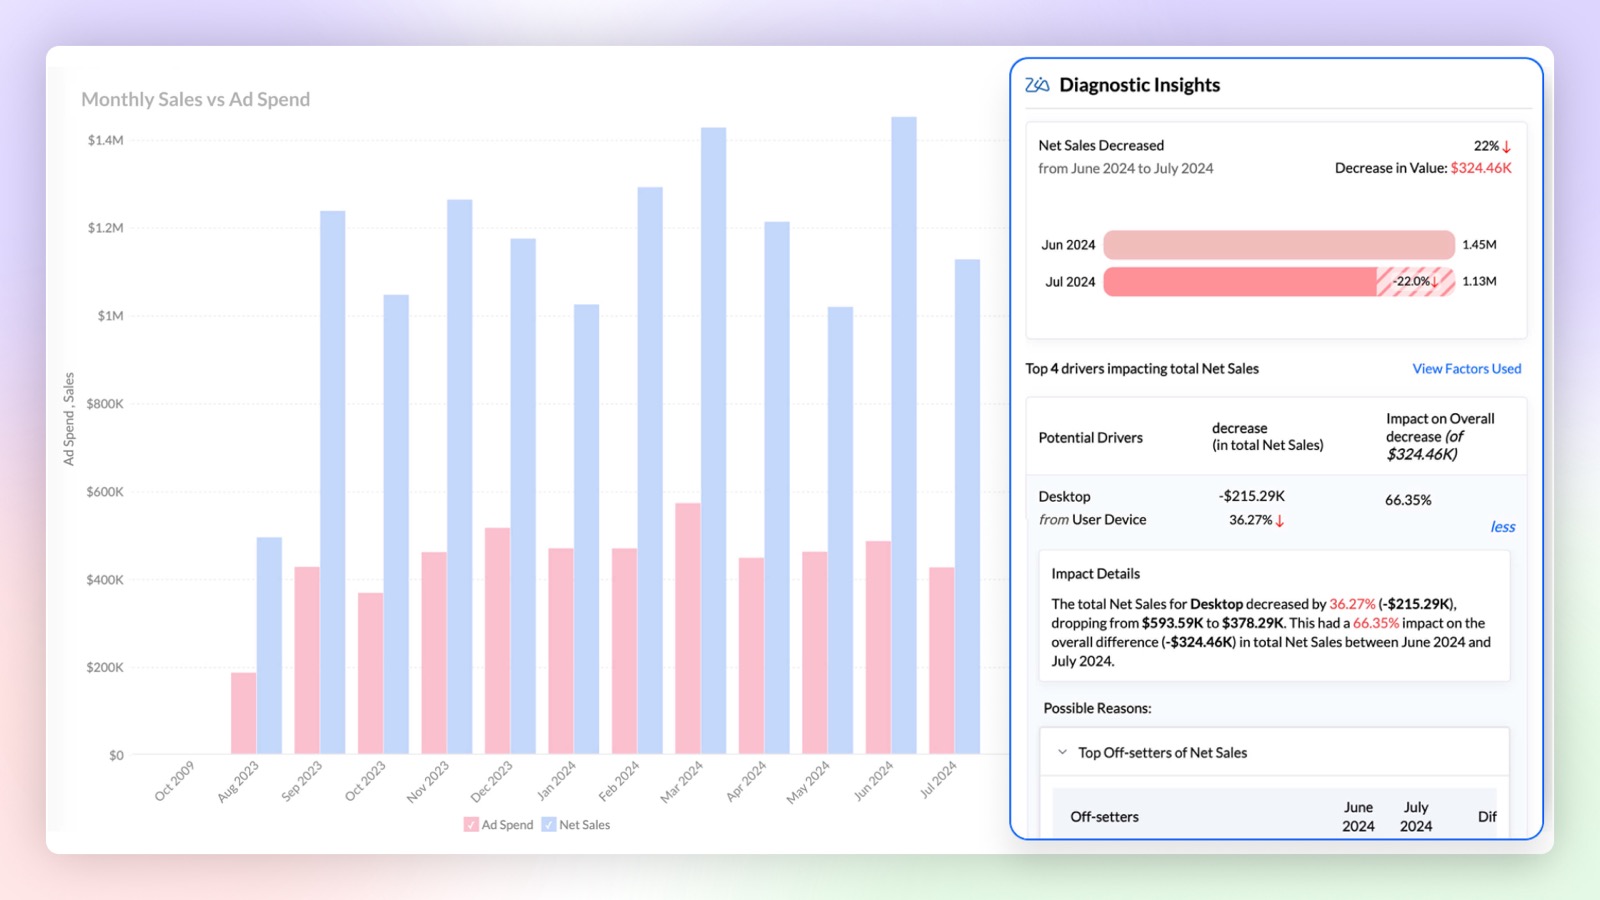
Diagnostics Insights
Find out the reason 'Why' behind any insight with diagnostic insights. Analyze the key drivers with significant impact and take informed actions based on these insights.
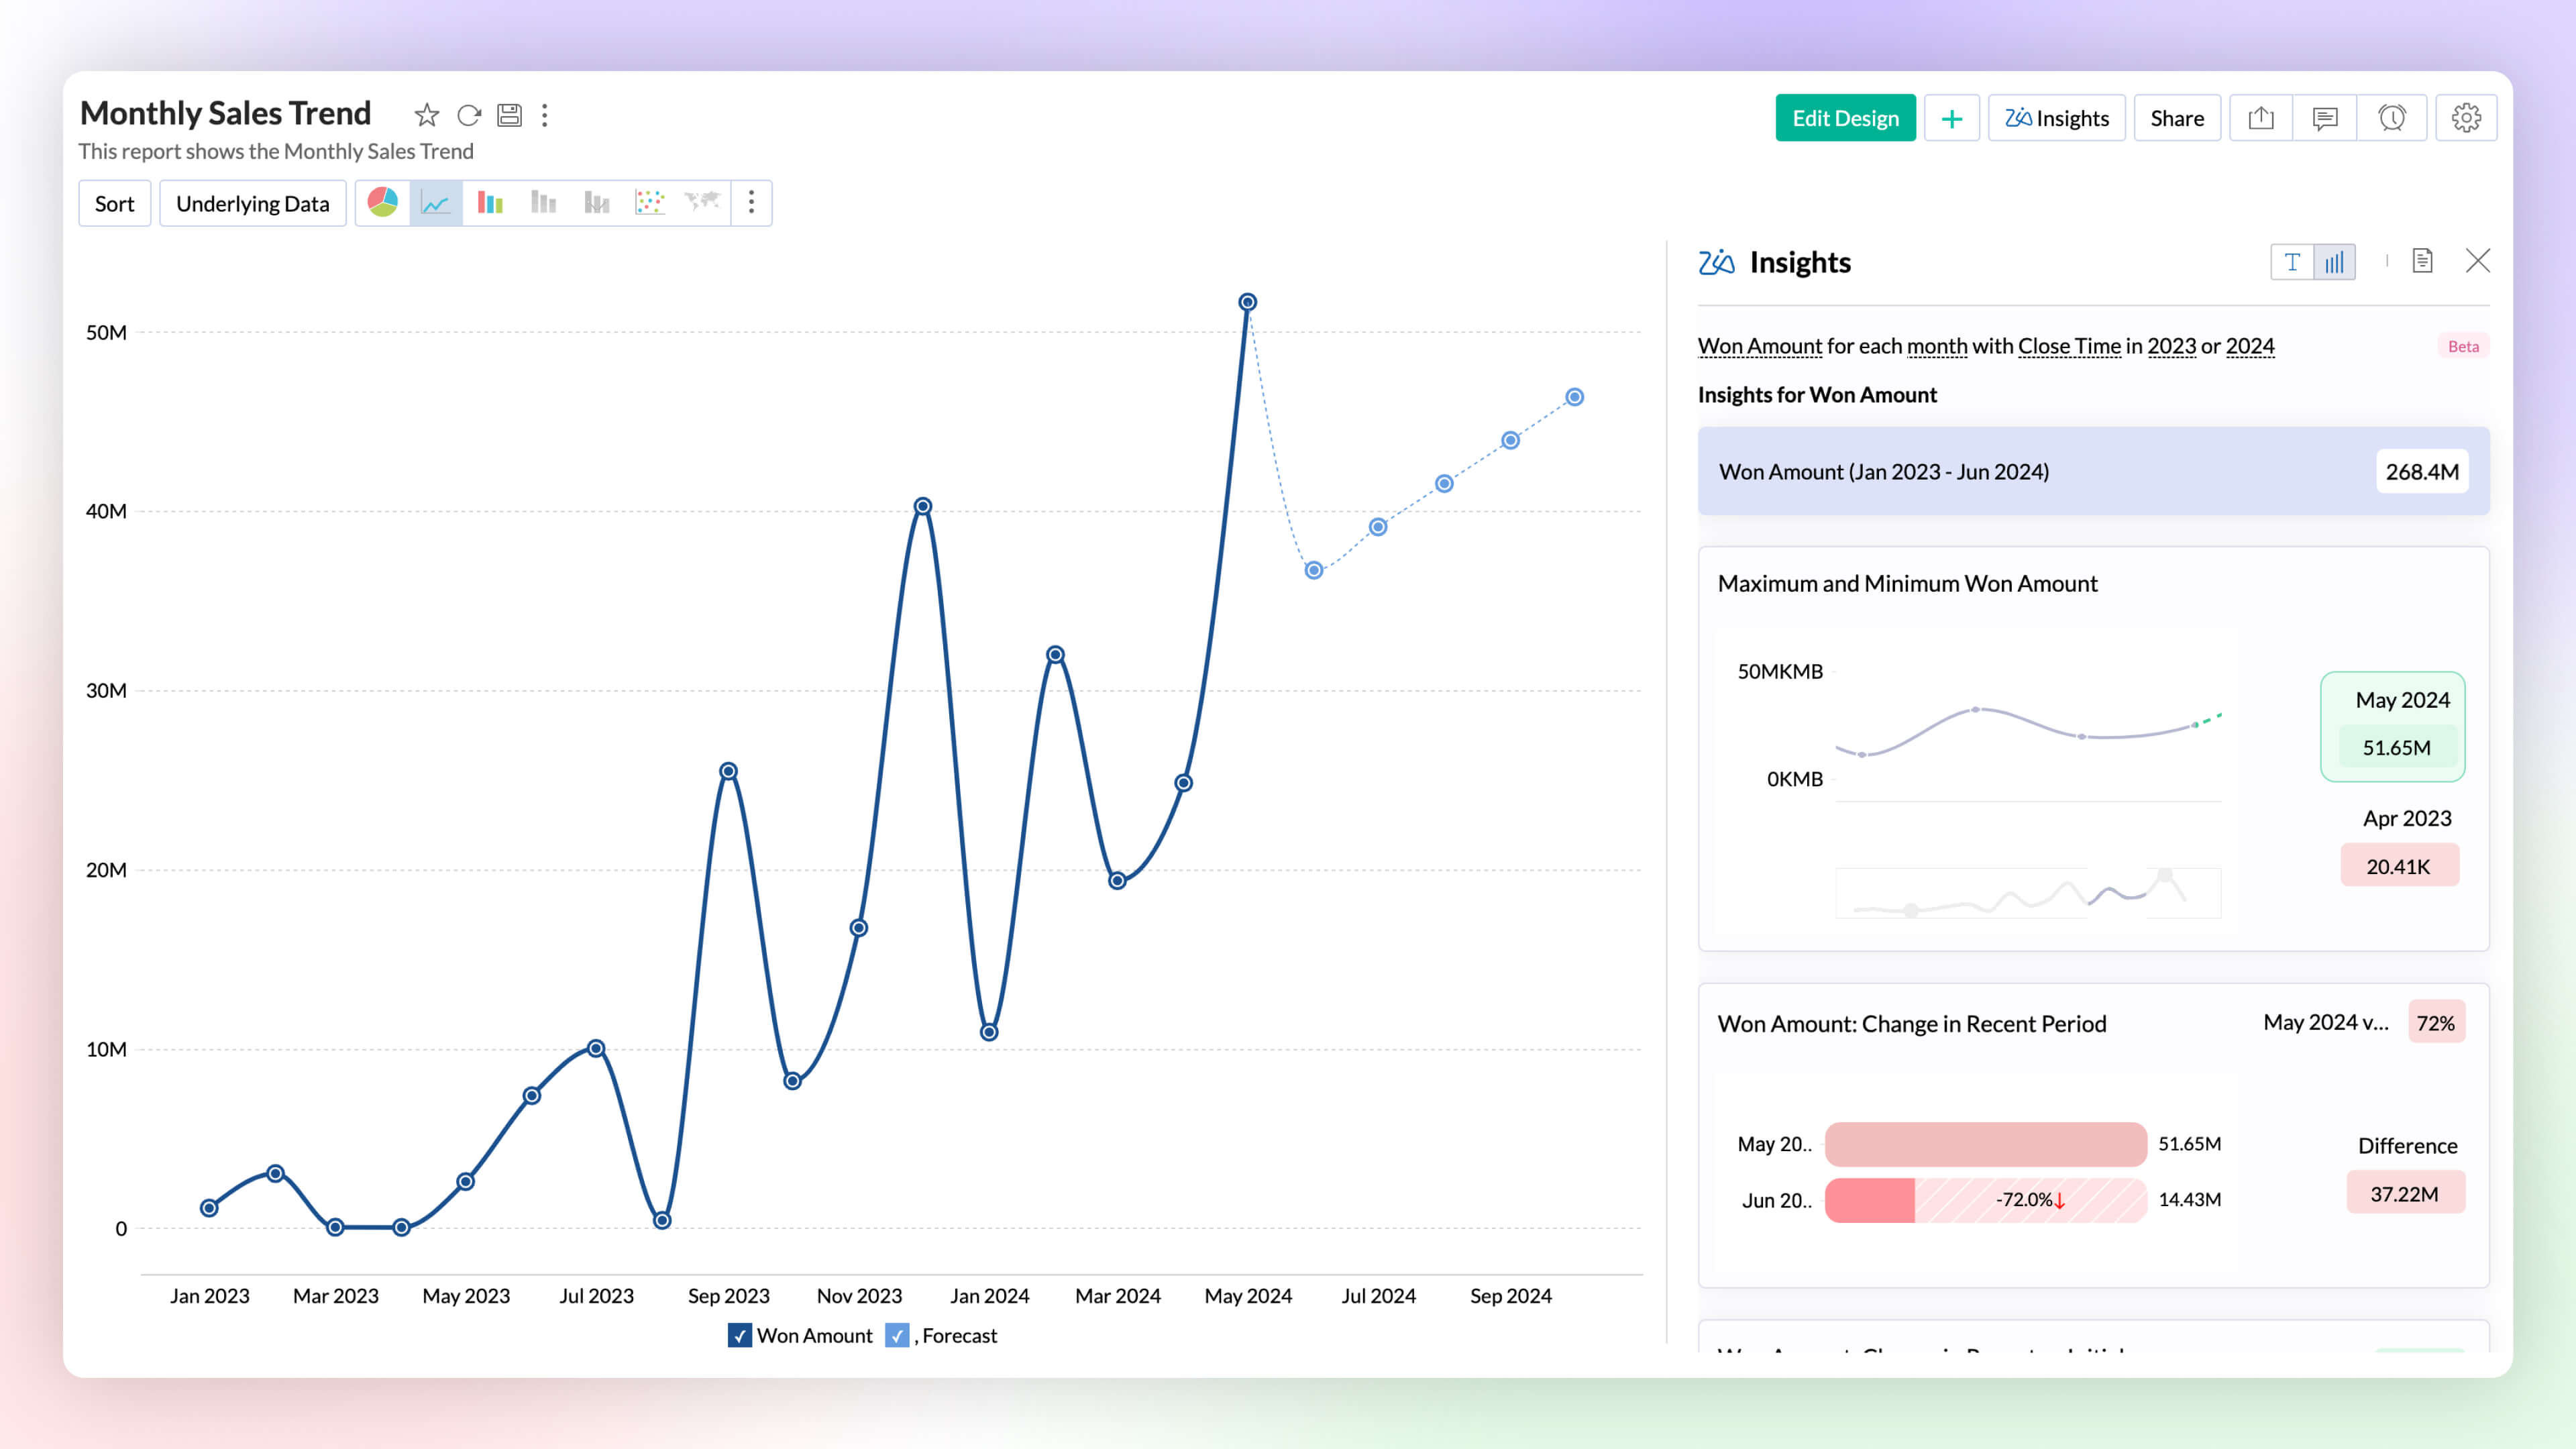
Visual Zia Insights
Zia Insights now provides visual narratives! Visuals help process information far more efficiently than lengthy text descriptions. These visuals facilitate multi-dimensional interpretations like comparison, contribution, distribution, trends and proportions.
Click here to learn more.
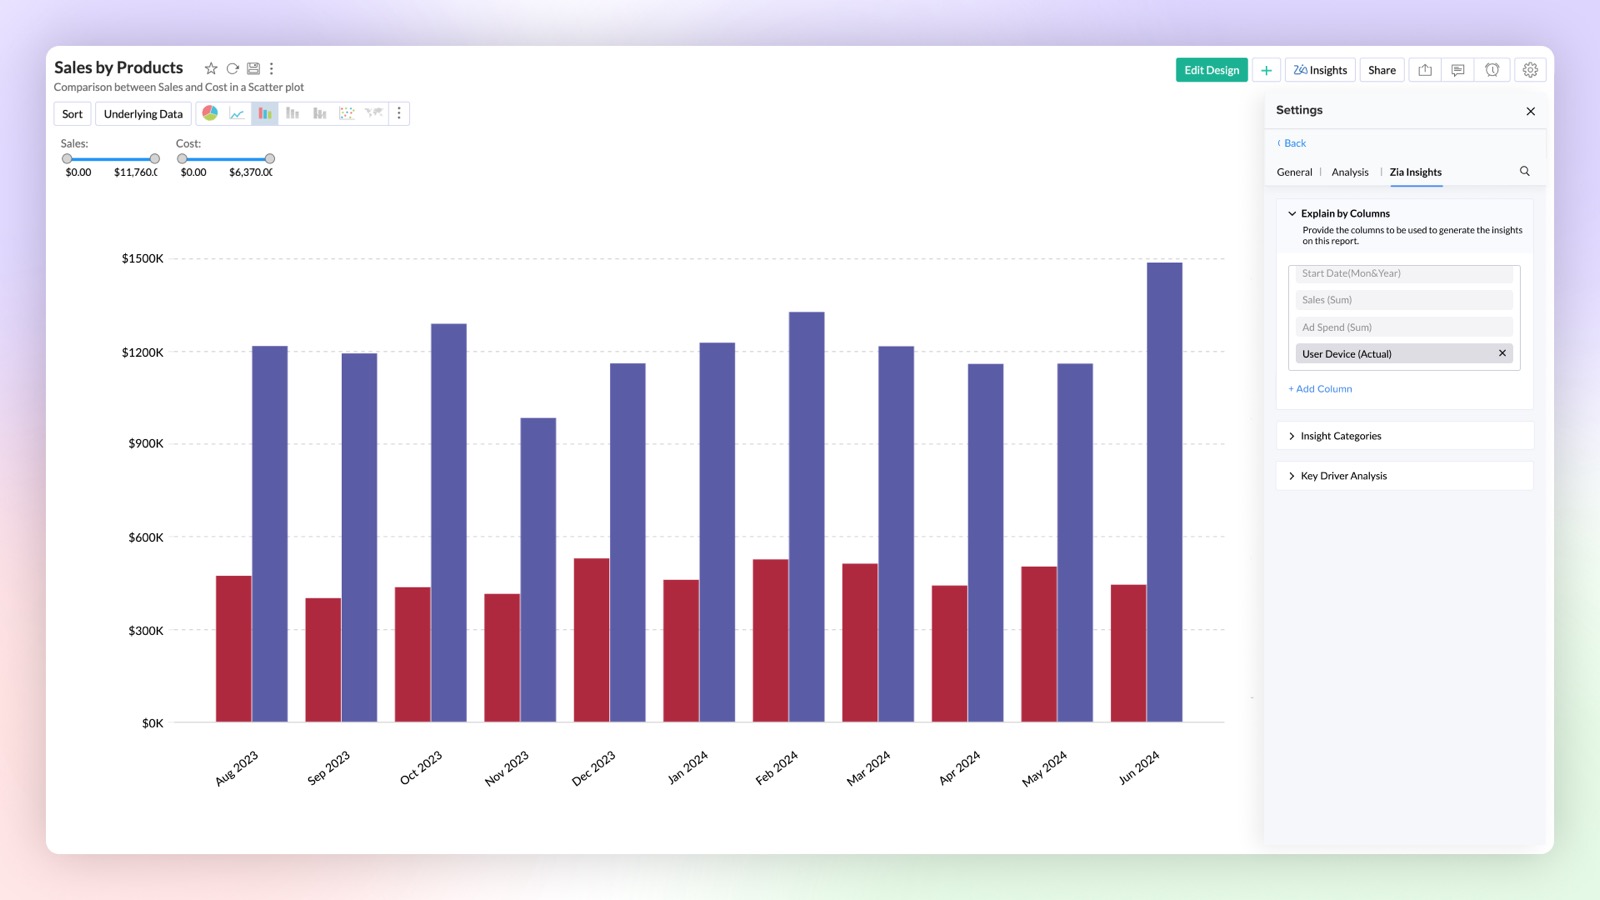
Configurable Insights
Customize the insights generated by Ask Zia to focus on the columns of your choice. This feature provides configurable insights tailored to your selected data.
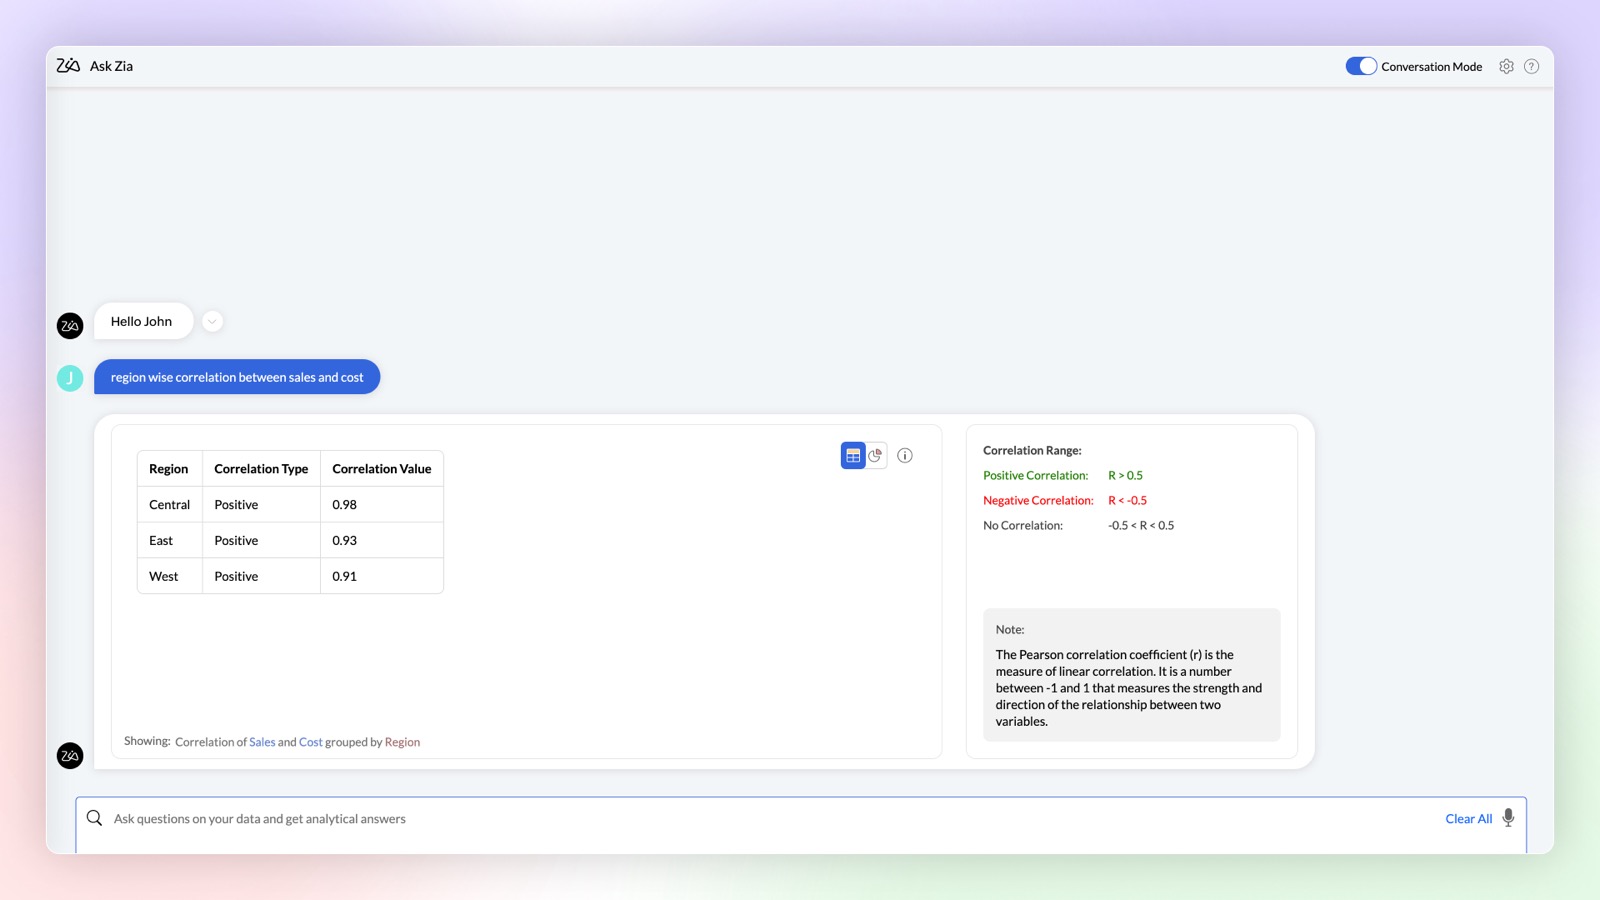
Complex Queries
Ask Zia in conversation mode can now provide you with results for complex mathematical queries to find correlation and trend strength in your data.
Click here to learn more.
Enhancements in OpenAI Integration
- Increase the accuracy of your OpenAI results in Ask Zia by using your workspace metadata. This can be done by enabling the OpenAI RAG (Retrieval-Augmented Generation) feature in Organization Settings.
- You can now use OpenAI in Ask Zia conversation mode to create formulas and make data preparation easier by helping you build complex queries. Type your needs in simple language and get answers instantly.
- Workspace Admins can also use OpenAI integration in Ask Zia.
Ask Zia Bot in Microsoft Teams
Combine the generative AI capabilities of Zoho Analytics' Ask Zia with Microsoft Teams. Get answers to your data queries, access key business insights quickly, predict future trends, and build reports right from within Microsoft Teams with Ask Zia bot.
Click here to learn more.
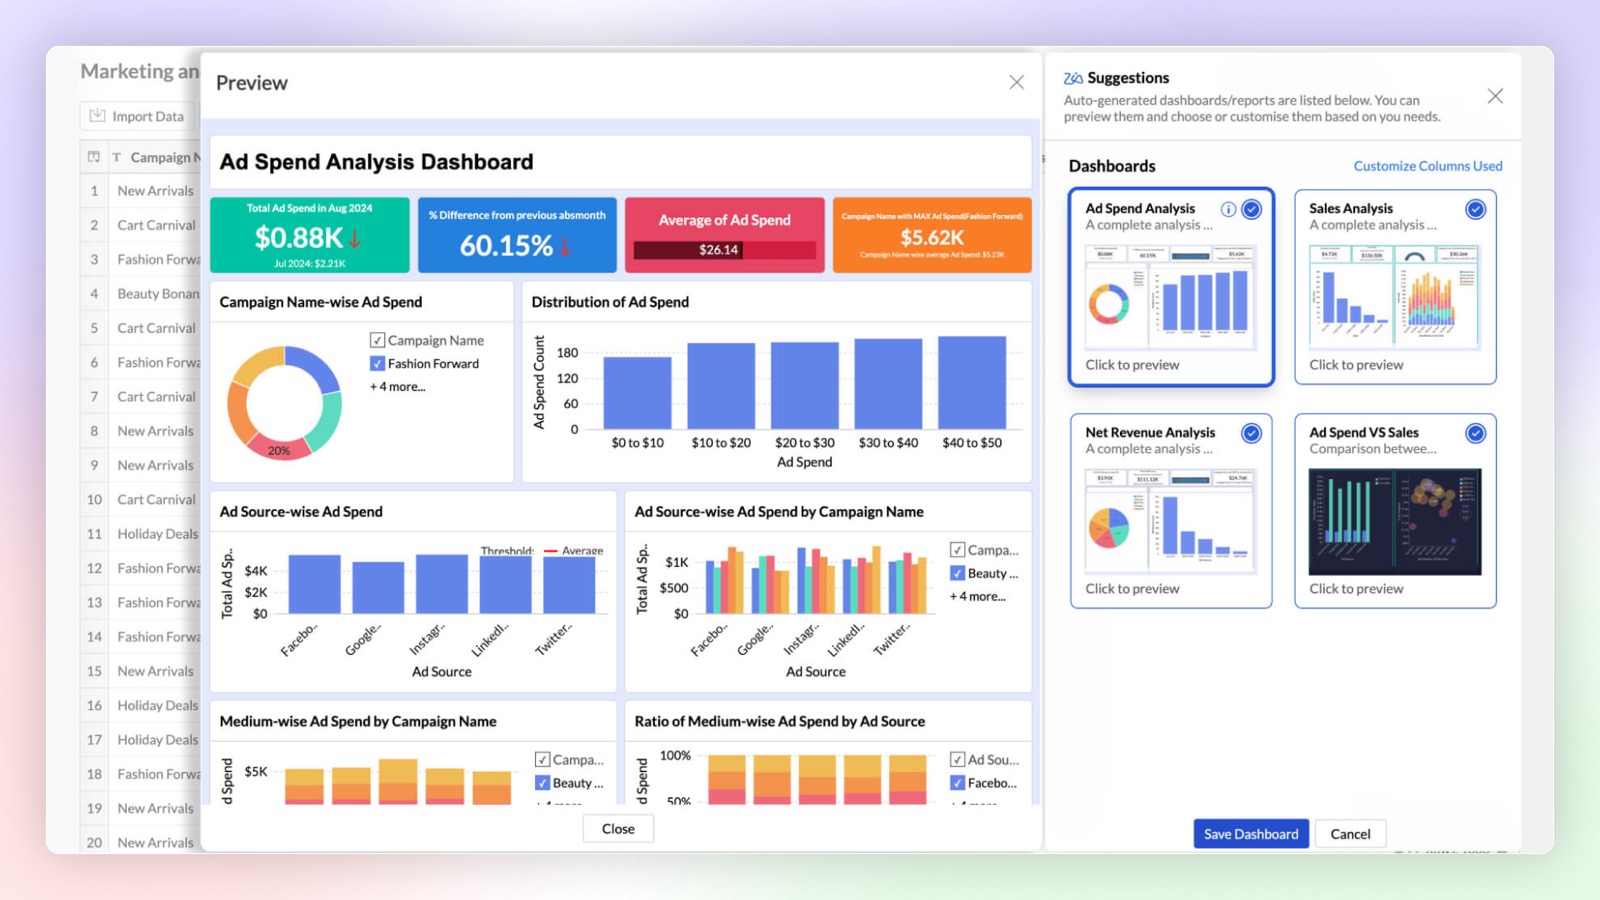
Auto Analyze 2.0
Zoho Analytics offers enhanced control over auto-generated reports and dashboards. You can choose from a list of generated reports and dashboards before adding them, and also select which columns should be auto-analyzed.
Click here to learn more.
Zia Suggestions
Introducing the new Zia Suggestions, where you can receive smart chart recommendations during the creation process. Zia provides tailored chart options based on your data, allowing you to preview and apply them with a single click.
Click here to learn more.
Predictive AI
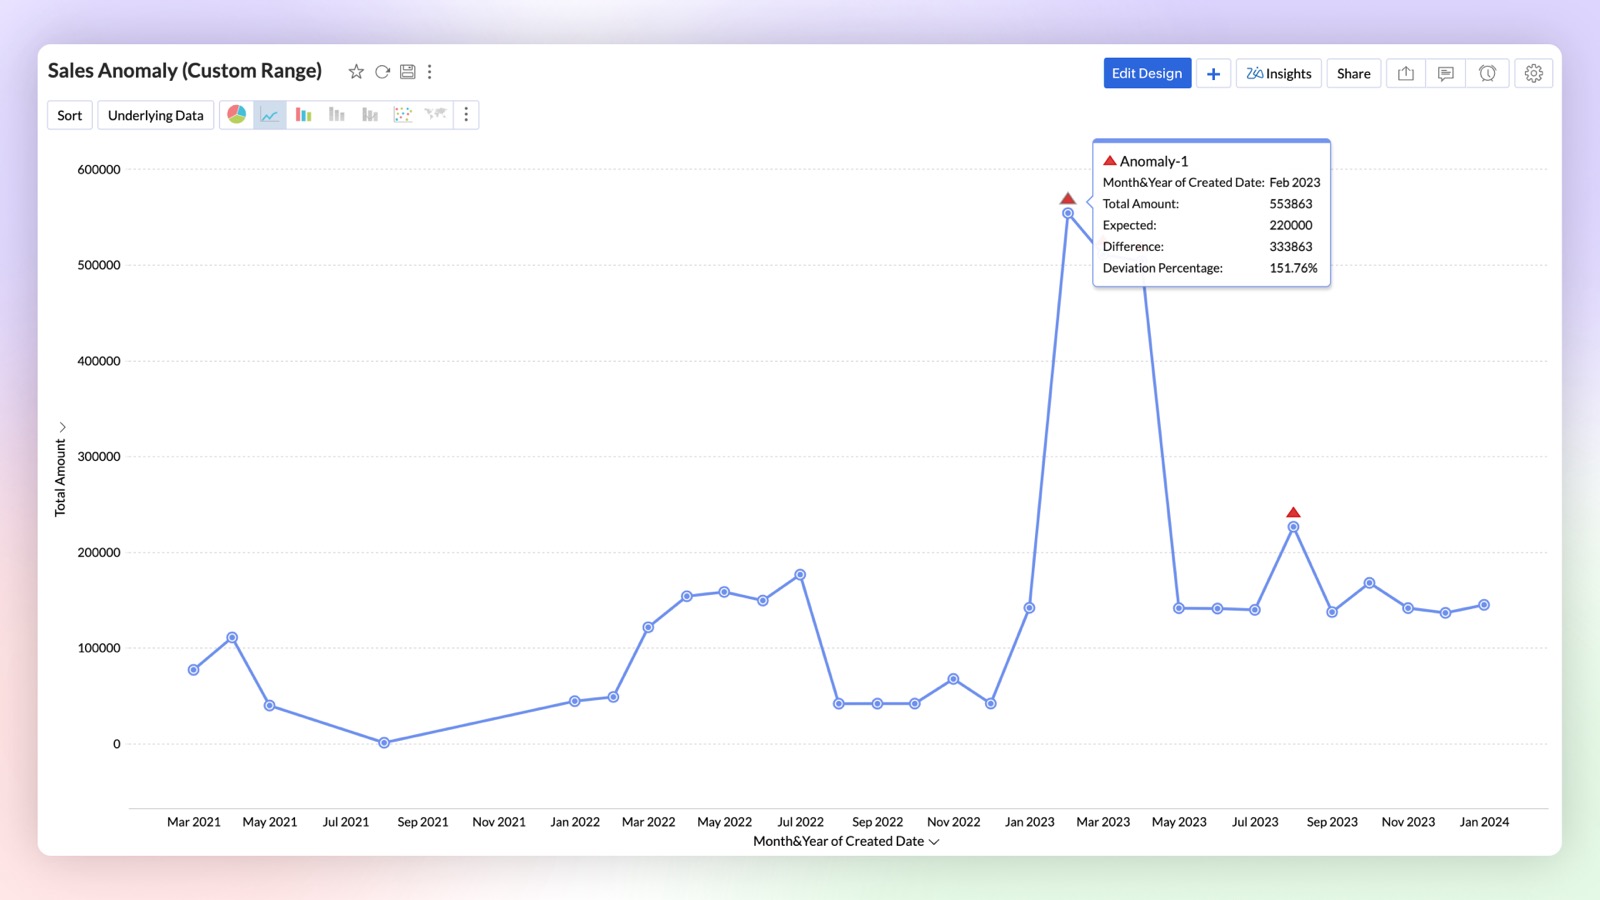
Anomaly Detection
Anomaly detection allows you to easily identify outliers in your data or metrics. You can now create charts that visually highlight these anomalies for quick attention and action. Zoho Analytics uses advanced machine learning algorithms and statistical models to detect outliers. You can also set data alerts based on anomalies to ensure timely identification of vital change in the key business metrics and potential issues.
Click here to learn more.
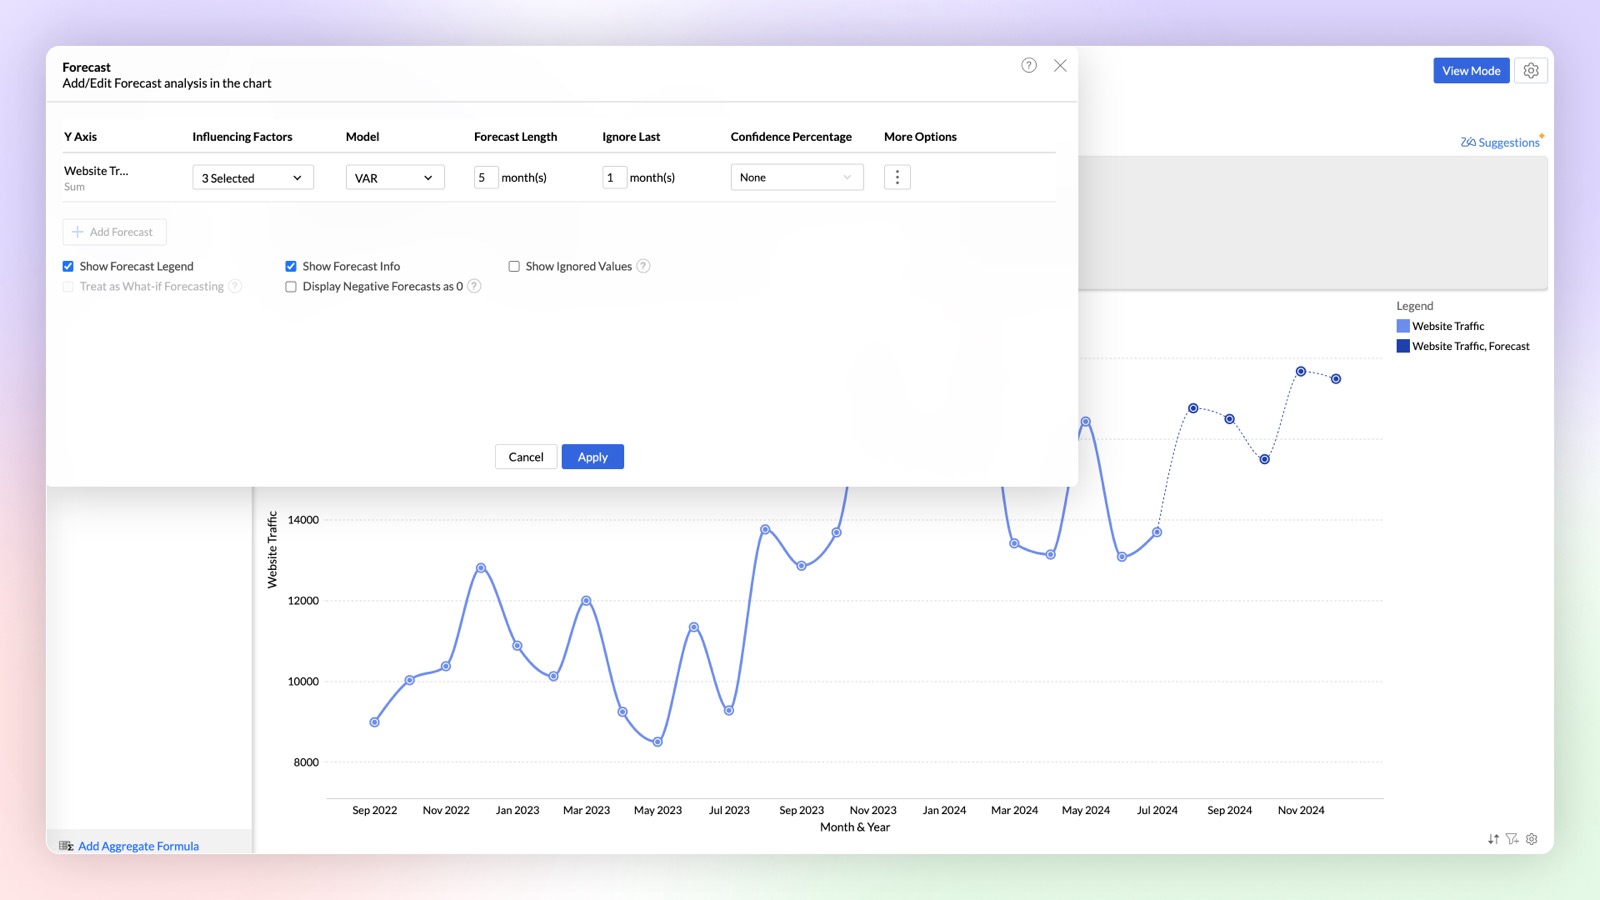
Influencing Factors in Forecasting (Multi-variate forecasting)
Try our new influencing factors option in forecasting, that enables you to provide dependent factors for accurate prediction of outcomes. For example, when you forecast a sales metric it will just predict purely based on historical data, but you can get more accurate predictions in forecast by considering influencing (dependent) factors like marketing spending, sign ups, etc.,
Click here to learn more.
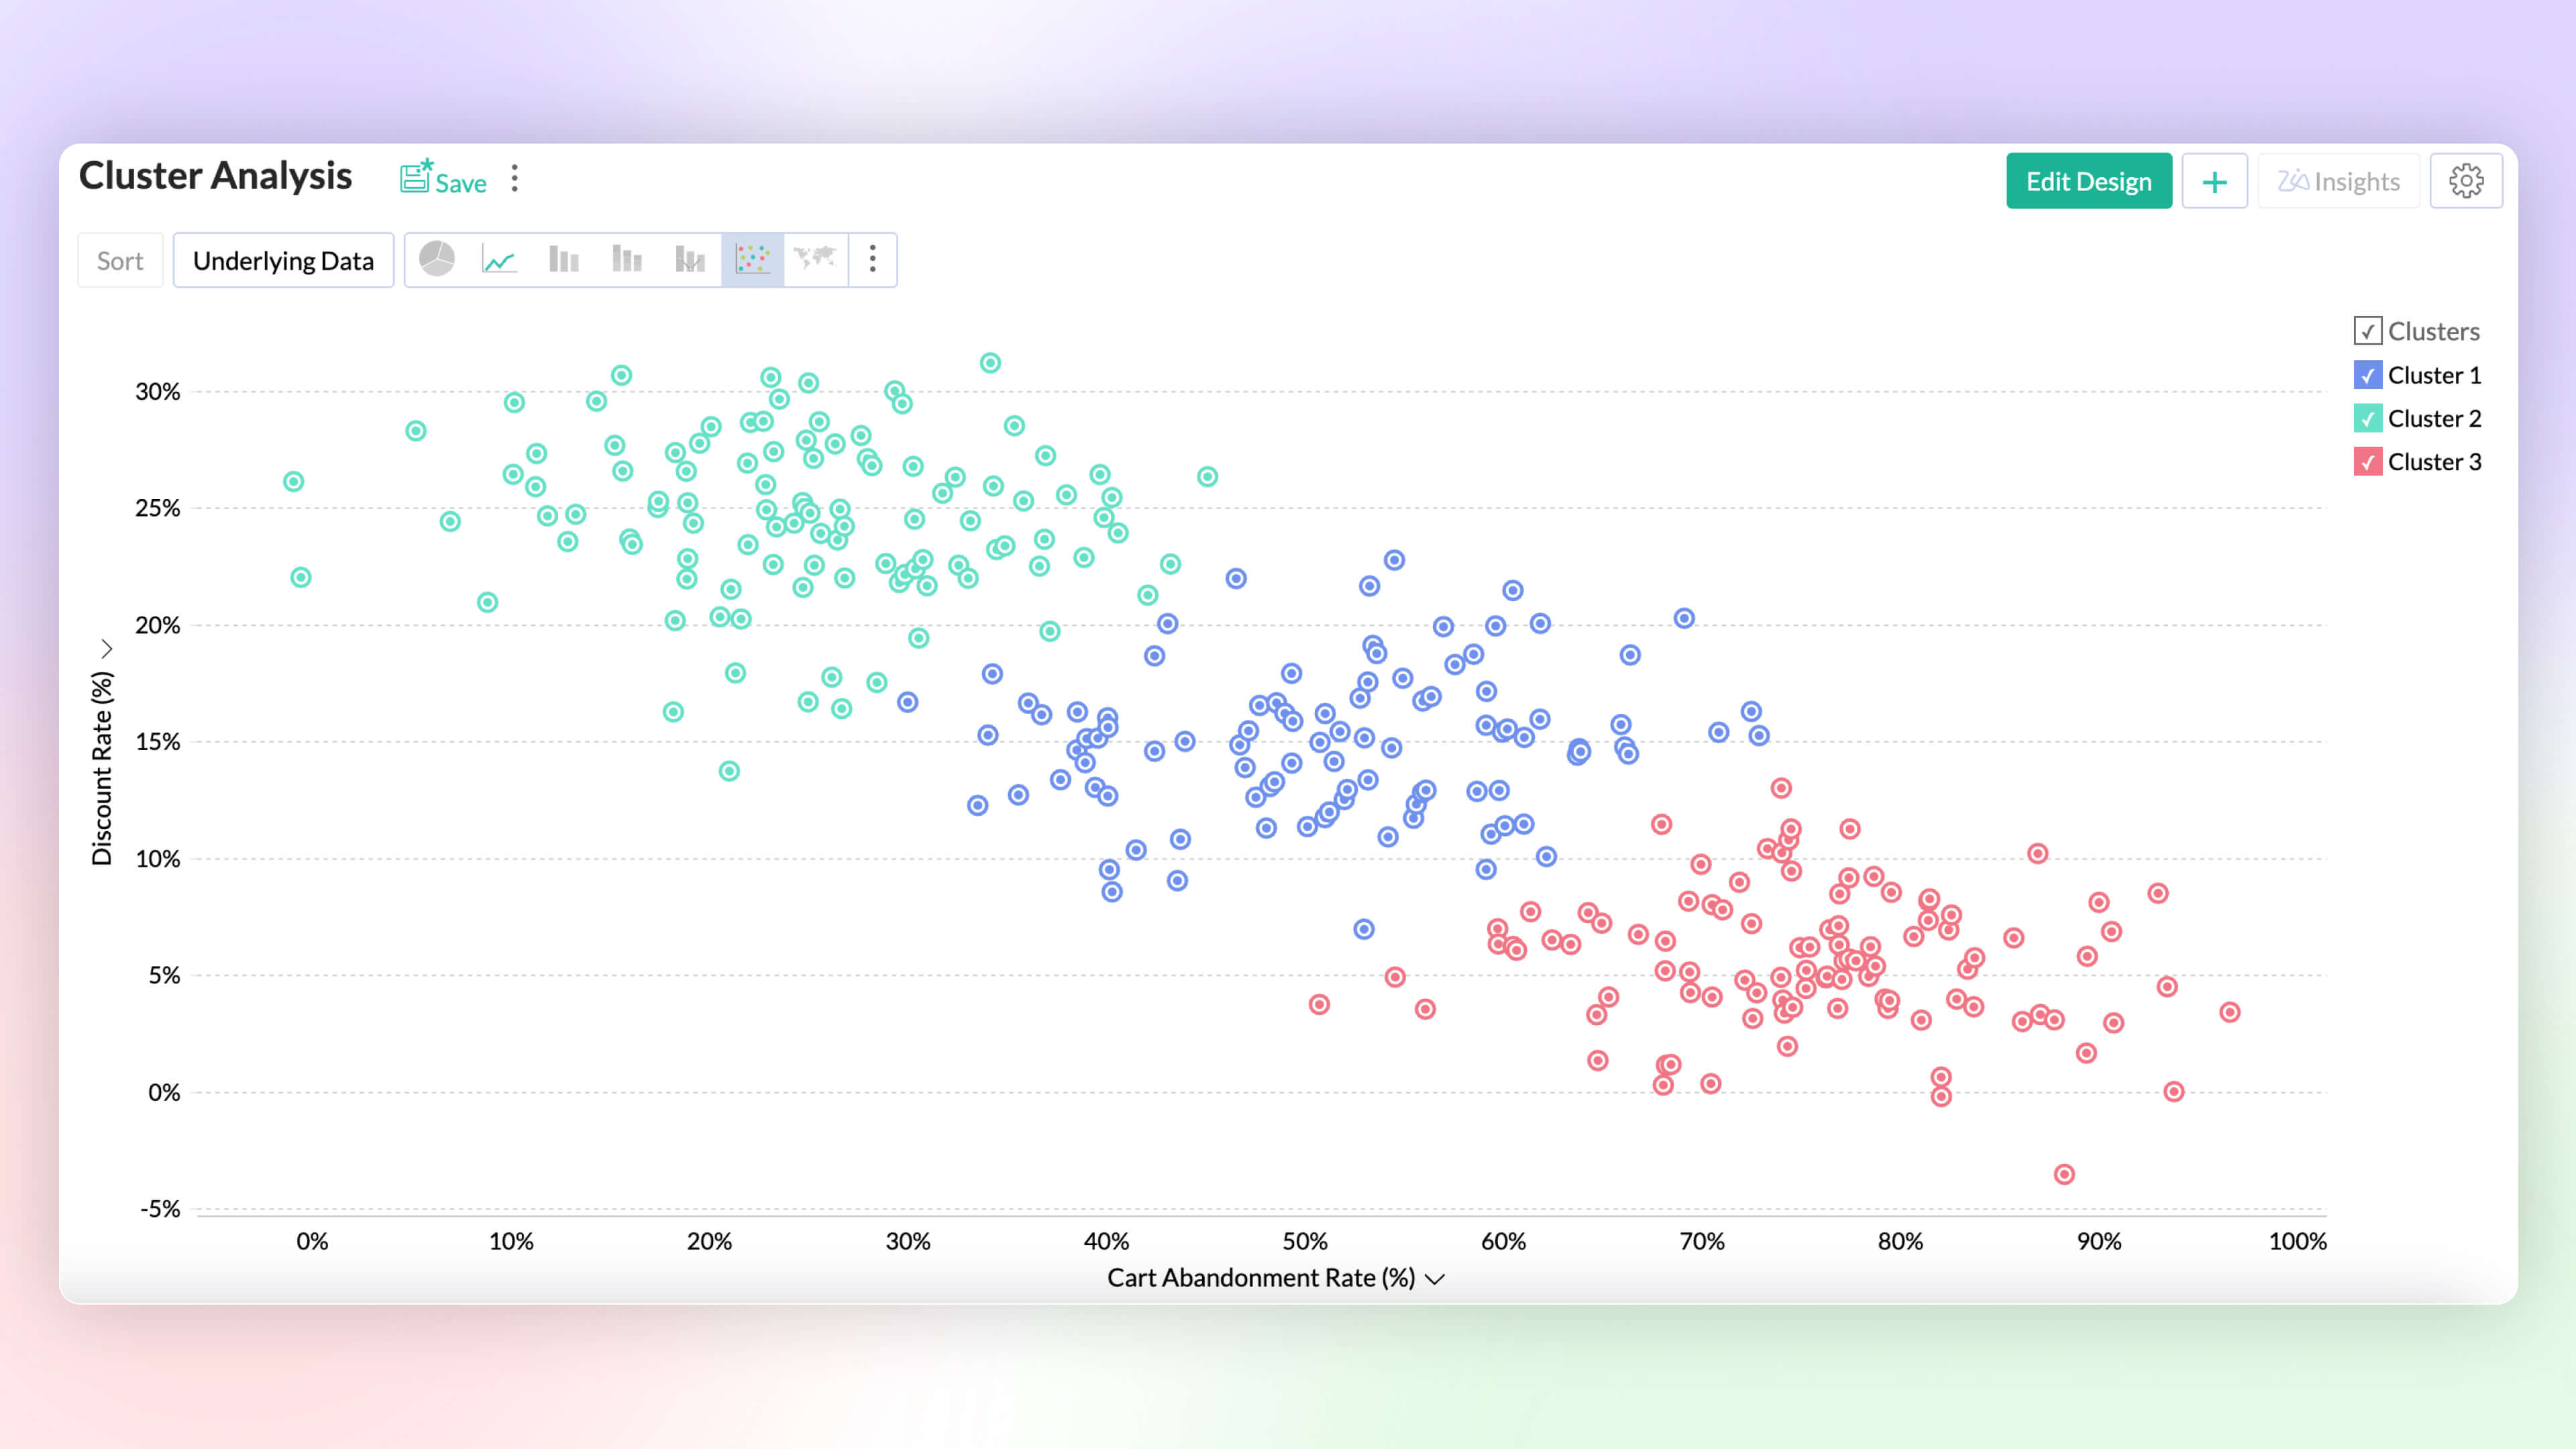
Cluster Analysis Premium Plan
Visualize data grouped as clusters using a variety of ML models (k-mean, k-mode, and k-prototype). Intuitively segment and analyze data groups, for common patterns and affinity.
Click here to learn more.
Data Science & Machine Learning Studio
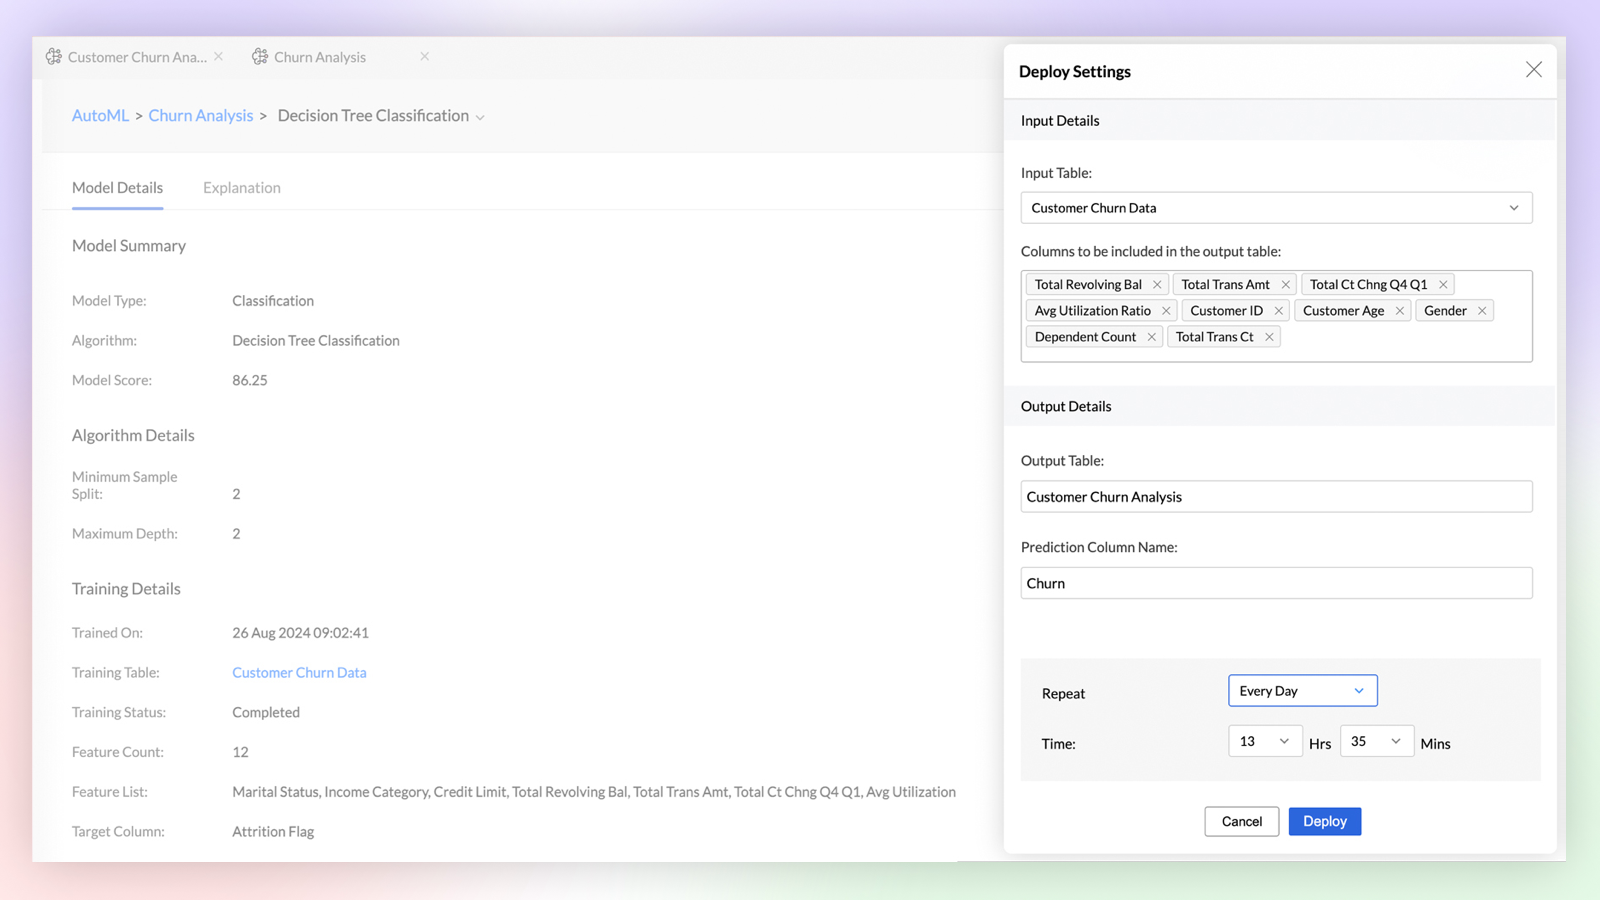
Auto ML Enterprise Plan
Build custom machine learning models with No-code assistant. Easily train, test, compare, deploy and manage models. Perform feature engineering, parameter tuning and model analysis as you build models.
Click here to learn more.
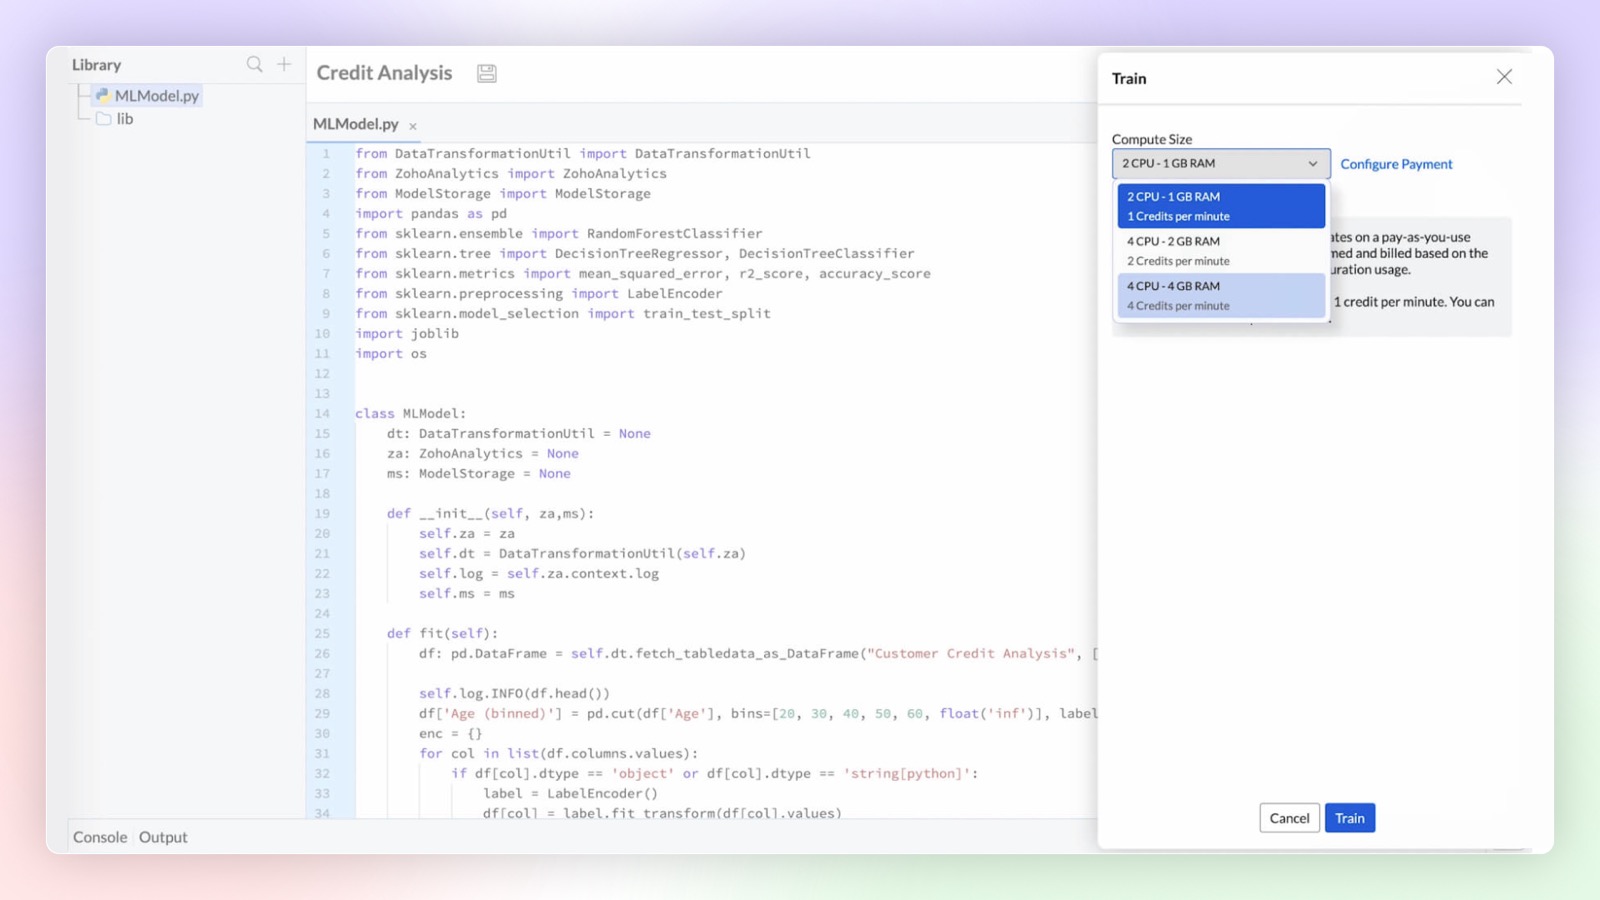
Code Studio Enterprise Plan
Develop custom models and data transformations using Python code studio. Build them from scratch or import them from other sources. Integrated Python development environment with Zia code suggester for accelerated development.
Click here to learn more.
Platform Extensibility
Linked Workspaces
Linked Workspaces in Zoho Analytics establishes a connection between two distinct workspaces, allowing them to push views from one workspace to another. In this connection, one acts as a primary workspace and the other acts as a child workspace. The views from a primary workspace can be effortlessly pushed to multiple child workspaces with a single click or set to synchronize periodically for automatic updates.
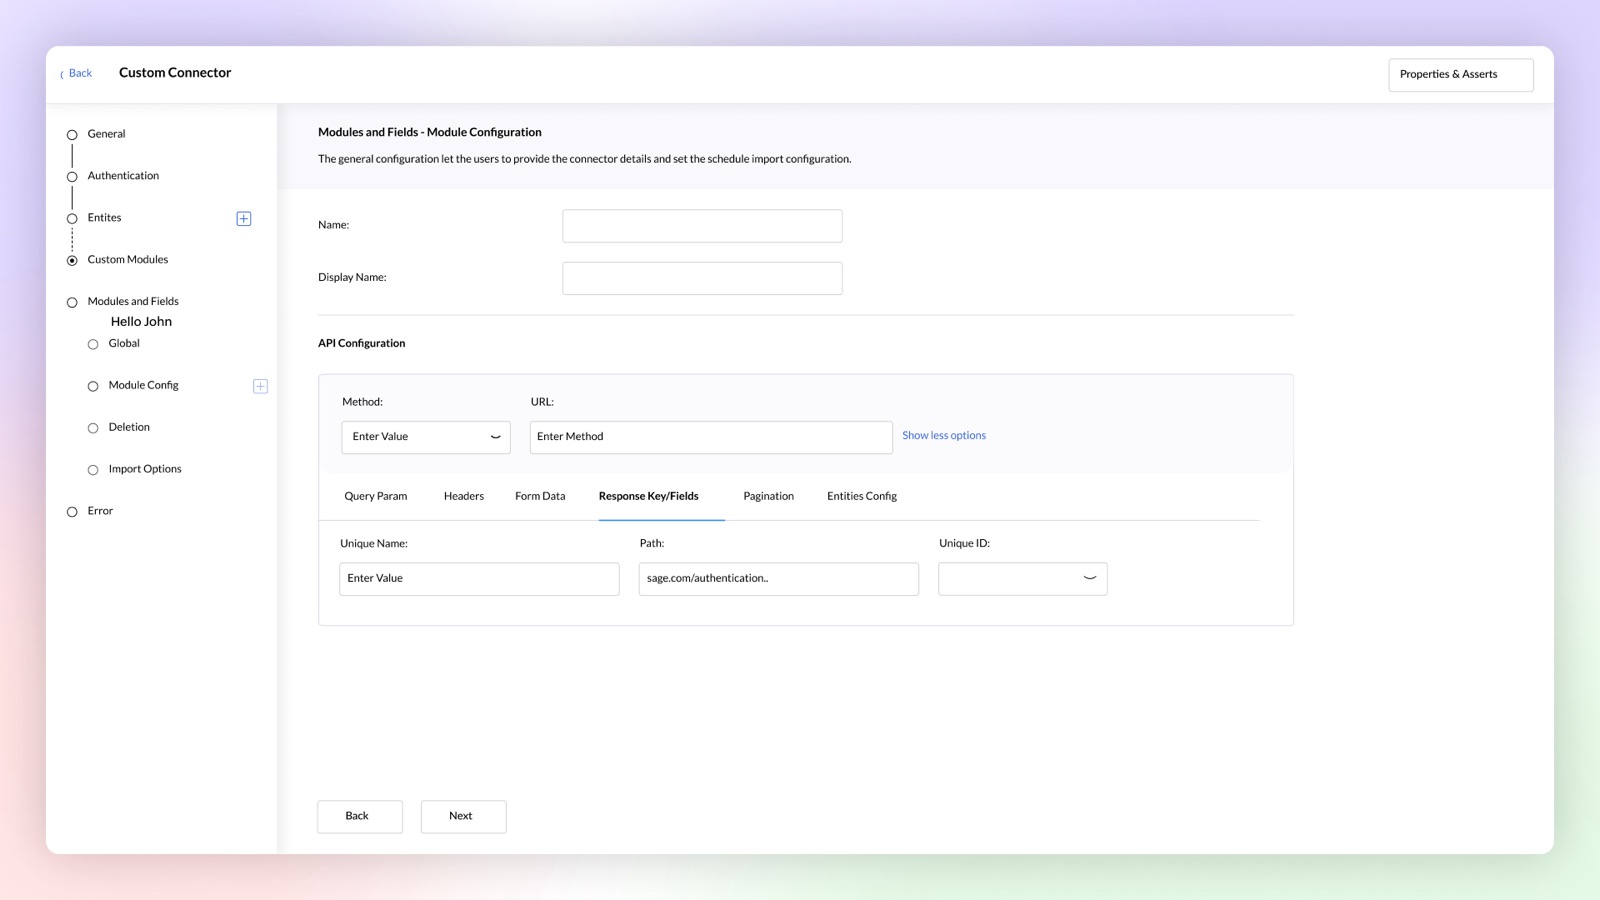
Custom Connector Premium Plan
Build your own data connector for any application using a no-code connector builder. Publish and sell your custom connectors on Zoho Marketplace, if required.
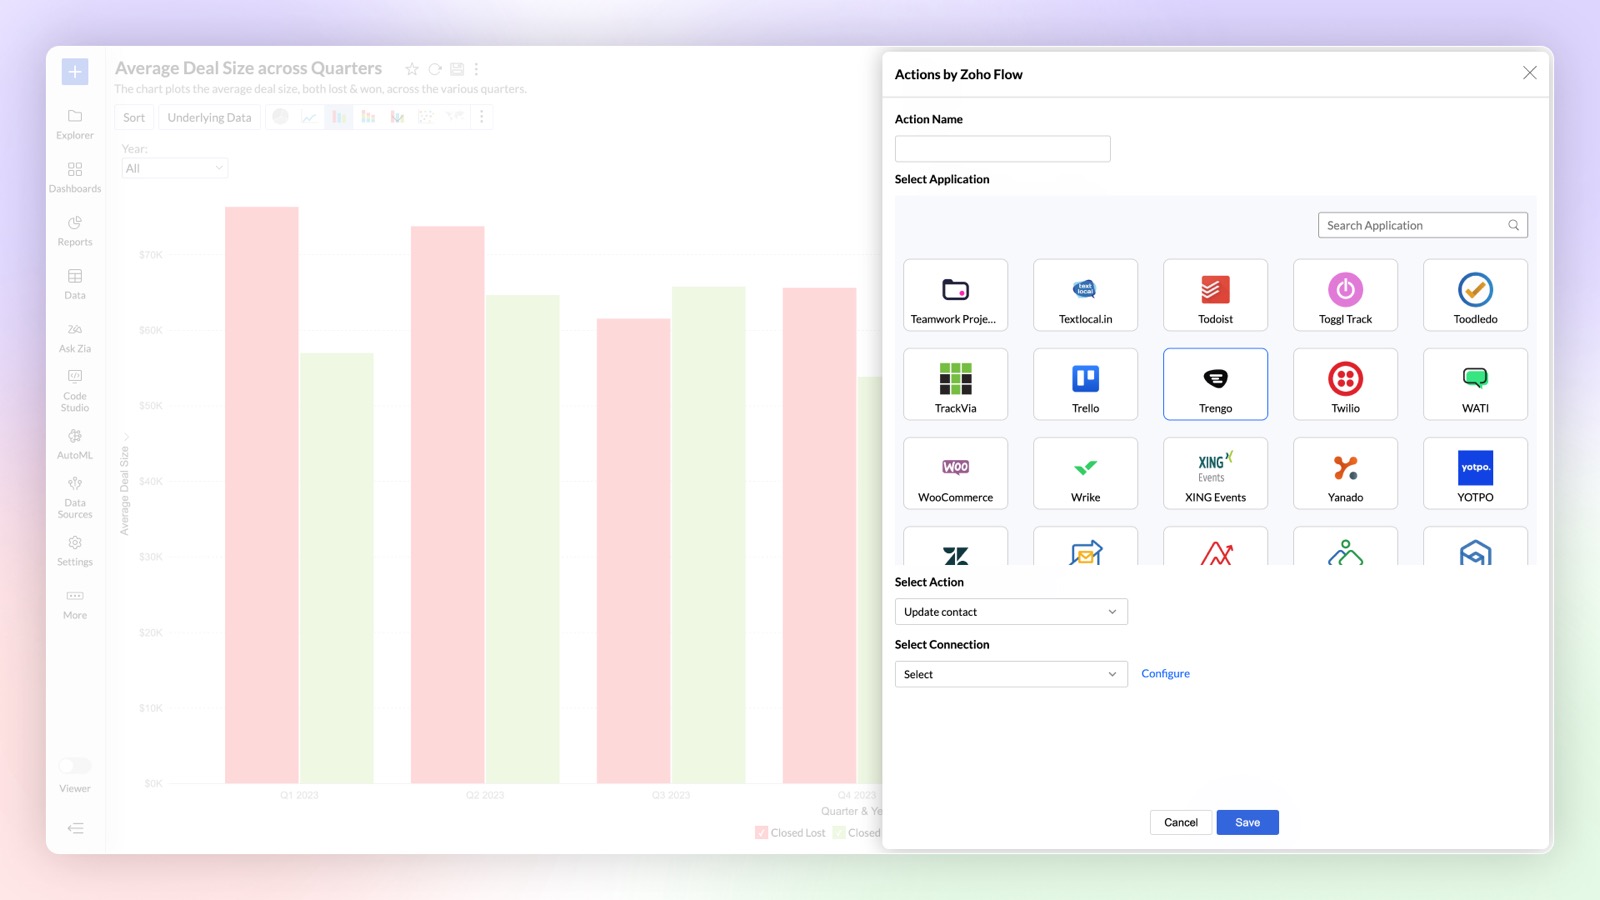
Zoho Flow in Alerts Premium Plan
You can now use Zoho Flow to perform actions in other applications whenever an alert is triggered in Zoho Analytics using Zoho Flow. For example, a ticket can be created in Zendesk based on the alert triggered in Zoho Analytics.
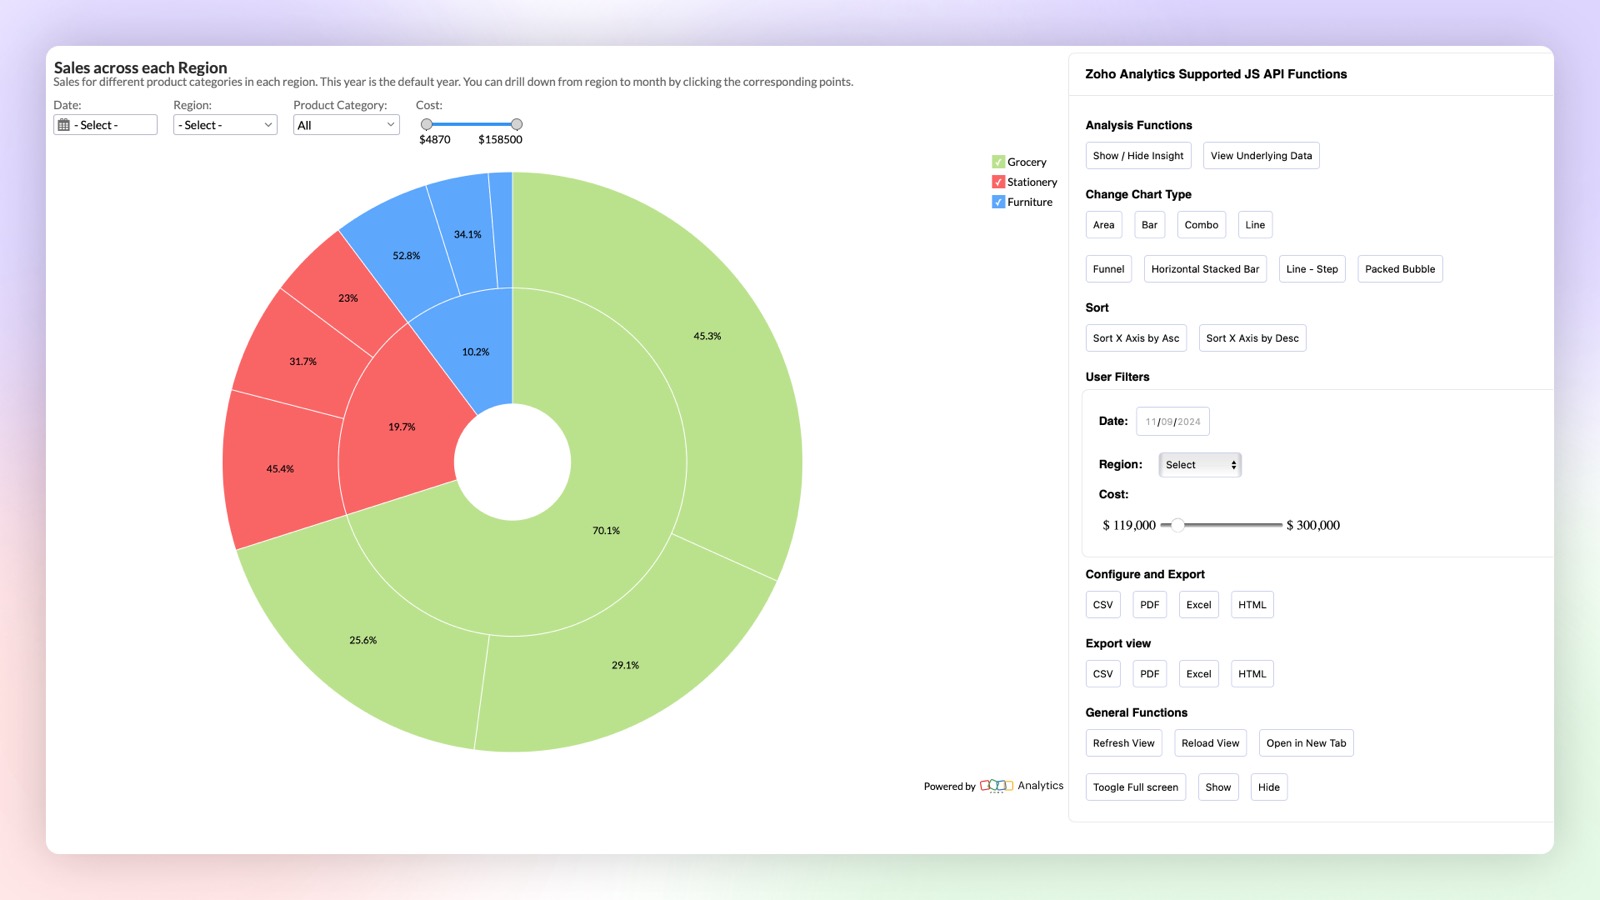
Client SDK
New Javascript based Client SDK to extend & customize the user experience of reports within embedded applications. You can control interactions like sort, export, user filters, change chart type and other actions with the JS API.
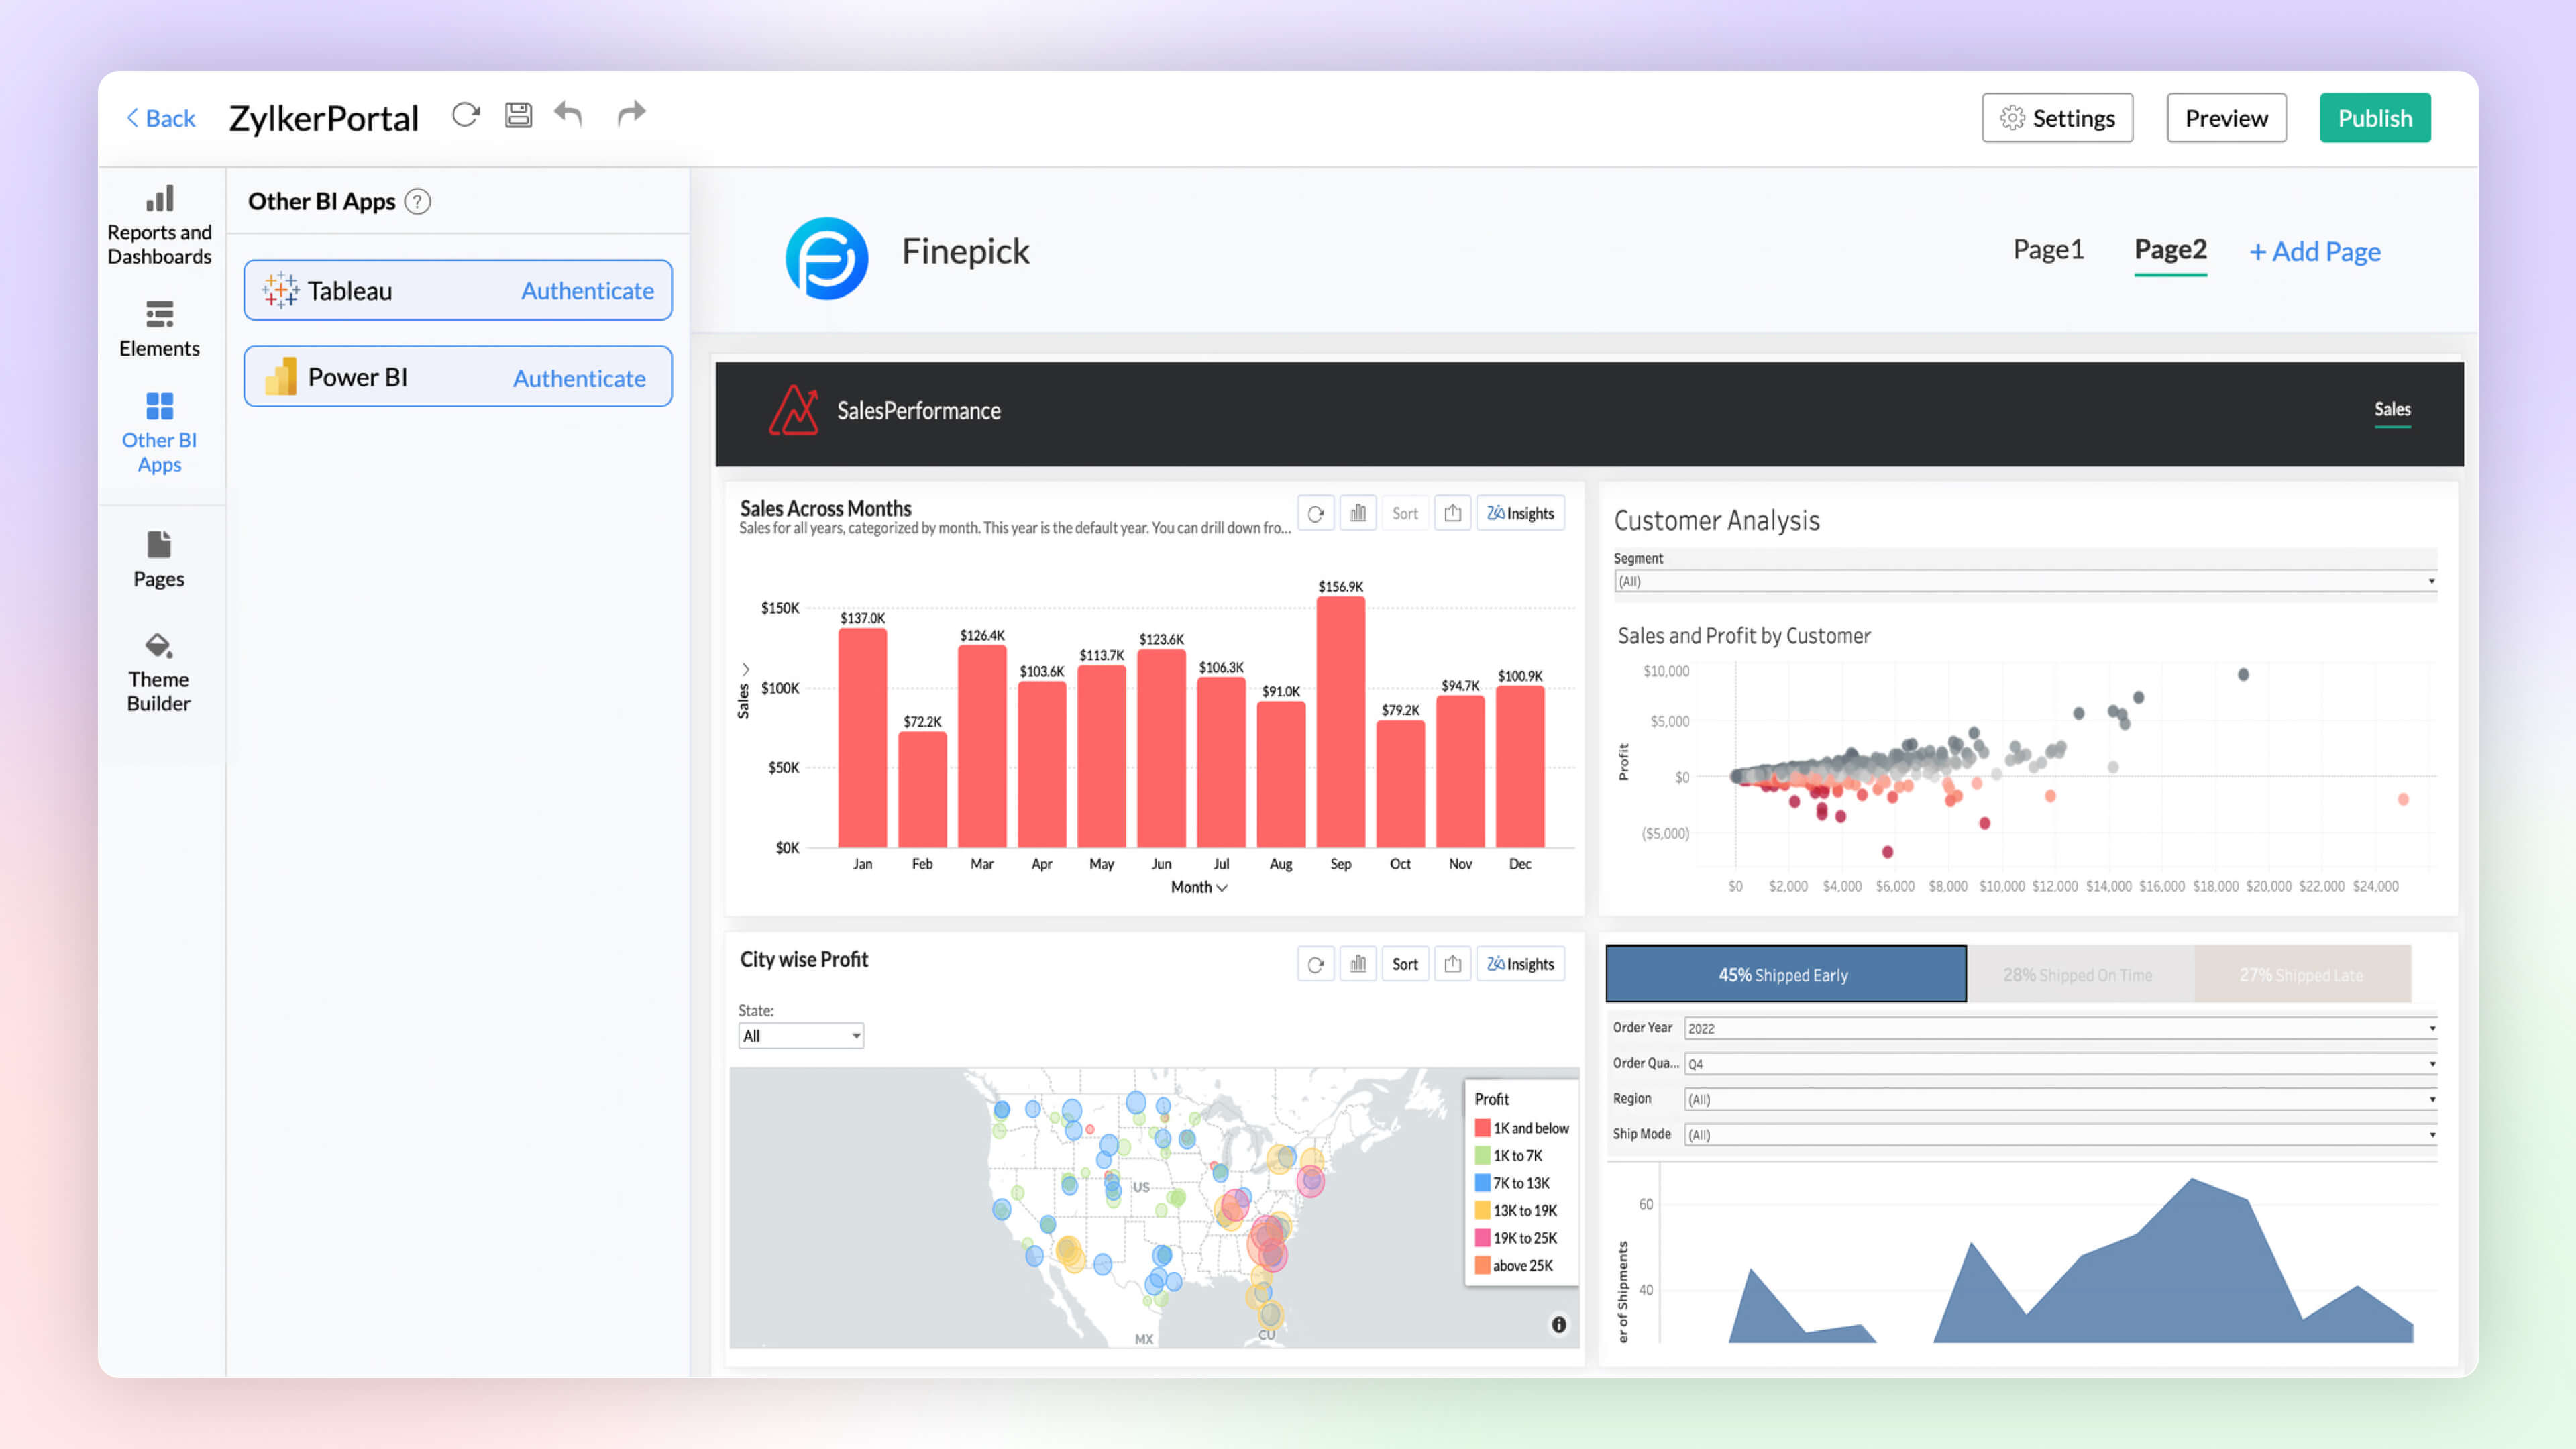
BI Fabric
Create unified BI portals by collating insights from other BI applications such as Tableau and Power BI along with Zoho Analytics. Setup fine-grained access control on the portal for secure access. Unified BI Fabric portal helps in easy access to insights from a centralized portal, breaking the boundaries across BI services.
Click here to learn more.
Security Enhancements
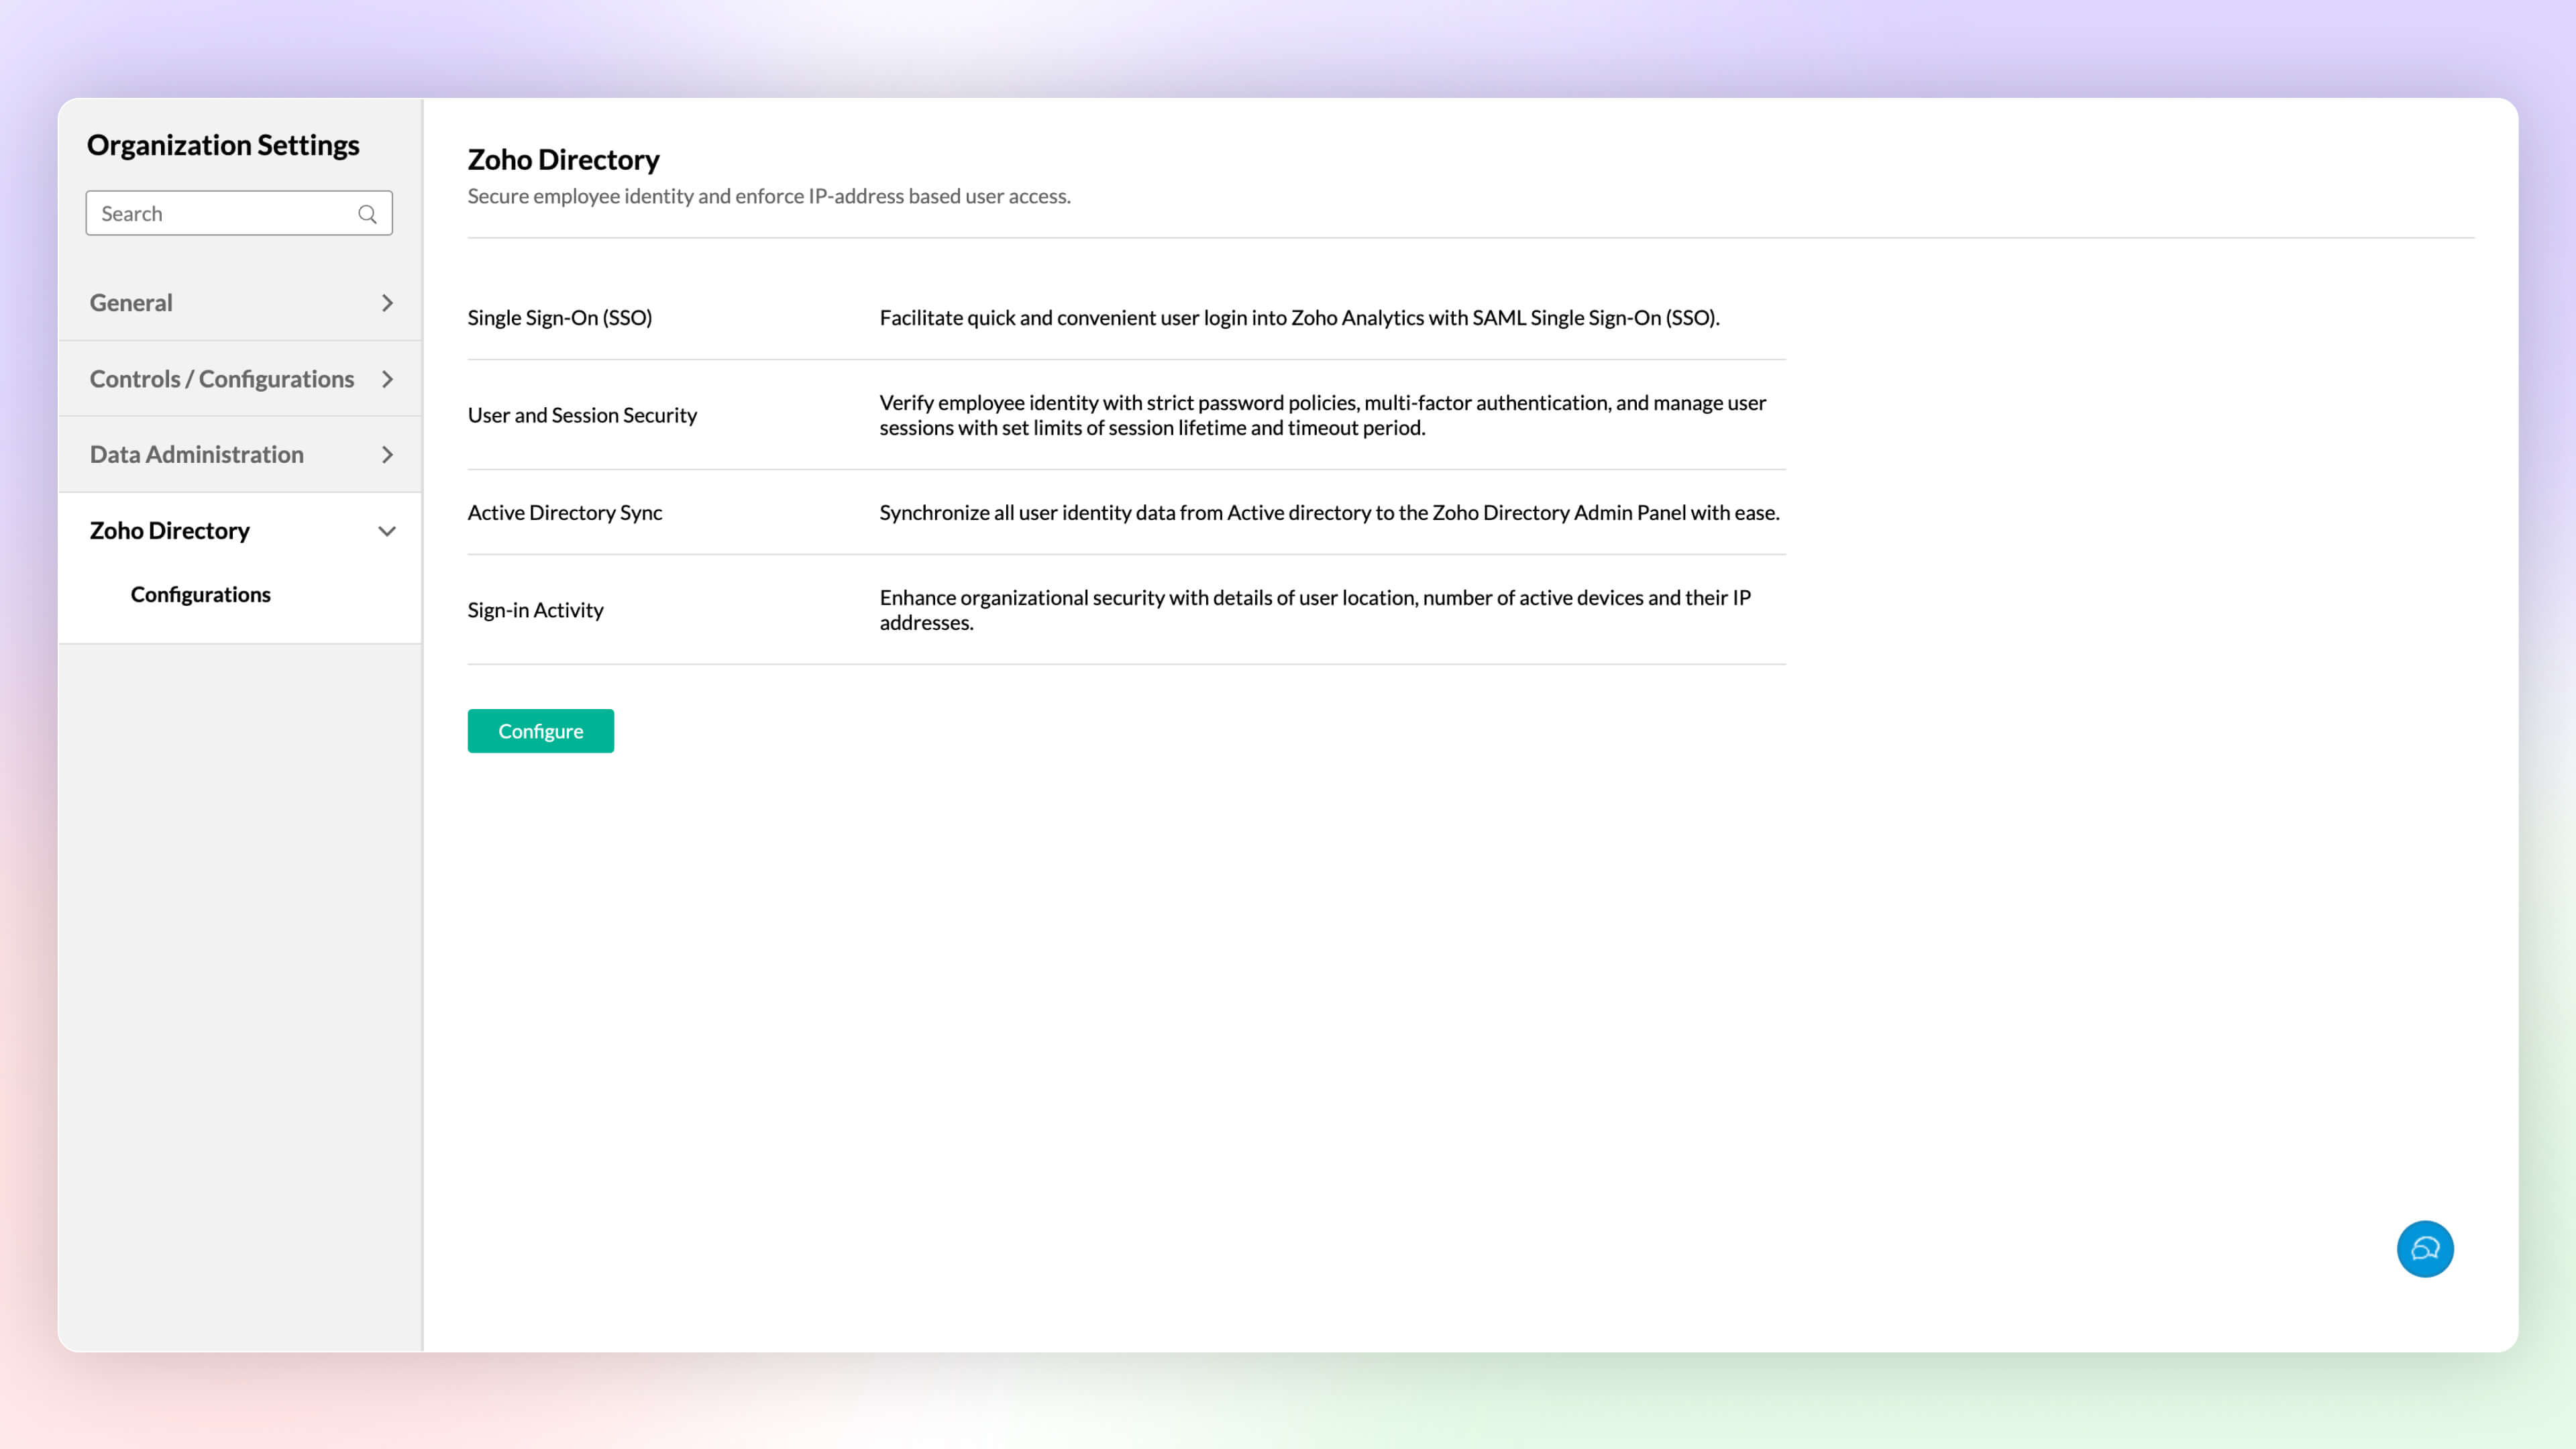
Zoho Directory
Zoho Analytics integration with Zoho Directory allows administrators to setup single sign-on, Active Directory sync, handle user access management and more.
Click here to learn more.
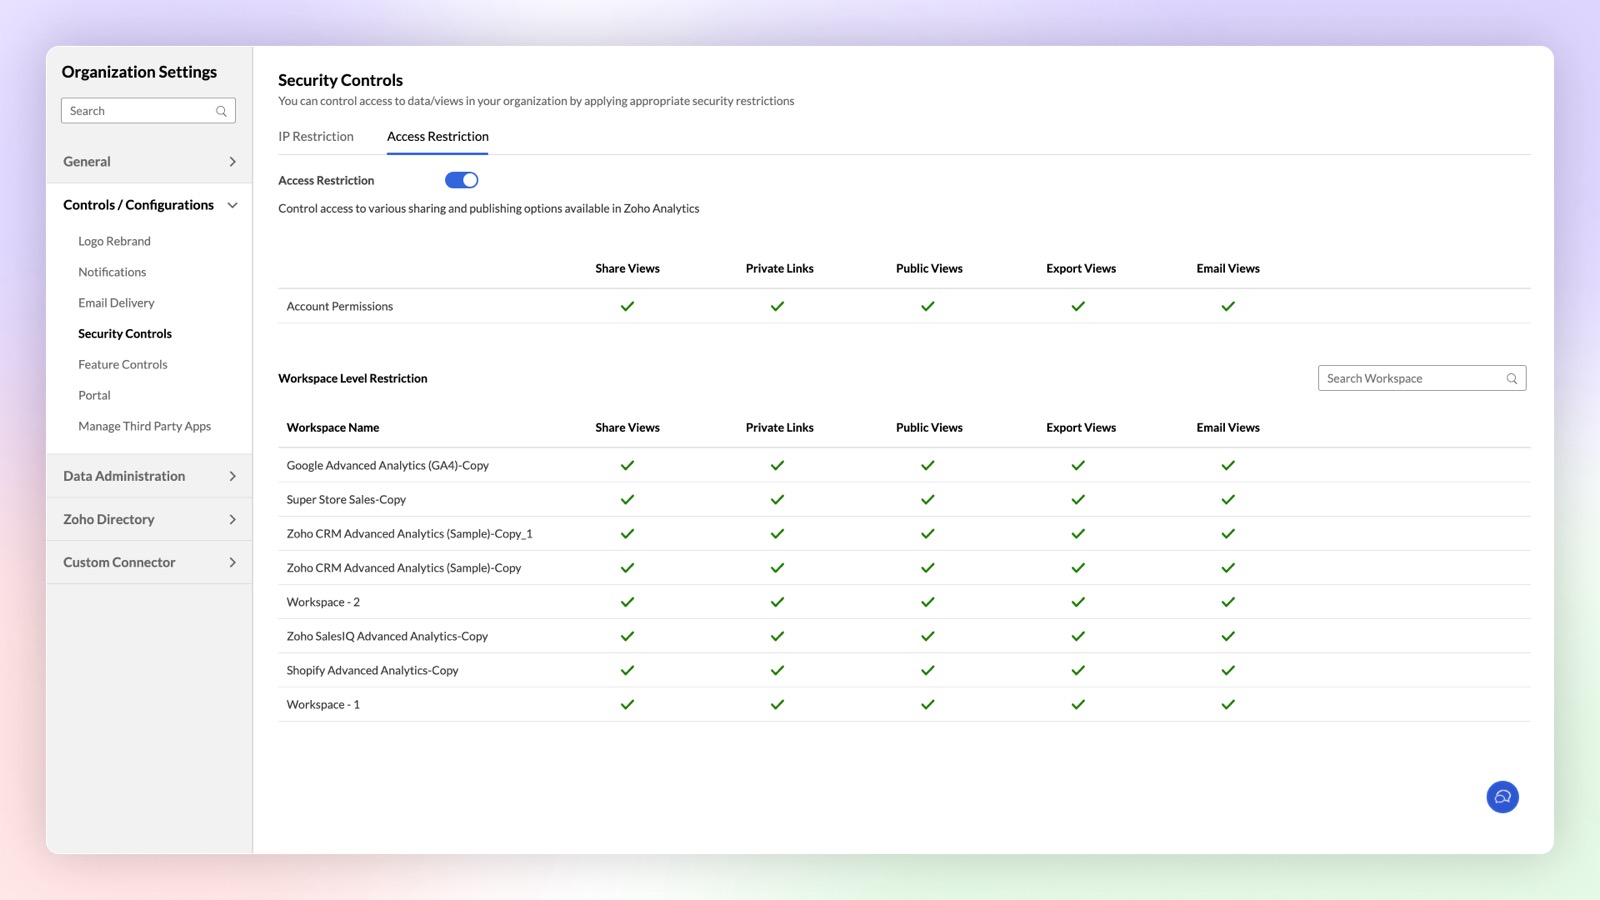
Access Restriction
Zoho Analytics now offers enhanced security controls to setup fine-grained access restrictions at the workspace level. Apart from the organization level access restriction controls, this new update allows you to setup different restrictions for different workspaces.
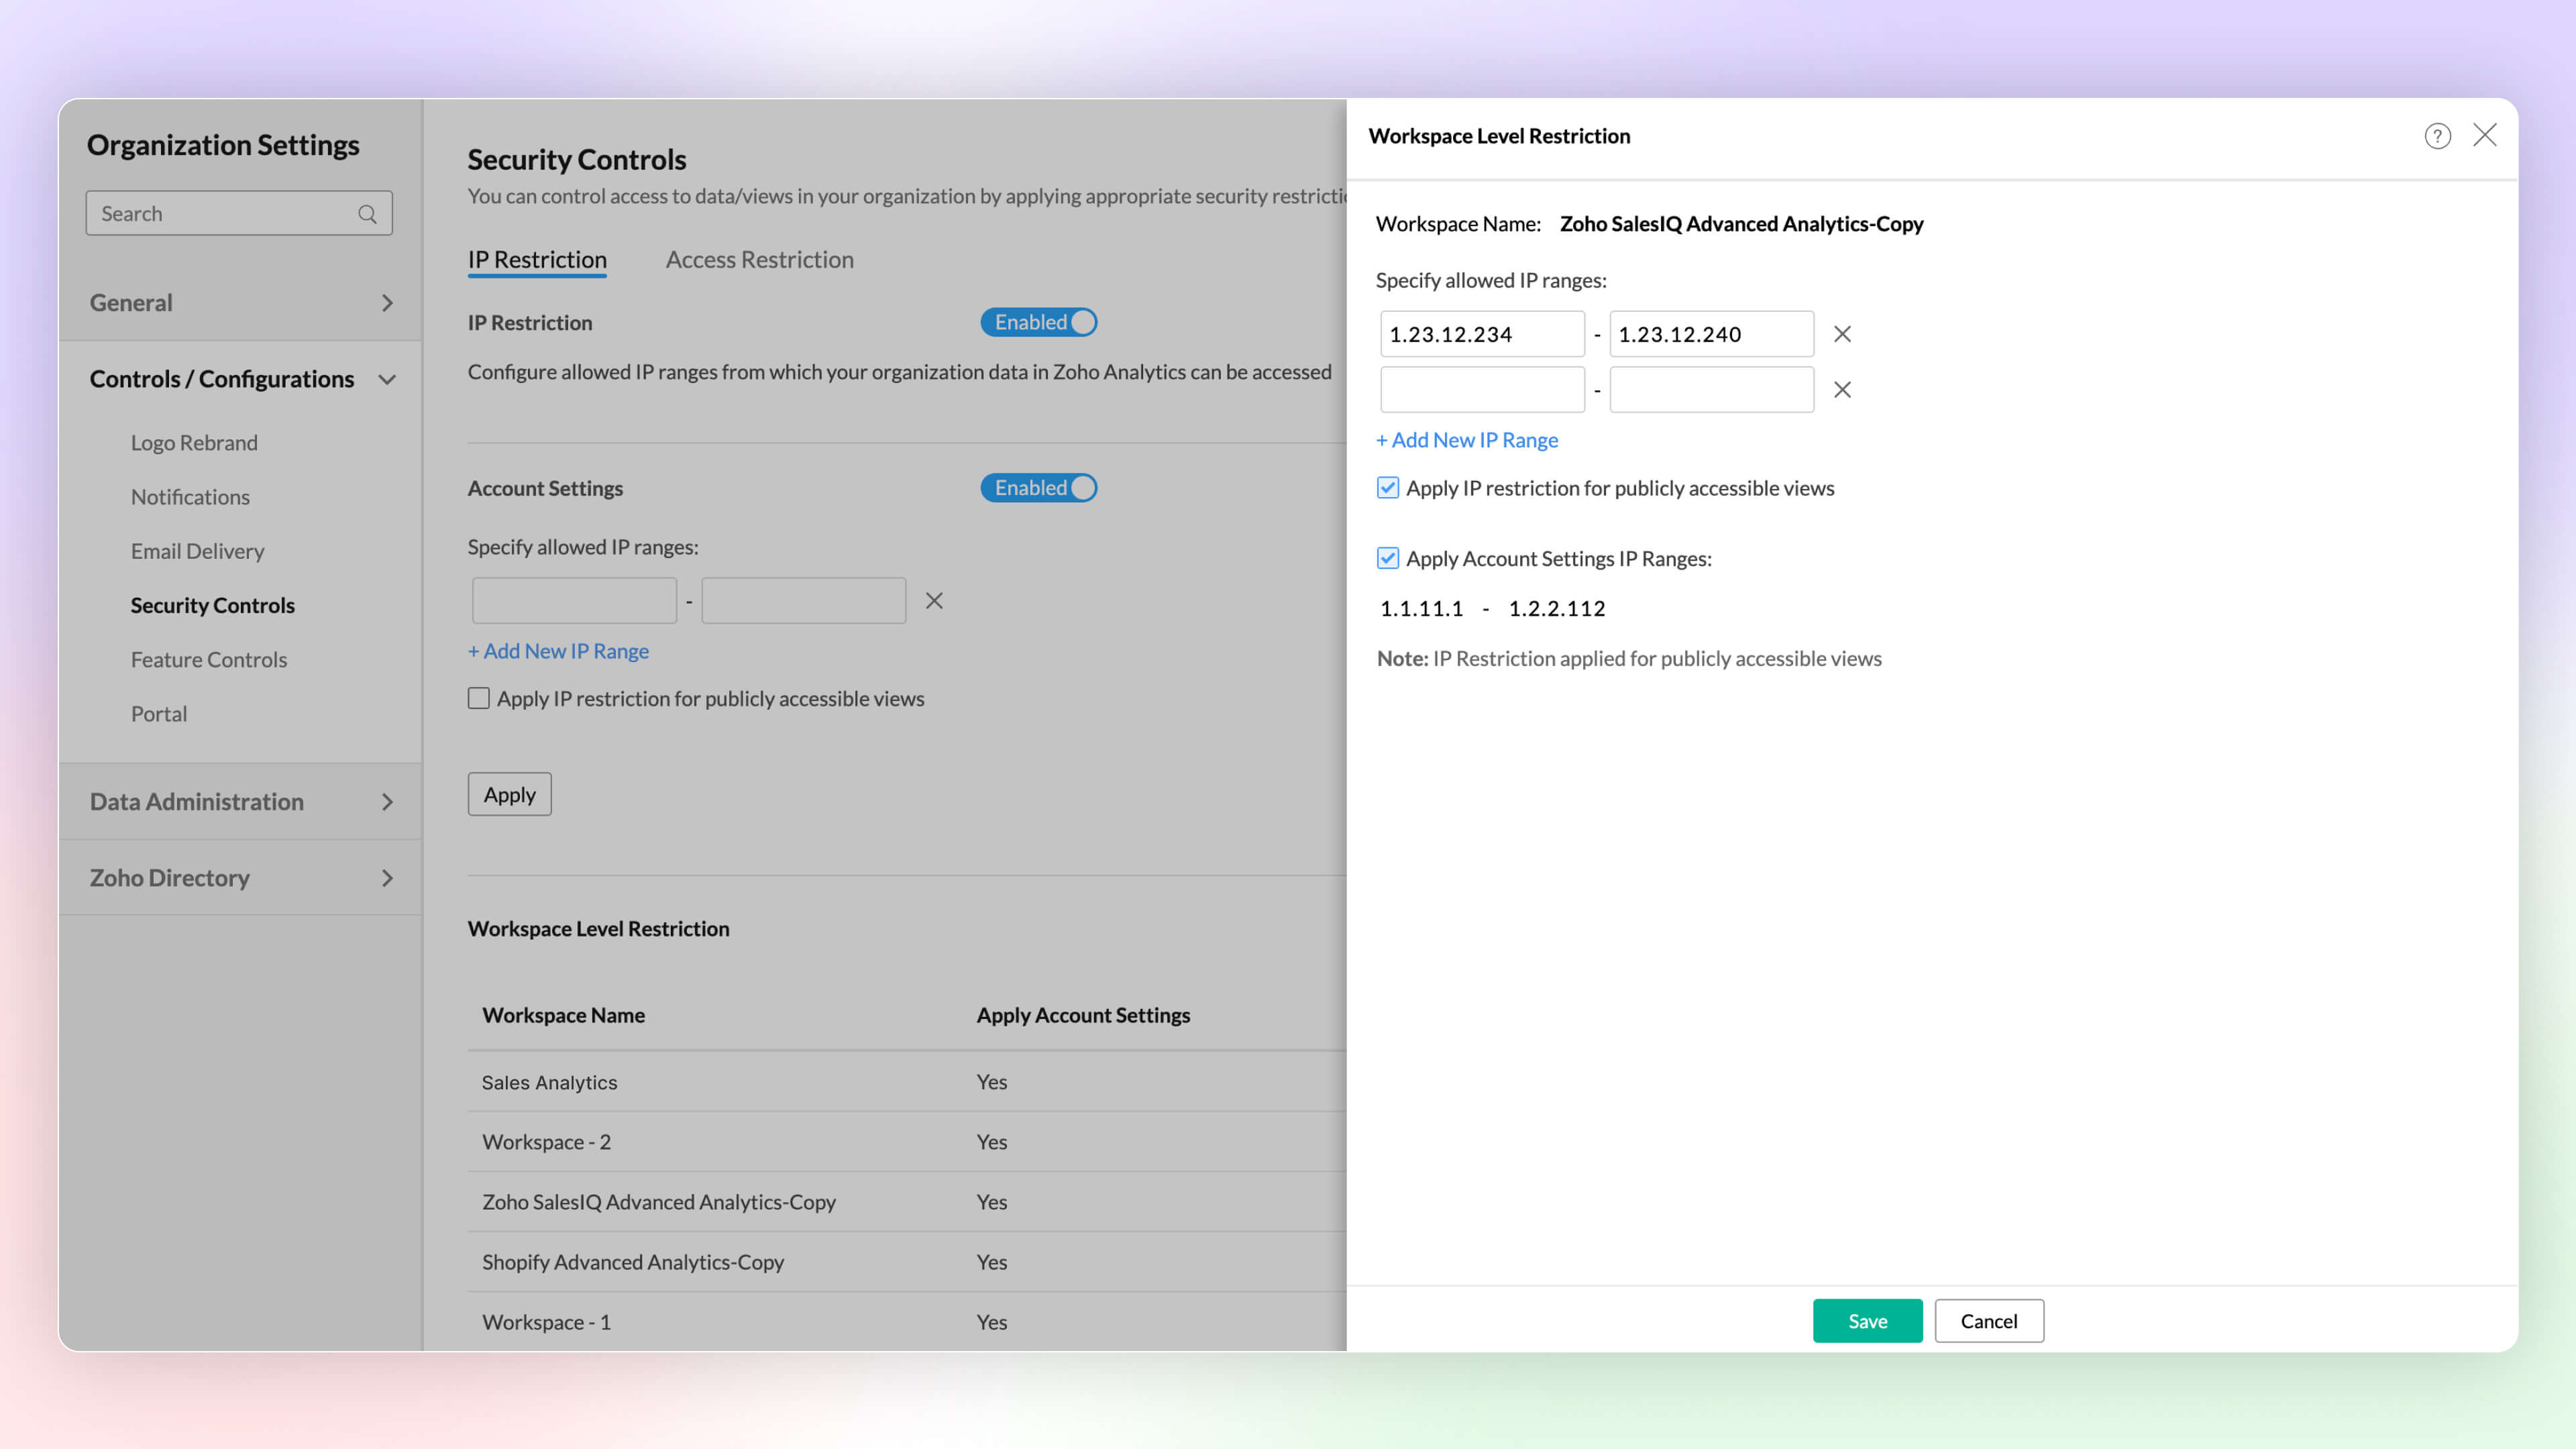
IP Restriction
Configure workspace-level IP restrictions for enhanced security and prevent unauthorized access. Previously, IP restrictions were available only at the account level.
Click here to learn more.
Other Updates
UI Enhancements
New Intuitive and User-friendly Interface
Zoho Analytics' new user experience features glass-morphism, offering a modern, translucent design that improves visual clarity. This sleek update makes data visualization more intuitive and user-friendly.
Right to Left User Interface
Zoho Analytics now supports a right to left user interface. This option is best suited for languages like Arabic and Hebrew that are read from right to left.
Puvi Font Support
Zoho Analytics now supports Zoho's own font, Puvi. You can try this new font from the Profile tab.
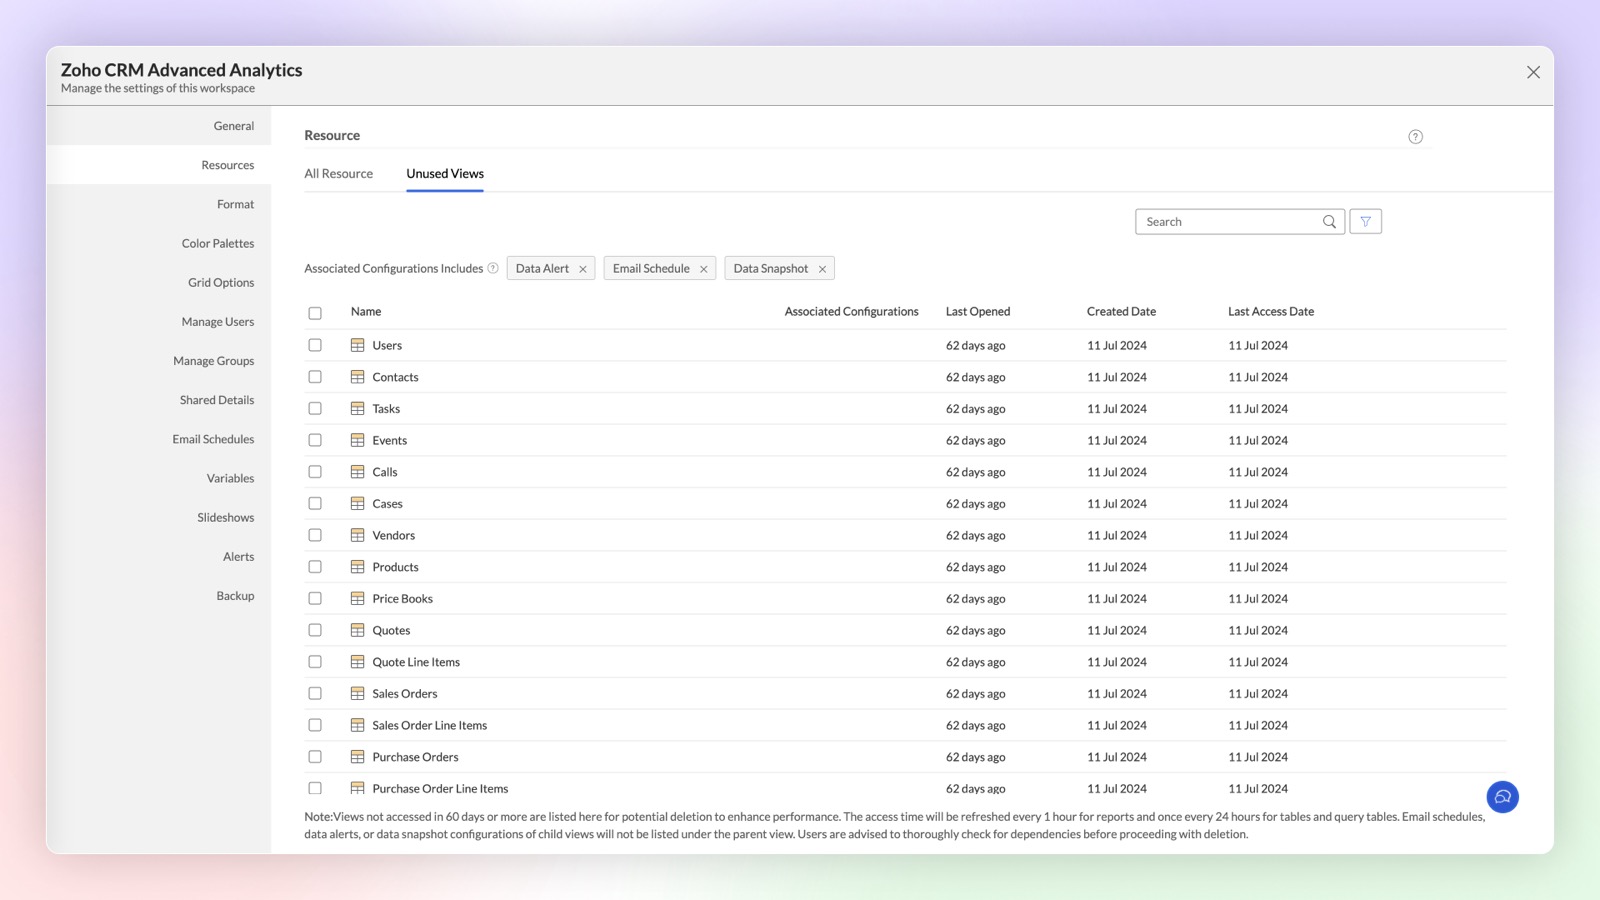
Unused Views in Workspace
Views and tables created in Zoho Analytics may sometimes go unused for extended periods due to reduced relevance. These inactive views and tables are now categorized under the "Unused Views" section at the workspace level, helping you decide whether to maintain or remove them.
Share to Slack
Improve collaboration and increase productivity by integrating Slack and Zoho Analytics.You can now easily share tables, reports, and dashboards to Slack users by this integration.
Click here to learn more.
Topic Participants
Rakesh Ramkumar B
Tejesh
Bhuvaneshwaran
HEINER MISAS PARRADO
Storytelling BeanCounter - www.storytellingbeancounter.com
Sticky Posts
What's New in Zoho Analytics - February 2026
Hello Users! We're back with another round of updates for Zoho Analytics. This month's release focuses on giving you greater flexibility in how you visualize, manage, and act on your data - with new features like custom visualizations, remote MCP server,What's New in Zoho Analytics - January 2026
Hello Users! We are starting the year with a strong lineup of updates, marking the beginning of many improvements planned to enhance your analytics experience. Explore the latest improvements built to boost performance, simplify analysis, and help youWhat's New in Zoho Analytics - November 2025
We're thrilled to announce a significant update focused on expanding your data connectivity, enhancing visualization capabilities, and delivering a more powerful, intuitive, and performant analytics experience. Here’s a look at what’s new. Explore What'sWhat's New in Zoho Analytics - October 2025
Hello Users! We're are back with a fresh set of updates and enhancements to make data analysis faster and more insightful. Take a quick look at what’s new and see how these updates can power up your reports and dashboards. Explore What's New! ExtremeWhat’s New in Zoho Analytics – September 2025
Hello Users!! In this month’s update, we’re raising the bar across multiple touchpoints, from how you bring in data, plan and track projects to how you design and brand your dashboards. We’ve added the all-new Gantt chart for project visualization, expanded
Recent Topics
Issue with attaching files to a task through the API
Hello! I've implemented a function that creates a task for every new bill that is created but I haven't been able to attach to the task the files which are attached to the bill. I have encountered multiple errors but the most common one is error 33003:Create your own Zoho CRM homepage using Canvas - Home View!
Hello everyone We are excited to share a new enhancement to Canvas in Zoho CRM that gives users more control over how their homepage looks and works. Introducing Canvas Home View! What is Canvas Home View? You can now create and design a custom homepageHow to make separate ledgers for GST (different types). Based in India
Hello Everyone, I am trying to configure GST for a small business and I am not able to create separate ledgers for the different types of GST. In the reports all of it is mentioned under one heading which is not allowed. How do I make sure that the differentZoho mail admin panel not opening
Setting default From address when replying to request
At the moment, if I want to reply to a request, the From field has three options, company@zohosupport.com, support@company.zohosupport.com, and support@company.com. The first two are really internal address that should never be seen by the customer andIntroducing SlyteUI : From Idea to a Working Interface in Minutes
Hello everyone! Are you spending hours building basic UIs? Does even the smallest customization feel like a major task? CRM customization should feel intuitive and straightforward, not time consuming or exhausting. SlyteUI makes this possible by simplifyingZia Agents in Zoho CRM: a better way to set up digital employees
Hello everyone, If you've been using Zia Agents in Zoho CRM, so far using Connections was the only deployment method you're familiar with. You create an agent in Zia Agents (define its objective, write instructions, use tools, add knowledge base) andCanadian Banks ?
Can you advise which Canadian Banks can be used to fully sync credit cards and bank accounts? ThanksMass email from Report output
Hi, I'd like to send a mass email based on a report output. The report is pulling multiple information from linked modules. Each line of the report ends up with a contact name, email and multiple field values pulled from the linked modules (some are customCombined Tasks and Issues View (Jira-Style Unified Workload)
Hello Zoho Projects Team, We hope you are doing well. We would like to submit a feature request regarding task and issue visibility in Zoho Projects. Current Behavior: At the moment, Zoho Projects separates Tasks and Issues into different modules, eachScale up your support with Zia actions
Hi there, Have you explored how Zia can help automate repetitive tasks? In customer support, every detail matters when delivering the right solutions to customers, and Zia is here to support you. This edition highlights how Zia can simplify and streamlineDisable Zoho Contacts
We don't want to use this app... How can we disable it?Zoho CRM with Built-In MCP Support
Zoho CRM now provides built-in support for Model Context Protocol (MCP), enabling AI tools to connect and perform CRM actions using natural language. Zoho CRM MCP servers act as a bridge between AI agents and Zoho CRM, exposing CRM capabilities as callableAllow Zia Agents using Zoho One Account
When I went to try Zia Agents, it forced the creation of a new, separate account. This seems counter-intuitive to me. I don't want to manage a separate account. Plus, aren't Zoho One users the ones most likely to adopt Zia Agents most quickly? It seemsMy Zoho mail stopped receiving or sending emails about 3 hours ago
Its a pop 3 account. The emails get into the actual mailbox on the server and I can send emails directly from the server, but they are no longer in Zoho, in neither of my Zoho accounts. All green ticks under Mail Accounts under SettingsPOP mailbox limits
If I am accessing a remote POP mail server using Zoho Mail is there a mailbox quota for the account or is it all related to my mail account storage limits?SPF: HELO does not publish an SPF Record
I am using Zoho mail. Completed all of the required prerequisites from the dashboard to avoid any issues with mail delivery. But when checking on mail-tester.com getting the following error. Can anyone help me solve this?Check out in Meetings
Why there is no check out in Meetings of Zoho CRM, very difficult to trackAbility to Attach Images When Reporting Issues to Zoho Projects from Zoho Desk
Hi Zoho Desk Team, Hope you’re doing well. We’re using the Zoho Desk–Zoho Projects integration to report bugs directly from support tickets into the Zoho Projects issue tracker. This integration is extremely useful and helps us maintain smooth coordinationZoho Show Keeps Crashing and Goes Down with the Data
Today, I am experiencing something unusual: Zoho Show keeps crashing and goes down with the data. When you try to reopen the same deck, you get that lovely "Presentation not found" error. This has happened today rather frequently with multiple decks.Outgoing Mail Blocked – Suspicious Login Activity (Need Clarification and Solution)
Hello, I’m currently facing an issue where my Zoho Mail account has been blocked due to “suspicious login activity,” and outgoing emails are restricted. Here are the details shown: Block type: Outgoing mail blocked Reason: Suspicious login activity AEscalate the tickets to the escalation team through email
Hi Zoho Team, I would like to ask if it is possible to escalate the tickets when the status changed to "Escalated" by sending an email to them. I have attached the snapshot from my Zoho desk where I want it to email to a certain group(escalation team).Mailbox storage showing incorrect usage
My mailbox shows 4.99 GB used out of 5 GB. However, actual mailbox usage is only around 394 MB. Trash and Spam are already empty. IMAP/POP is not enabled. WorkDrive is not in use. This appears to be a storage calculation issue. Please help to recalculateGoogle Fonts Integration in Pagesense Popup Editor
Hello Zoho Pagesense Team, We hope you're doing well. We’d like to submit a feature request to enhance Zoho Pagesense’s popup editor with Google Fonts support. Current Limitation: Currently, Pagesense offers a limited set of default fonts. Google FontsHave to ask: WHY is Zoho Purposefully blocking Apple Reminders?
I just have to ask: Why is zoho purposefully blocking Apple reminders (CalDav). This is just strange... I just can't see a reason why this is done both within the Zoho calendar and mail calendar? These are both paid services. Why? This little simple feature is forcing me to leave Zoho. Our workflow depends on Reminders and after talking with an Apple engineer, they noticed theat Zoho is purposefully blocking this caldav port call. I just don't understand why. Thanks!I am not able to check in and checkout in zoho people even location access allowed
This issue i am facing in mackbook air m1, I allowed location in chrome browser and i also tried in safari but getting similar issue. Please have a look ASAP.Printing receipts with 80mm thermal printer and Zoho Creator
I have a sales form in my Zoho Creator app and I would like to print receipts for customers. Question 1: From what I've read on this forum there's no way to submit and have the receipt print automatically, you'd have to go through the printer dialog,Integrate with WooCommerce using Wordpress Plugin
We’re thrilled to announce a powerful update to the Zoho Marketing Automation WordPress plugin with WooCommerce integration! This enhancement enables new possibilities for businesses running online stores using WooCommerce, empowering them to merge seamlessRemoving To or CC Addresses from Desk Ticket
I was hoping i could find a way to remove unnecessary email addresses from tickets submitted via email. For example, a customer may email the support address AND others who are in the helpdesk notification group, in either the TO or CC address. This resultsWhen I schedule calendar appointments in zoho and invite external emails, they do not receive invites
Hello, We have recently transitioned to zoho and are having a problem with the calendar feature. When we schedule new calendar appointments in zoho the invite emails aren't being sent to the external users that we list in participants. However, this worksSync desktop folders instantly with WorkDrive TrueSync (Beta)
Keeping your important files backed up and accessible has never been easier! With WorkDrive desktop app (TrueSync), you can now automatically sync specific desktop folders to WorkDrive Web, ensuring seamless, real-time updates across devices. Important:Unable to send
Hello, I am unble to send any single email during the whole time due to the Zoho IP 136.143.188.16 being bloked by SpamCop.net Please help can somebody help me?Errorcode 554
Hello, I am unble to send any single email during the whole time due to the Zoho IP 136.143.188.16 being blocked by SpamCop. Please can somebody help me?Spamcop
Have been trying to email several of our clients and many of our emails keep getting bounced back with an error that states: ERROR CODE :550 - "JunkMail rejected - sender4-op-o16.zoho.com [136.143.188.16]:17694 is in an RBL: Blocked - see spamcop.net/bl.shtml?136.143.188.16"Emails being blocked / spamcop
Hello, I am unablr to send any single email during the whole time due to the Zoho IP 136.143.188.16 being blocked by SpamCop.net Please help on this.Zoho IP blocked by SpamCop 136.143.188.16
Hello, I am unble to send any single email during the whole time due to the Zoho IP 136.143.188.16 being blocjed by SpamCop.net Please help on this.This domain is not allowed to add in Zoho. Please contact support-as@zohocorp.com for further details
After not using the domain rcclima.org.pe for some time, I'm trying to set up the free version of Zoho Mail. When I tried to validate my domain, rcclima.org.pe, I received the error message discussed in this thread: "This domain is not allowed to be added554 5.1.1 – Mail sending blocked for the domain(s): [gmail.com]
Here's your corrected text: Hello, I hope you are doing well. I was unable to send a message and received the following error: "554 5.1.1 – Mail sending blocked for the domain(s): [gmail.com]" I tried to send and deliver an email but got this error. ICan I hide empty Contact fields from view?
Some contacts have a lot of empty fields, others are mostly filled. Is there a way I can hide/show empty fields without changing the actual Layout? I would like to de-clutter my view, and also be able to add information later as I am able. I would beReplying from same domain as a catch-all?
I have 2 domains setup on Zoho, both with associated email addresses. They look something like this: john@example.com (primary address) john@test.com (this domain also has a catch-all setup) I use the catch-all for test.com as a public-facing email addressNext Page