Visualize your data with a new set of charts: Treemap, Butterfly, Sankey, and Cluster charts in Zoho CRM
Dear customers,
When it comes to analytics, it's not just about the numbers; it's about understanding the story behind them.
With that philosophy in mind, we’re excited to introduce a line of representations to the existing array of chart types in Zoho CRM: Treemap, butterfly, sankey and cluster charts. Let's go!
Treemaps
Treemap charts are used to visually represent hierarchical datasets in a rectangular layout. It aligns its parent categories as larger tiles with their sub-categories nested within them. The size of each tile is proportional to its corresponding value, making it easy to compare different segments within the hierarchy.
This is how a treemap chart looks:

These structured data representations help you understand overall performance and contributions, as well as compare participating entities at a glance.
Unlike traditional bar charts or pie charts, treemaps can be used if your datasets are large and exhibit parent-child relationships.
Here are some examples to better understand their usage:
Comparing revenue distribution between functions
A company's revenue is distributed among its functions before it gets further disbursed to its employees. Treemap charts can be used to depict this distribution and compare it between functions. As you can see below, the hierarchy can be represented as a treemap to compare it directly with other functions:

The hierarchy at the top shows just the numbers and levels, but the treemap chart represents the numbers proportionally, allowing leaders to visualize the difference in distribution.
Interpretation: As you can easily see in the treemap, sales and marketing receive the same amount of revenue, while engineering is given significantly more than the other two.
Likewise, with treemap charts, you can:
- Compare popular lead sources with lead counts is the measure and lead source being the participating entity—a classic single-grouping configuration.
- View cost savings achieved across departments. With the departments as the grouping parameters and the cost saved as the measured amount, the chart lays out all the departments as tiles in proportion, based on money saved.
- Compare ad spends across channels, where channels are the parent grouping and ad spend is the measured unit.
Butterfly
Butterfly charts are used to compare two related datasets side-by-side, resulting in a representation that looks like a butterfly or tornado.
Now, how does it differ from bar charts?
The standard bar chart can compare two entities for a given measure. Say, you are comparing the performance of Mary and Charles. The two users' data is represented using bars, and the length will denote their performances. But, when it comes to comparing their performances over a period or their contribution across different stages, a bar chart is not sufficient.


With butterfly charts, you can:
- Compare revenue between two of your branches each month. With branches being compared for sum of sales revenue, grouped by closing date.
- Compare the performance of two reps in a given quarter. Compared between two users for average of amount of deals, grouped by closing date until today.
In addition to the user-based comparison above, butterfly charts are well-suited to visualizing other types of data comparisons, like:
- Picklist-based comparisons
- Duration-based comparisons
- Aggregate-based comparisons
Business scenario
Comparing the number of deals closed for each lead sources: Duration-based comparison
You can identify the productive lead source by comparing the number of deal closures for every lead source in your organization based on their closing week.

Analyzing effective sales methodology, inbound vs. outbound: Picklist-based comparison
Businesses use both inbound and outbound lead generation strategies, and each of these methods can reap different results based on the season and occasion. By comparing inbound versus outbound each month, you can identify which works best at what time.

Analyze the amount versus the expected revenue between accounts: Aggregate-based comparison
Expected revenue is a result of a deal's progression in the sales pipeline. Comparing the amount versus their expected revenue will not only help visualize the expected revenue of participating accounts but also indicate the accounts' stage in the sales pipeline.

Sankey
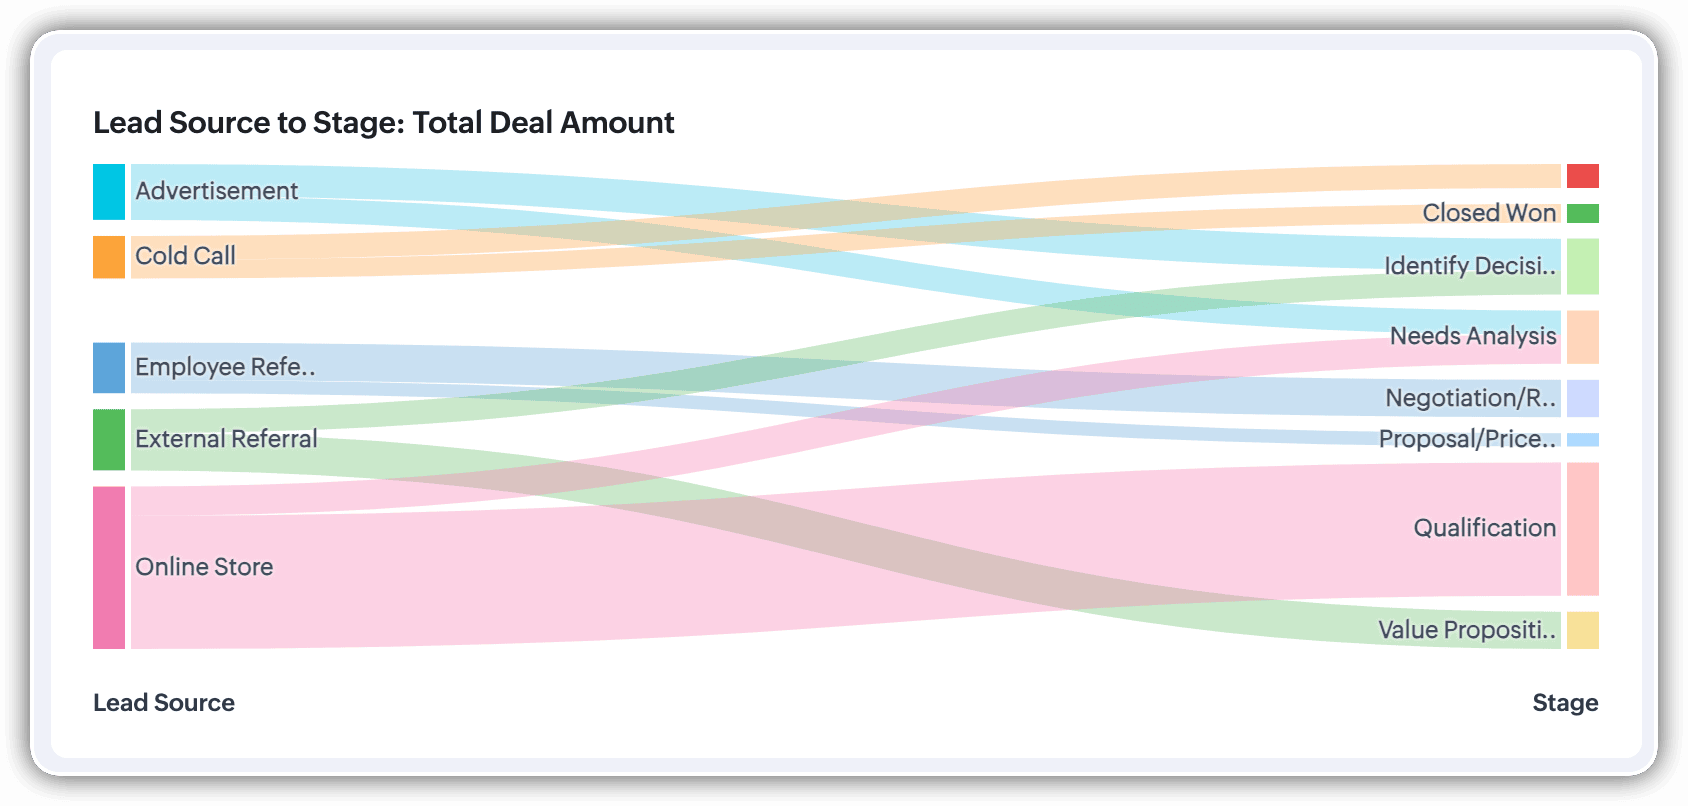
A Sankey Chart is designed to visualize the movement of data across different data groups. Unlike traditional charts—such as bar, column, pie, or donut—that mainly provide a static distribution of values, the Sankey Chart focuses on illustrating the flow between multiple segments or grouping fields. This makes it an ideal choice when you want to track how values (like lead counts, revenue, or deal statuses) move from one category to the next.

Key features
- Flow visualization: With the Sankey Chart, you can observe the movement of data between different groups.
- Multiple grouping fields: This chart works best when you have at least two grouping fields. You can go even further and add a third grouping to see an even more detailed mapping of your data flow.
- Simple configuration: The configuration for the Sankey Chart is as simple as any other chart type in Analytics.
Business scenarios:
Imagine you’re a sales manager trying to get a better handle on your team’s performance and your company’s pipeline. You want to understand not just how many deals are coming in, but also which sources are contributing the most value—and how those deals are progressing through different sales stages.
Let’s say you want to understand which lead sources are driving the most deal activity and how those deals progress through the pipeline. You can create a Sankey chart that maps the count of deals from Lead Source to Stage.

After analyzing the chart, you might notice that Online Store brings in a high volume of early-stage deals, while sources like External Referral contribute fewer deals that are more likely to reach advanced stages like Proposal or Negotiation.
This insight helps you prioritize nurturing the most profitable channels.
Sankey charts can also be helpful in other operational scenarios where understanding transitions across stages or teams is essential:
- Regional revenue distribution: Visualize how revenue flows across different regions, product categories, and their corresponding annual revenue. This helps you compare which regions contribute the most to each product line and where your high-value segments lie.
- Ticket handling flow: Visualize the flow of support tickets from their origin channel to internal departments and finally to resolution statuses. This can reveal workload imbalances or common points of delay in your support process.
Cluster
A cluster chart is similar to stacked column charts, but instead of stacking horizontally, the data is represented as vertical bars. As you create a column chart with multiple groupings, you can change the type of column chart to a cluster chart to achieve this representation.

In the above image, you can see the stacked column chart compares the number of lead conversions based on popular sources between countries. The stacks appearing on top of existing stacks ask you to calibrate the record count (y-axis) based on the previous stacks, which can lead to inaccurate interpretations. In this case, a cluster representation will paint a clearer picture of the analyses.
Other minor enhancements:
In addition to the three charts we mentioned above, we've also made the following minor changes:
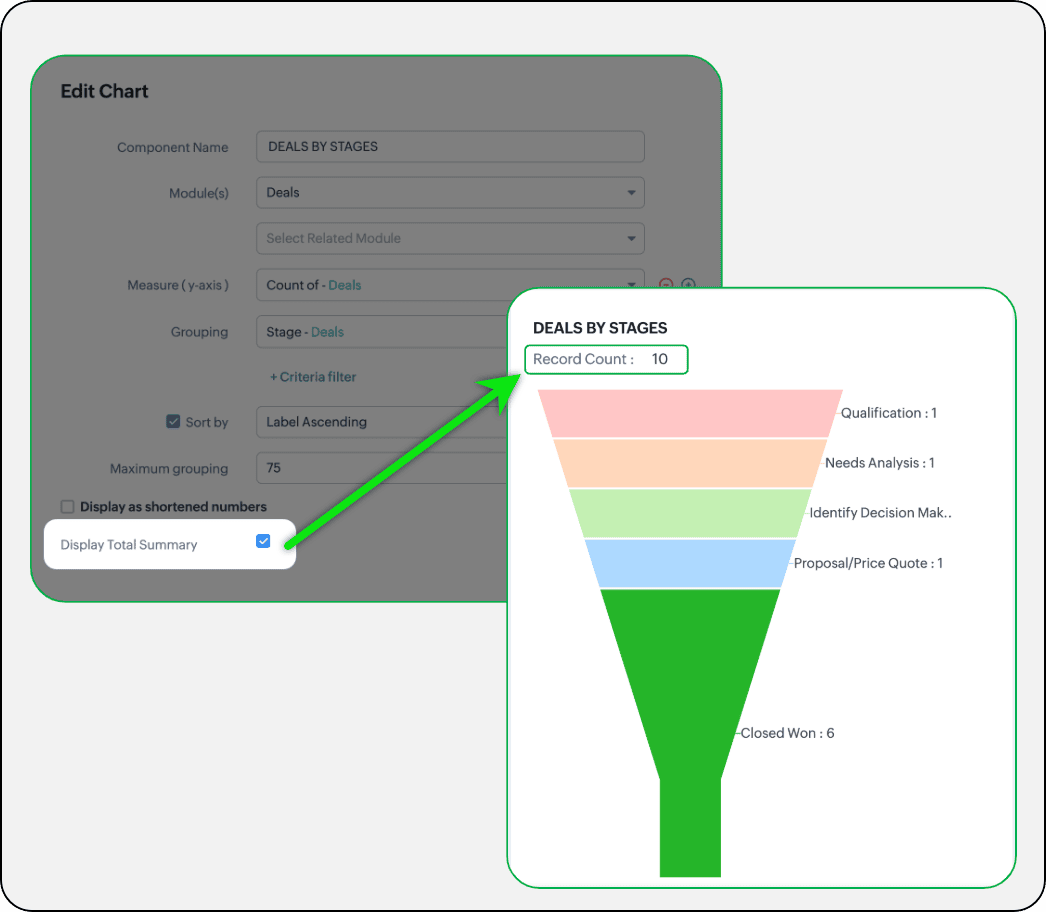
- Display total summary: Thus far, for all charts, each participating measure included labels. Now, to better understand overall contributions, a check box to display the total summary is provided under More options on the Chart Configuration page. Based on the configuration, the total revenue or the rolled-up quantities will be prominently displayed.
- Merge Y-axis: For charts that use two y-axis measurements, the intention is to view the progression of one entity against these two measures. Despite the scale, if the y-axis on the left is disproportionate to the values of the y-axis on the right, the plotted graph will result in a graphically and logically incorrect representation.
As you can see in the image below, the plot area of the sum of amount bar and the sum of expected revenue aligns close together, while, the difference between $700,000 and $40,500 is drastic, creating inaccurate interpretations.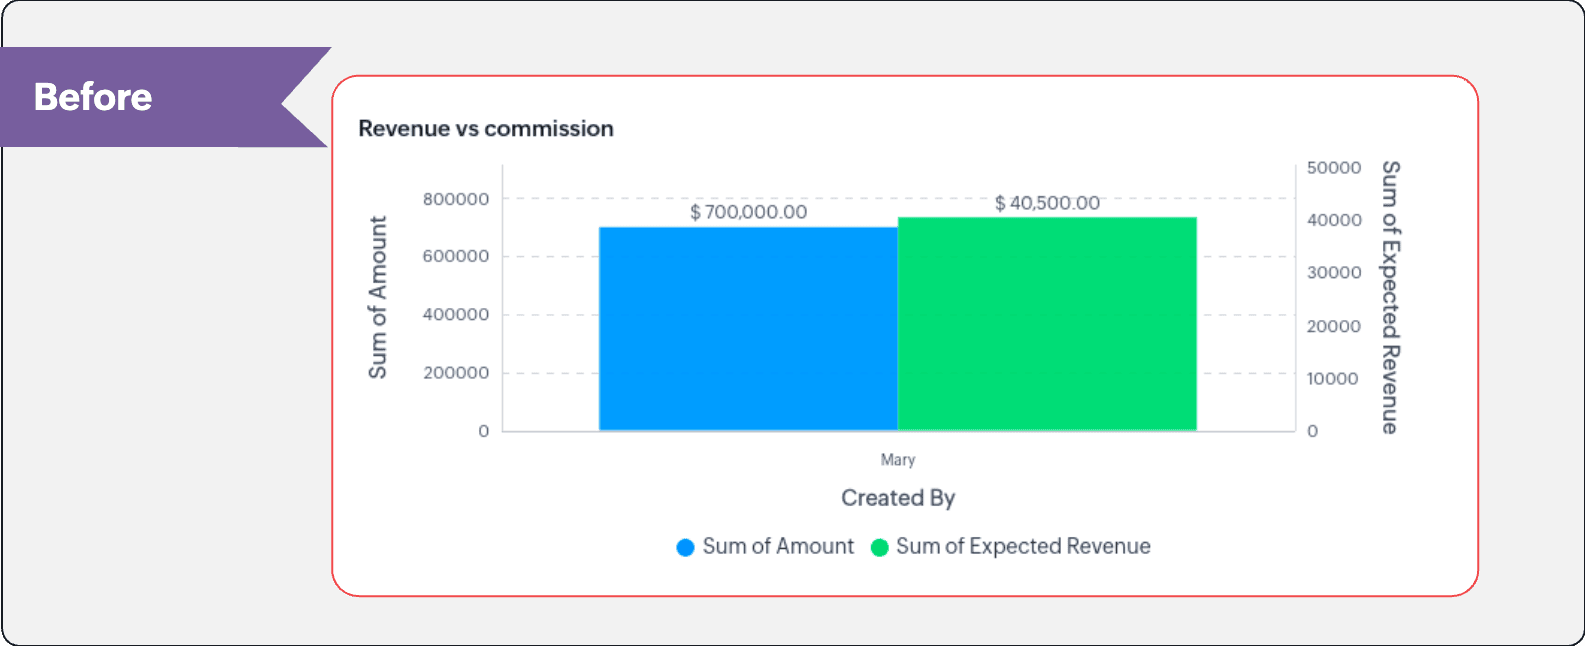
In this enhancement, we're allowing neighboring values of measures to merge so that the interpretation can be more visually accurate.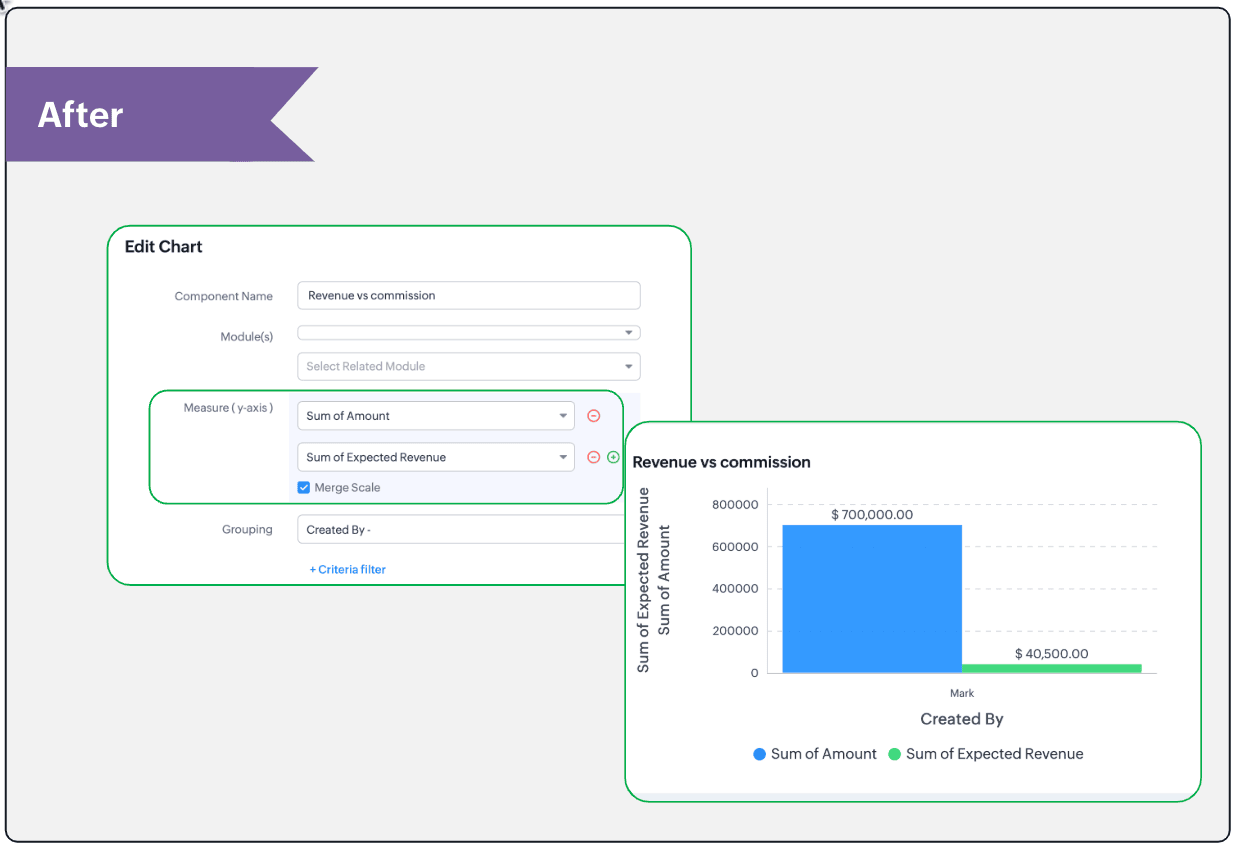
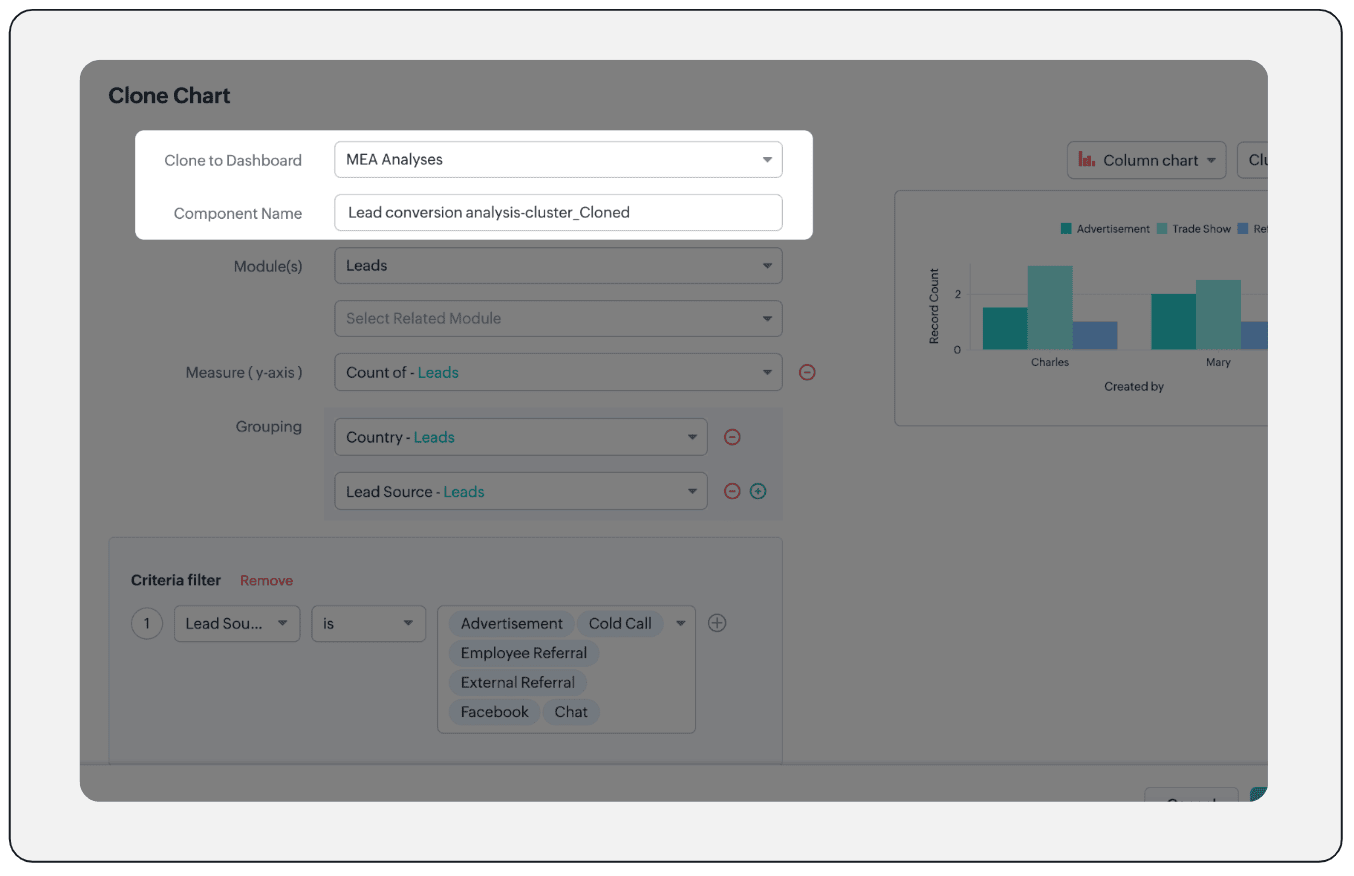
- Clone components to a different dashboard: Dashboards in Analytics serve in unique ways for various audiences—there can be separate dashboards for the sales team, marketing team, engineering team, and so on, and the chances of using the same measure for reference is common. Thus, when you clone a chart, you can now determine the target dashboard in which the cloned chart can be placed.
Resource: Help document
Thanks and have a good one!
Kind regards,
Saranya Balasubramanian
Saranya Balasubramanian
Topic Participants
Saranya Balasubramanian
Sticky Posts
Wrapping up 2025 on a high note: CRM Release Highlights of the year
Dear Customers, 2025 was an eventful year for us at Zoho CRM. We’ve had releases of all sizes and impact, and we are excited to look back, break it down, and rediscover them with you! Before we rewind—we’d like to take a minute and sincerely thank youGood news! Calendar in Zoho CRM gets a face lift
Dear Customers, We are delighted to unveil the revamped calendar UI in Zoho CRM. With a complete visual overhaul aligned with CRM for Everyone, the calendar now offers a more intuitive and flexible scheduling experience. What’s new? Distinguish activitiesPresenting ABM for Zoho CRM: Expand and retain your customers with precision
Picture this scenario: You're a growing SaaS company ready to launch a powerful business suite, and are looking to gain traction and momentum. But as a business with a tight budget, you know acquiring new customers is slow, expensive, and often deliversCreate and populate a record in an instant: Introducing zero-shot field prompting to Zia's ICR
A couple of months ago, we upgraded our in-house AI image detection and validation tool, Zia Vision, with intelligent character recognition (ICR). By training Zia with sample images, you could create and enrich CRM records with data extracted from standardIn-person ZUG Meetups for Real Estate Professionals - US Q1 2026
The Real Estate Zoho User Group is going on a multi-city, in-person meetup tour across the US, and we’d love to see you there! These meetups are a great opportunity to: Connect with fellow real estate professionals using Zoho Share challenges and discover
Recent Topics
Directly Edit, Filter, and Sort Subforms on the Details Page
Hello everyone, As you know, subforms allow you to associate multiple line items with a single record, greatly enhancing your data organization. For example, a sales order subform neatly lists all products, their quantities, amounts, and other relevantCustomer Parent Account or Sub-Customer Account
Some of clients as they have 50 to 300 branches, they required separate account statement with outlet name and number; which means we have to open new account for each branch individually. However, the main issue is that, when they make a payment, theyDrop Down Value
Hi, May I know why Zoho Flow treat this drop down as number and not as string. If so, how can I fetch the right value for filtering. This field is from Creator, in Creator upon checking by default it is a string since it's not a lookup field.Projects custom colors replaced by default orange
Since yesterday, projects uploaded to Zoho, to which I had assigned a custom color, have lost the customization and reverted to the default color (orange). Has anyone else had the same problem? If so, how did you resolve it?Where is the settings option in zoho writer?
hi, my zoho writer on windows has menu fonts too large. where do i find the settings to change this option? my screen resolution is correct and other apps/softwares in windows have no issues. regardsHow to manage task lists in Zoho Desk?
Hello, I use Zoho Desk for IT customer support. I have a list of standard operating procedures (SOPs), including SOPs for onboarding new users, offboarding users, losing a device, etc. These are lists of tasks to be performed depending on the situation.Add specific field value to URL
Hi Everyone. I have the following code which is set to run from a subform when the user selects a value from a lookup field "Plant_Key" the URL opens a report but i want the report to be filtered on the matching field/value. so in the report there isCreating a Chart from a Report
In Zoho Analytics, is it possible to create a chart from a Pivot View report? We are looking to use Zoho Analytics to replace Excel for Sales reports and would like to be able to show both the table and the chart together.Restrict Users access to login into CRM?
I’m wanting my employees to be able to utilize the Zoho CRM Lookup field within Zoho Forms. For them to use lookup field in Zoho Forms it is my understanding that they need to be licensed for Forms and the CRM. However, I don’t want them to be able tohow to change the page signers see after signing a document in zoho sign
Hello, How can I please change the page a signer sees after signing a document in Zoho Sign? I cannot seem to find it. As it is now, it shows a default landing page "return to Zoho Sign Home". Thanks!Holidays - Cannot Enter Two Holidays on Same Day
I have a fairly common setup, where part-time employees receive 1/2 day's pay on a holiday and full-time employees receive a full day's pay. Historically, I've been able to accommodate this by entering two separate holidays, one that covers full-timeIntroducing Connected Records to bring business context to every aspect of your work in Zoho CRM for Everyone
Hello Everyone, We are excited to unveil phase one of a powerful enhancement to CRM for Everyone - Connected Records, available only in CRM's Nextgen UI. With CRM for Everyone, businesses can onboard all customer-facing teams onto the CRM platform toCan a project be cloned?
Good afternoon, greetings. I would like to ask if it's possible to clone a project in Microsoft Project. I found a way to do it using templates, but I'm not sure if there's a direct way to clone a project. Thank you in advance for your attention, andJWT Token authentication problem that sometimes generates infinite redirect loops
Description : Nous proposons un bouton sur notre plateforme permettant de rediriger l'utilisateur vers le portail ZohoDesk via un jeton JWT pour une authentification transparente. Cependant, il arrive que certains utilisateurs soient pris dans une boucleUnknown table or alias 'A1'
I would like to create a subquery but i am getting the following error: Unknown table or alias 'A1' used in select query. This is the sql statement: SELECT A1.active_paying_customers, A1.active_trial_customers, A1.new_paying_signup, date(A1.date_active_customers),Why Sharing Rules do Not support relative date comparison???
I am creating a Sharing Rule and simply want to share where "Last Day of Coverage" (Date field) is Greater than TODAY (Starting Tomorrow). However, sharing rules don't have the option to compare a date field to a relative date (like today), only to Staticin the Zoho creator i have address field based the customer lookup im selecting the addresss , some times the customer address getting as null i want to show as blank
in the Zoho creator i have address field based the customer lookup im selecting the addresss , some times the customer address getting as null ,i want to show as blank instead of showing null. input.Billing_Address.address_line_1 = ifNUll(input.Customers_Name.Address.address_line_1,"");Question about upgrade and storage space Zoho Notebook
After upgarding my Zoho Notebook plan, I am running into the following issue. I just upgraded from a free Zoho Notebook subscription to Pro Lite after I got a notification in my Window Zoho Notebook desktop app saying that I had run out of space. However,how to add email to existing organization i w
I am already registered my organization and i have an email id. I need one more email id but i can't find anywhere .i want the cheapest email id . how to add ?Add multiple users to a task
When I´m assigning a task it is almost always related to more than one person. Practical situation: When a client request some improvement the related department opens the task with the situation and people related to it as the client itself, the salesmanadd zoho account
How to add a zoho mail to previous zoho account? I have twoThe reason I switched away from Zoho Notebook
My main reason for switching to Zoho was driven by three core principles: moving away from US-based products, keeping my data within India as much as possible, and supporting Indian companies. With that intent, I’ve been actively de-Googling my digitalName changed in settings for mailbox but still not changed when typed in To field
In the email account secretary@ i have updaetd the new staff members details but the old members name still appears when I type secretary@ in the To field. I cant work out where Zoho is finding the old name from. I have deleted the browser cache. If IPrinting to a brother label maker
I see allot of really old unanswered posts asking how to print to a label maker from a zoho creator app. Has their been any progress on providing the capability to create a customized height & width page or print template or whatever to print labels?Sync desktop folders instantly with WorkDrive TrueSync (Beta)
Keeping your important files backed up and accessible has never been easier! With WorkDrive desktop app (TrueSync), you can now automatically sync specific desktop folders to WorkDrive Web, ensuring seamless, real-time updates across devices. Important:CRM project association via deluge
I have created a workflow in my Zoho CRM for closing a deal. Part of this workflow leverages a deluge script to create a project for our delivery team. Creating the project works great however, after or during the project creation, I would like to associateTrack online, in-office, and client location meetings separately with the new meeting venue option
Hello everyone! We’re excited to announce meeting enhancements in Zoho CRM that bring more clarity and structure to how meetings are categorized. You can now specify the meeting venue to clearly indicate whether a meeting is being held online, at theCalling the new 'Custom API' feature from within a Custom Widget
From what I've learned it is not possible to call an endpoint from the new "Custom API" feature within a Creator Widget. The SDK's doesn't support it yet, when calling it natively you end up with CORS issues or at least I couldn't get it working evenAnnouncing new features in Trident for Mac (1.32.0)
Hello everyone! We’re excited to introduce the latest updates to Trident, which are designed to reinforce email security and protect your inbox from evolving threats. Let’s take a quick look at what’s new. Deliver quarantined emails. Organization adminsZoho LandingPage is integrated with Zoho One!
Greetings to the Zoho One users out there! We're delighted to let you know that Zoho LandingPage is available in Zoho One too! With Zoho LandingPage, you can host custom-made landing pages, and persuade the visitors to dive deeper by making further clicks,Marketing Tip #5: Improve store speed with optimized images
Slow-loading websites can turn visitors away. One of the biggest culprits? Large, uncompressed images. By optimizing your images, your store loads faster and creates a smoother shopping experience leading to higher sales. It also indirectly improves SEO.PDF Attachment Option for Service Reports
Hello Team, I would like to check with you all if there is an option to attach PDF documents to the service reports. When I try to attach a file, the system only allows the following formats: JPEG, JPG, and PNG. Could you please confirm whether PDF attachmentsZOHO Work Drive Back Up
I am looking for a ZOHO Work Drive backup solution. Something that is cloud based. There's lots of these kinds of options for Google Drive and other providers, but I have not seen anything for WorkDrive. Any suggestions?Wrapping up 2025 on a high note: CRM Release Highlights of the year
Dear Customers, 2025 was an eventful year for us at Zoho CRM. We’ve had releases of all sizes and impact, and we are excited to look back, break it down, and rediscover them with you! Before we rewind—we’d like to take a minute and sincerely thank youIssue with Zoho Creator Form Full-Screen View in CRM Related List Integration
Hi Team, We have created a custom application in Zoho Creator and integrated it into Zoho CRM as a related list under the Vendor module, which we have renamed as Consignors. Within the Creator application, there is a form named “Pickup Request.” InsideIntroducing workflow automation for the Products module
Greetings, I hope all of you are doing well. We're happy to announce a few recent enhancements we've made to Bigin's Products module. The Products module in Bigin now supports Workflows, enabling you to automate routine actions. Along with this update,Zoho Browser??
hai guys, this sounds awkward but can v get a ZOHO BROWSER same as zoho writer, etc. where i can browse websites @ home and continue browsing the same websites @ my office, as v have the option in Firefox, once i save and close the browser and again when i open it i will be getting the same sites. If u people r not clear with my explanation, plz let me know. Thanks, SandeepTask/Activity indicator in SalesPipeline overview has disappeared
I Just logged in my ZOHO CRM first 2026 checking my salespipeline overview , Every record card used to show an indication that there was an open task (Yellow if the expiry date was close, red if the expiry date was today and grey when it had expired).Notes badge as a quick action in the list view
Hello all, We are introducing the Notes badge in the list view of all modules as a quick action you can perform for each record, in addition to the existing Activity badge. With this enhancement, users will have quick visibility into the notes associatedSMS to customers from within Bigin
Hi All, Is there anyone else crying out for Bigin SMS capability to send an SMS to customers directly from the Bigin interface? We have inbuilt telephony already with call recordings which works well. What's lacking is the ability to send and receiveNext Page