Visualize your data with a new set of charts: Treemap, Butterfly, Sankey, and Cluster charts in Zoho CRM
Dear customers,
When it comes to analytics, it's not just about the numbers; it's about understanding the story behind them.
With that philosophy in mind, we’re excited to introduce a line of representations to the existing array of chart types in Zoho CRM: Treemap, butterfly, sankey and cluster charts. Let's go!
Treemaps
Treemap charts are used to visually represent hierarchical datasets in a rectangular layout. It aligns its parent categories as larger tiles with their sub-categories nested within them. The size of each tile is proportional to its corresponding value, making it easy to compare different segments within the hierarchy.
This is how a treemap chart looks:

These structured data representations help you understand overall performance and contributions, as well as compare participating entities at a glance.
Unlike traditional bar charts or pie charts, treemaps can be used if your datasets are large and exhibit parent-child relationships.
Here are some examples to better understand their usage:
Comparing revenue distribution between functions
A company's revenue is distributed among its functions before it gets further disbursed to its employees. Treemap charts can be used to depict this distribution and compare it between functions. As you can see below, the hierarchy can be represented as a treemap to compare it directly with other functions:

The hierarchy at the top shows just the numbers and levels, but the treemap chart represents the numbers proportionally, allowing leaders to visualize the difference in distribution.
Interpretation: As you can easily see in the treemap, sales and marketing receive the same amount of revenue, while engineering is given significantly more than the other two.
Likewise, with treemap charts, you can:
- Compare popular lead sources with lead counts is the measure and lead source being the participating entity—a classic single-grouping configuration.
- View cost savings achieved across departments. With the departments as the grouping parameters and the cost saved as the measured amount, the chart lays out all the departments as tiles in proportion, based on money saved.
- Compare ad spends across channels, where channels are the parent grouping and ad spend is the measured unit.
Butterfly
Butterfly charts are used to compare two related datasets side-by-side, resulting in a representation that looks like a butterfly or tornado.
Now, how does it differ from bar charts?
The standard bar chart can compare two entities for a given measure. Say, you are comparing the performance of Mary and Charles. The two users' data is represented using bars, and the length will denote their performances. But, when it comes to comparing their performances over a period or their contribution across different stages, a bar chart is not sufficient.


With butterfly charts, you can:
- Compare revenue between two of your branches each month. With branches being compared for sum of sales revenue, grouped by closing date.
- Compare the performance of two reps in a given quarter. Compared between two users for average of amount of deals, grouped by closing date until today.
In addition to the user-based comparison above, butterfly charts are well-suited to visualizing other types of data comparisons, like:
- Picklist-based comparisons
- Duration-based comparisons
- Aggregate-based comparisons
Business scenario
Comparing the number of deals closed for each lead sources: Duration-based comparison
You can identify the productive lead source by comparing the number of deal closures for every lead source in your organization based on their closing week.

Analyzing effective sales methodology, inbound vs. outbound: Picklist-based comparison
Businesses use both inbound and outbound lead generation strategies, and each of these methods can reap different results based on the season and occasion. By comparing inbound versus outbound each month, you can identify which works best at what time.

Analyze the amount versus the expected revenue between accounts: Aggregate-based comparison
Expected revenue is a result of a deal's progression in the sales pipeline. Comparing the amount versus their expected revenue will not only help visualize the expected revenue of participating accounts but also indicate the accounts' stage in the sales pipeline.

Sankey
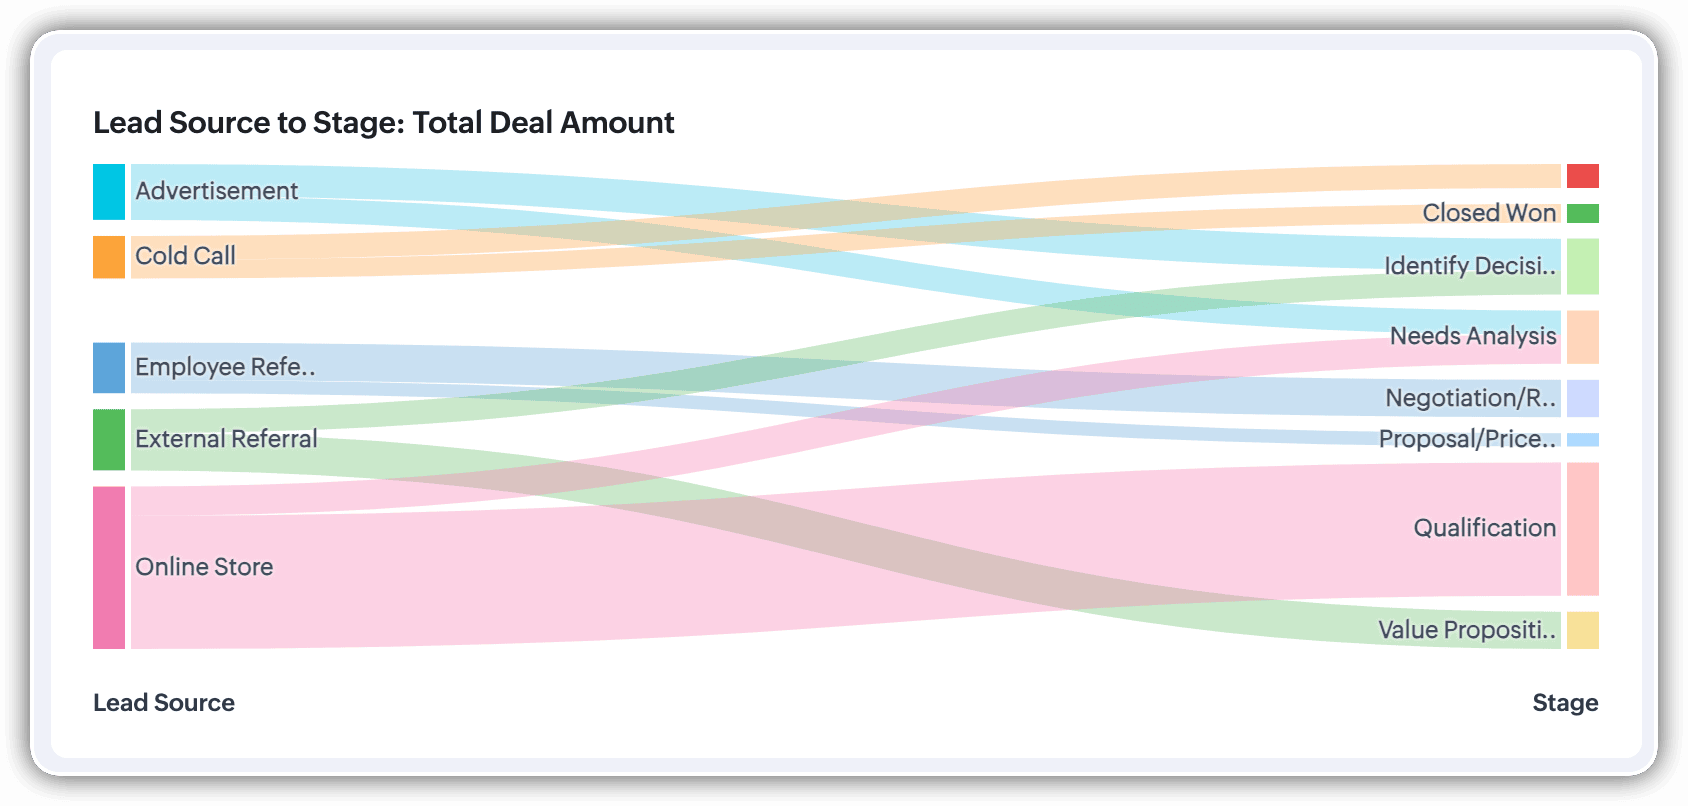
A Sankey Chart is designed to visualize the movement of data across different data groups. Unlike traditional charts—such as bar, column, pie, or donut—that mainly provide a static distribution of values, the Sankey Chart focuses on illustrating the flow between multiple segments or grouping fields. This makes it an ideal choice when you want to track how values (like lead counts, revenue, or deal statuses) move from one category to the next.

Key features
- Flow visualization: With the Sankey Chart, you can observe the movement of data between different groups.
- Multiple grouping fields: This chart works best when you have at least two grouping fields. You can go even further and add a third grouping to see an even more detailed mapping of your data flow.
- Simple configuration: The configuration for the Sankey Chart is as simple as any other chart type in Analytics.
Business scenarios:
Imagine you’re a sales manager trying to get a better handle on your team’s performance and your company’s pipeline. You want to understand not just how many deals are coming in, but also which sources are contributing the most value—and how those deals are progressing through different sales stages.
Let’s say you want to understand which lead sources are driving the most deal activity and how those deals progress through the pipeline. You can create a Sankey chart that maps the count of deals from Lead Source to Stage.

After analyzing the chart, you might notice that Online Store brings in a high volume of early-stage deals, while sources like External Referral contribute fewer deals that are more likely to reach advanced stages like Proposal or Negotiation.
This insight helps you prioritize nurturing the most profitable channels.
Sankey charts can also be helpful in other operational scenarios where understanding transitions across stages or teams is essential:
- Regional revenue distribution: Visualize how revenue flows across different regions, product categories, and their corresponding annual revenue. This helps you compare which regions contribute the most to each product line and where your high-value segments lie.
- Ticket handling flow: Visualize the flow of support tickets from their origin channel to internal departments and finally to resolution statuses. This can reveal workload imbalances or common points of delay in your support process.
Cluster
A cluster chart is similar to stacked column charts, but instead of stacking horizontally, the data is represented as vertical bars. As you create a column chart with multiple groupings, you can change the type of column chart to a cluster chart to achieve this representation.

In the above image, you can see the stacked column chart compares the number of lead conversions based on popular sources between countries. The stacks appearing on top of existing stacks ask you to calibrate the record count (y-axis) based on the previous stacks, which can lead to inaccurate interpretations. In this case, a cluster representation will paint a clearer picture of the analyses.
Other minor enhancements:
In addition to the three charts we mentioned above, we've also made the following minor changes:
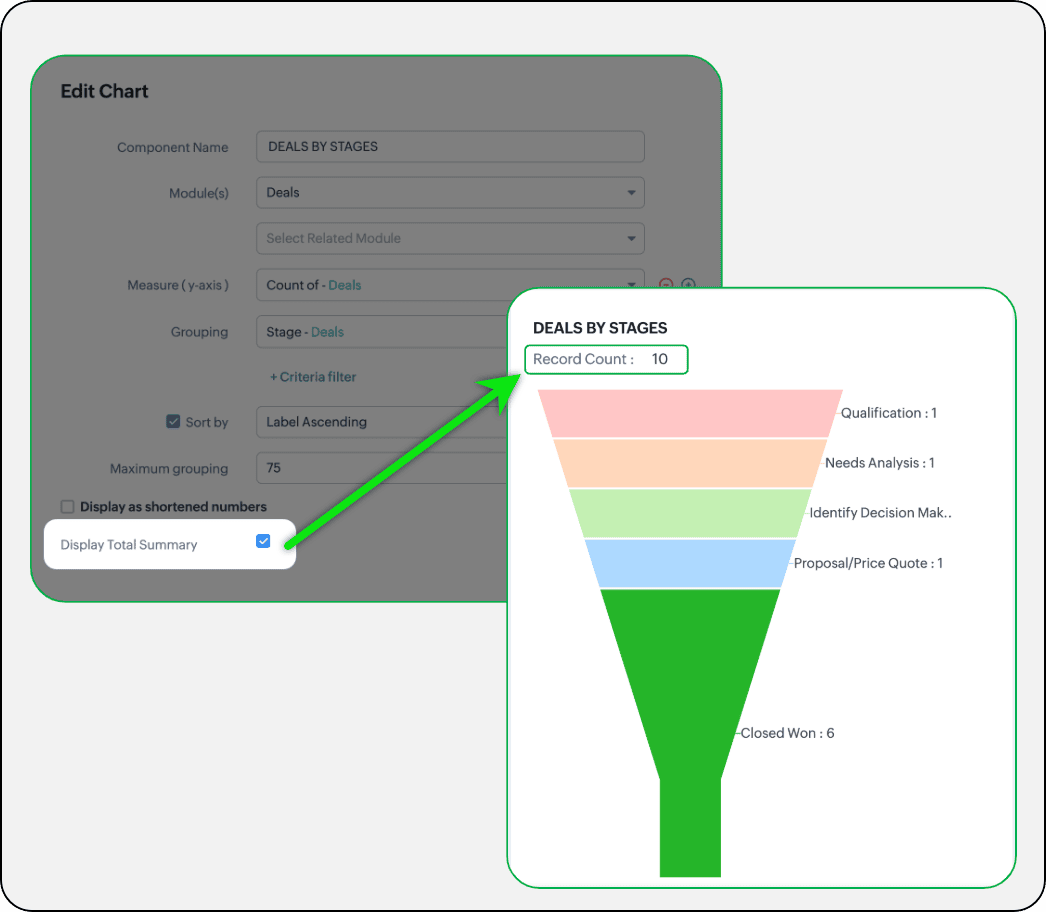
- Display total summary: Thus far, for all charts, each participating measure included labels. Now, to better understand overall contributions, a check box to display the total summary is provided under More options on the Chart Configuration page. Based on the configuration, the total revenue or the rolled-up quantities will be prominently displayed.
- Merge Y-axis: For charts that use two y-axis measurements, the intention is to view the progression of one entity against these two measures. Despite the scale, if the y-axis on the left is disproportionate to the values of the y-axis on the right, the plotted graph will result in a graphically and logically incorrect representation.
As you can see in the image below, the plot area of the sum of amount bar and the sum of expected revenue aligns close together, while, the difference between $700,000 and $40,500 is drastic, creating inaccurate interpretations.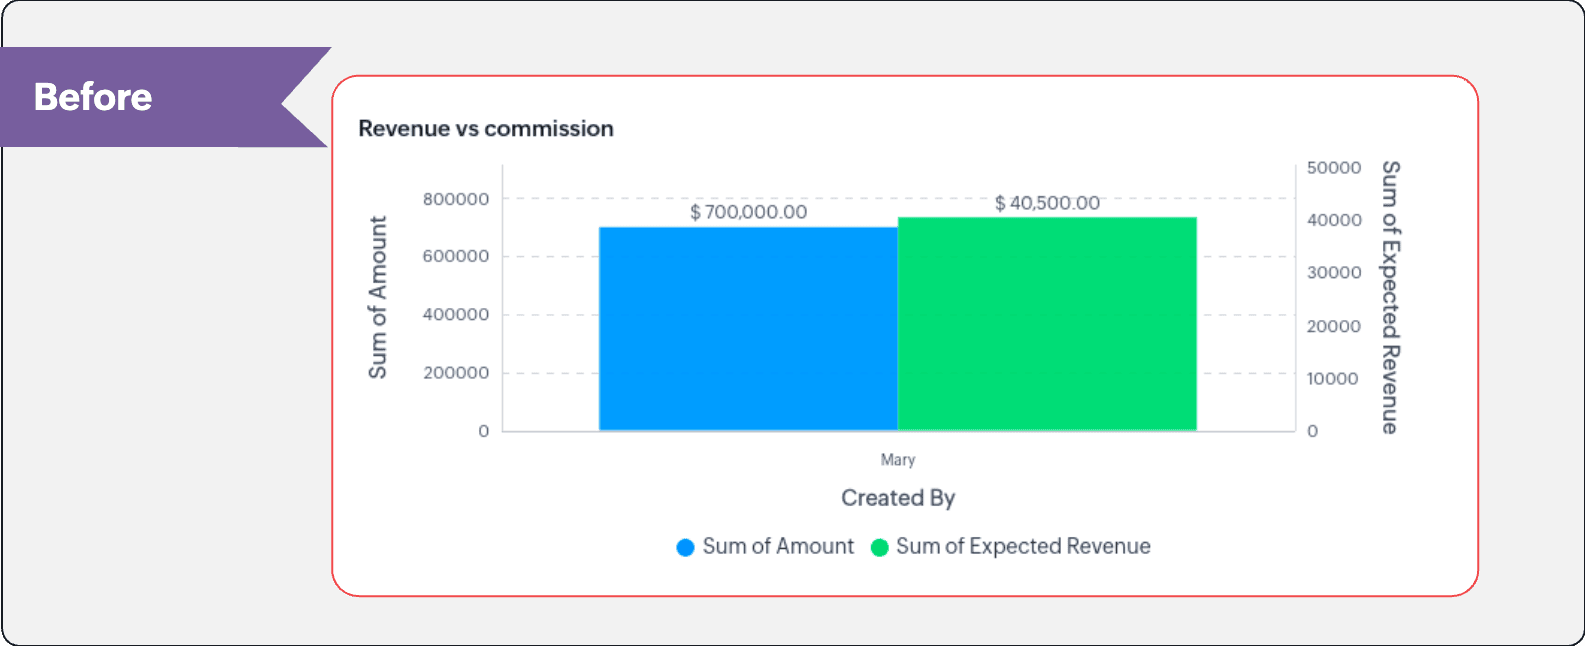
In this enhancement, we're allowing neighboring values of measures to merge so that the interpretation can be more visually accurate.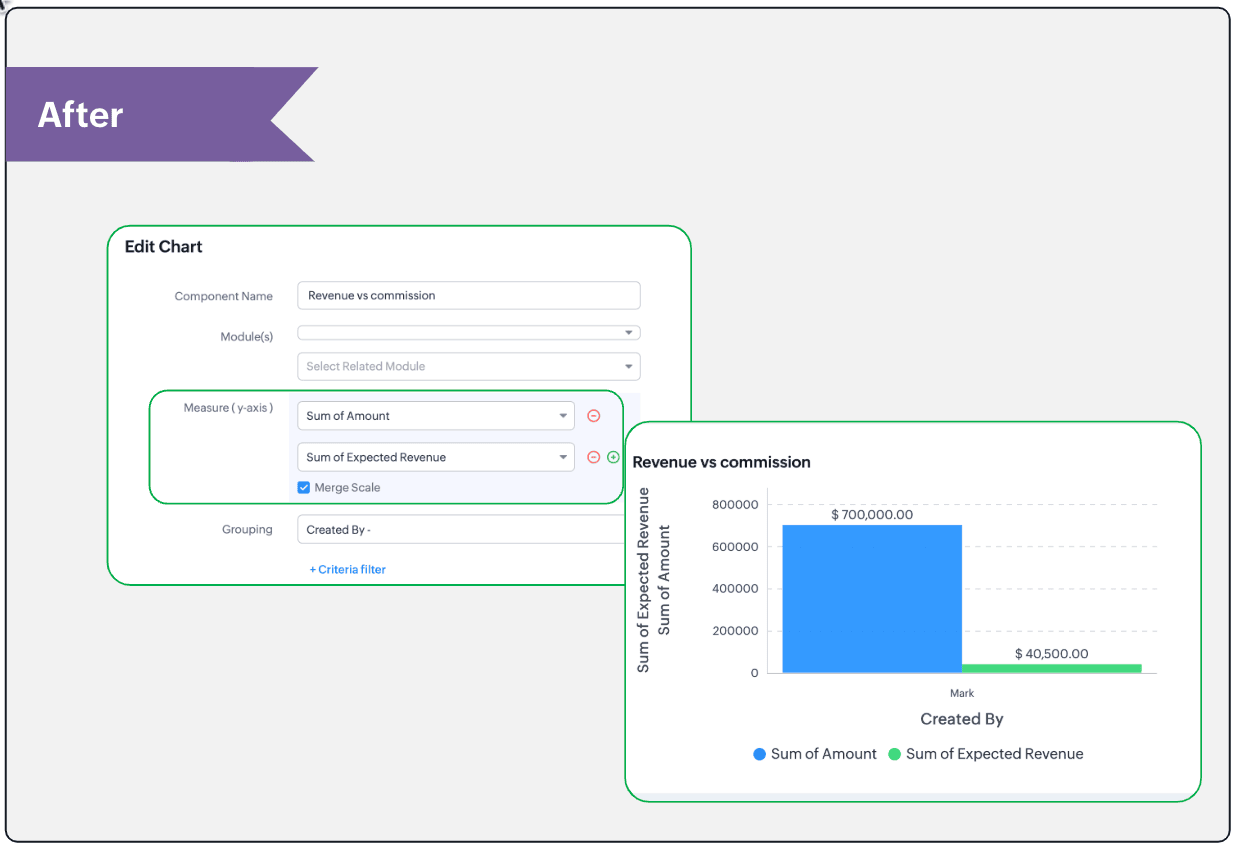
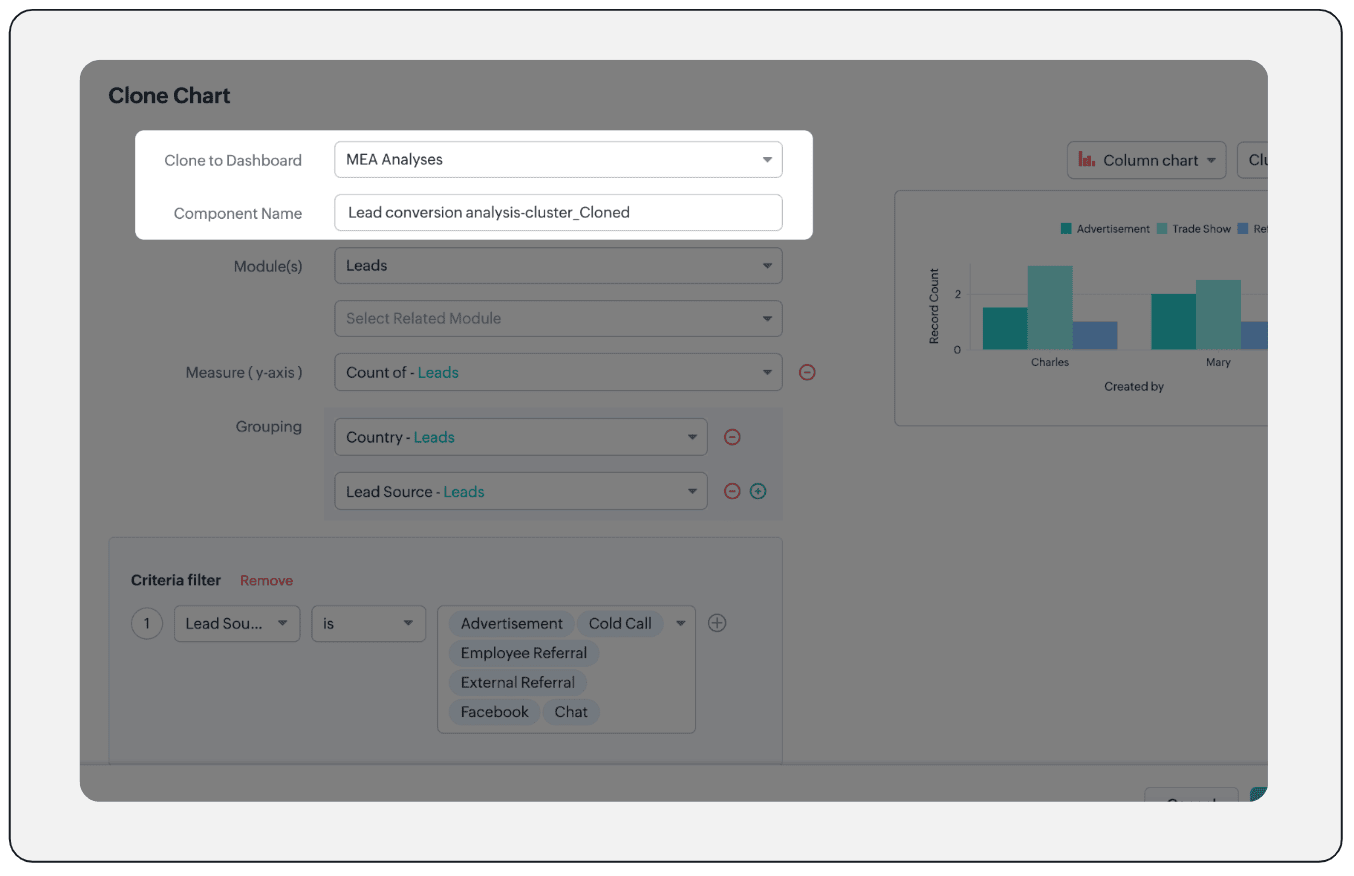
- Clone components to a different dashboard: Dashboards in Analytics serve in unique ways for various audiences—there can be separate dashboards for the sales team, marketing team, engineering team, and so on, and the chances of using the same measure for reference is common. Thus, when you clone a chart, you can now determine the target dashboard in which the cloned chart can be placed.
Resource: Help document
Thanks and have a good one!
Kind regards,
Saranya Balasubramanian
Saranya Balasubramanian
Topic Participants
Saranya Balasubramanian
Sticky Posts
Good news! Calendar in Zoho CRM gets a face lift
Dear Customers, We are delighted to unveil the revamped calendar UI in Zoho CRM. With a complete visual overhaul aligned with CRM for Everyone, the calendar now offers a more intuitive and flexible scheduling experience. What’s new? Distinguish activitiesConsumers are talking about your business. Are you listening?👂
A loyal customer might be praising your product in a forum. A frustrated user could be posting a harsh review on a public site. An excited partner may have left a comment on your campaign. A domain expert might be deconstructing your product. A prospectEnhancements to the formula field in Zoho CRM: Auto-refresh formulas with the "Now" function, stop formula executions based on criteria, and include formulas within formulas
Dear Customers, We hope you're well! By their nature, modern businesses rely every day on computations, whether it's to calculate the price of a product, assess ROI, evaluate the lifetime value of a customer, or even determine the age of a record. WithElevate your CX delivery using CommandCenter 2.0: Simplified builder; seamless orchestration
Most businesses want to create memorable customer experiences—but they often find it hard to keep them smooth, especially as they grow. To achieve a state of flow across their processes, teams often stitch together a series of automations using WorkflowPresenting ABM for Zoho CRM: Expand and retain your customers with precision
Picture this scenario: You're a growing SaaS company ready to launch a powerful business suite, and are looking to gain traction and momentum. But as a business with a tight budget, you know acquiring new customers is slow, expensive, and often delivers
Recent Topics
Option to block bookings from specific email address or ip adresss in zoho booking
Sometime few of our client keep booking irrelevant booking service just to resolve their queries and they keep booking it again and again whenever they have queries. Currently its disturbing our current communication process and hierarchy which we haveAuto select option in CRM after Zoho Form merge
Hi, I have a dropdown field in Zoho CRM that is filled with a Zoho Form. The data is filled but not automatically shown. After selecting the right value in the dropdown the information a second field is shown. So the question is; how can I make the dropdownスマホでキャンペンメールを見ると正しく表示されない
キャンペーンのメール(HTML)を作成しましたが、スマホ表示に切り替えると正しく表示されません(添付参照)過去に作成したキャンペーンでは特に意識してませんでしたが、問題なく表示されていたようです。うまく表示される場合とされない場合の違いは何でしょうか?Bring your CRM data straight into your presentations in Zoho Show
Let's say you are working on a presentation about your team's sales pipeline for an upcoming strategy meeting. All the information you need about clients and leads is in Zoho CRM, but you end up copying details from the CRM into your slides, adjustingImproved RingCentral Integration
We’d like to request an enhancement to the current RingCentral integration with Zoho. RingCentral now automatically generates call transcripts and AI-based call summaries (AI Notes) for each call, which are extremely helpful for support and sales teams.Introducing New APIs in Zoho Contracts
We are excited to announce the release of new APIs in Zoho Contracts to help you automate and manage every stage of your contract lifecycle more efficiently. Here’s a quick overview of what’s new: 1. Complete Contract Draft You can use this API to completeVimeo
For me Vimeo is the most important video social channel for media and filmmakers. Would others agree and like it added to Zoho Social.Delete a department or category
How do I delete a Department? Also, how do I delete a Category? This is pretty basic stuff here and it's impossible to find.Organization Emails in Email History
How can I make received Org Emails to show up here?Editing the Ticket Properties column
This is going to sound like a dumb question, but I cannot figure out how to configure/edit the sections (and their fields) in this column: For example, we have a custom "Resolution" field, which parked itself in the "Ticket Information" section of thisDeleting Fields in CRM Deletes Views in Analytics
Hey friends! I'm having some issues when we modify some fields within ZohoCRM. There are times where we need to sunset a field and eventually completely remove it. In these instances, it seems like a lot of views are removed in Analytics. This rangesZoho Analytics Automatically Deletes Queries and Reports When a Synced CRM Field Is Removed
We’ve encountered a serious and recurring issue that poses a massive data integrity risk for any Zoho Analytics customer using Zoho CRM integration. When a field is deleted in Zoho CRM — even an unused one — Zoho Analytics automatically deletes everyHow to setup pricing in Zoho
Hi everyone, I am relatively new here and have just moved from my old inventory system to the Zoho one. I am trying to get my head around how it all works. I am mostly setup connected to a shopify store, but I do manual sales also For manual invoicing,Prefilled Date fields auto-changed and then locked when using “Edit as new”
If a document out for signature has date fields (not SignedDate fields) that were pre-filled before sending, and then you use “Edit as new” to create a new version of the same document, the value of those date fields gets automatically changed to todayIs there a way to update all the start and end dates of tasks of a project after a calendar change?
Hi! Here's my situation. I've built a complete project planning. All its tasks have start dates and due dates. After completing the planning, I've realized that the project calendar was not the right one. So I changed the project calendar. I now haveAccess Phone Field Components (Country Code) Directly
Hello everyone, I'd like to propose an enhancement for the Phone field in Zoho Creator. The Problem: The Phone field captures the country code and local number separately, but stores them as a single string (e.g., +1234567890). To get the country code,Send mass messages through WhatsApp from the Tickets module
Hi Everyone! Effective communication is key to delivering prompt and reliable customer support. Because WhatsApp is one of the most widely used and familiar messaging platforms, it's an effective channel for agents to reach customers who have submittedThe difference between Zoho Marketing Automation and Zoho Campaigns
Greetings Marketers! This post aims to differentiate between Zoho Marketing Automation and Zoho Campaigns. By the time you get to the end of the post, you will be able to choose a product that objectively suits you. What is Zoho Marketing Automation?Lead Owner Signature Merge Field
I want to automatically insert a signature (i.e. contact info usually found at the bottom of an email) into an email template, depending on who the lead owner is. What is the merge code for the Signature from a Users profile? CRM > Settings > Customization > Templates There is a popup near the bottom of the edit screen which says: "You can insert a Signature, which is available as a merge field in the users section." It is also referenced on this page: https://help.zoho.com/portal/en/kb/crm/customize-crm-account/customizing-templates/articles/template-builder#Merge_FieldsHow do I create a time field?
I want a field that only records time. I can only see how to create a date-time field. If I do that and enter a time, without a date, nothing is recorded. If I create a number or decimal field, I cannot use it in time calculations. All I want is a fieldExperience effortless record management in CRM For Everyone with the all-new Grid View!
Hello Everyone, Hope you are well! As part of our ongoing series of feature announcements for Zoho CRM For Everyone, we’re excited to bring you another type of module view : Grid View. In addition to Kanban view, List view, Canvas view, Chart view andAlternating columns - How to reverse order on mobile - Responsive template
Can the order of alternating columns be reversed on mobile so that image comes before the text? Example: Desktop Row 1 column Left (image) , column right (text) Row 2 column Left (text) , column right (image) Mobile Currently Row 1 Image over text RowLet us view and export the full price books data from CRM
I quote out of CRM, some of my clients have specialised pricing for specific products - therefore we use Price Books to manage these special prices. I can only see the breakdown of the products listed in the price book and the specialised pricing forInvokeURL butchering JSON for OpenAI API calls
My organization works with mostly educational institutions. We have a custom module called "Schools", which is the user-entered school name they put when using our service (which they enter along with their state and zip code). We want to map this toCRM for email in Outlook: how to ignore addresses?
We’re using the "Zoho CRM for email" add-in for Outlook. When opening an email, the add-in displays all email addresses from the message and allows me to add them to the CRM or shows if they’re already contacts. However, sometimes people listed in ToCustom order for Current Stage (Blueprint field)
Hi! I suggest adding the option to set a custom order in reports for the Blueprint field ‘Current Stage’. Currently, these fields can only be sorted in ascending or descending order. Thanks!CRM E-mail Sync from Outlook
We are exploring Zoho as a possible new solution for our company. We are trying to understand further on how e-mail sync works. We use outlook. Our current CRM logs anytime we e-mail a customer so we can see in the CRM the message sent to the customer.Run your help desk on your schedule
In business, time is of the essence. This is especially true in a function like customer service, where KPIs such as response time and agent availability are the measures of success. Perhaps the most crucial consideration one needs to make about time is your hours of operation. These set expectations for your customer and for employees. To make communicating this information easier, we've revamped the way business hours and holiday lists work in Zoho Desk. In order to accommodate teams that workThe Customer Happiness REST API is broken
1. We are unable to extract the customerHappiness ( https://desk.zoho.com/DeskAPIDocument#CustomerHappiness#CustomerHappiness_ListallcustomerHappiness) object using the ticketNumber criteria. We keep getting HTTP 429 even when we limit to 60 calls perCan the Product Image on the Quote Template be enlarged
Hello, I am editing the Quote Template and added ${Products.Product Image} to the line item and the image comes up but it is very tiny. Is there anyway that you can resize this to be larger? Any help would be great! ThanksAutomatic Department and Employee Sync Between Zoho One and Zoho People
Dear Zoho Support, I'm writing to propose a valuable feature request that would streamline data management and improve user experience within the Zoho ecosystem: automatic synchronization between departments and employees in Zoho One and Zoho People.Zoho Expense and Chase Bank Visa credit cards - Direct Feed?
Our company uses JP Morgan Chase Visa credit cards. We can't be the first to try and use a combination of Zoho Expense + Chase Bank + Visa Credit Cards --- anyone successful with this combination? 1. The direct feed automation isn't working. When I goImpossibile inviare il messaggio;Motivo:554 5.1.8 Indirizzo del mittente bloccato
" Impossibile inviare il messaggio;Motivo:554 5.1.8 Indirizzo del mittente bloccato" Hi need to send email, how can fix this? Thanks, AliceImage inputed in Zoho Form were displayed to small in exported version
Good evening, my name is athallah, i am a trainee in government office Right now, i use Zoho form to digitalize an airfield monitoring form. my problem is, the image were to small to displayed in exported version. it really bad for formal presentationAPI. How do I get responses submitted to the form?
Hi, I'm trying to retrieve a list of form responses via the API. I've created a Self Client application in API Console. What scoup should I enter? What are the endpoints? Is there documentation on this anywhere? I've wasted a lot of time searching. GPTQuestion about Zoho CRM Professional plan users
Hello! I have a question about the Zoho CRM Professional plan. Is the pricing charged per user or per organization? Are there any free users included in this plan, or do I need to pay for each additional user separately? Thank you!Communicating with emojis
On July 17, we celebrate World Emoji Day! We're a bit late 😐 sharing insights about this day. But we just couldn't let it pass without a mention 😊 because emojis have a meaningful connection with customer service 💬 🤝. We do not want to miss out onChanging the Default Search Criteria for Finding Duplicates
Hey everyone, is it possible to adjust the default search criteria for finding and merging duplicate records? Right now, CRM uses some (in my opinion nonsensical) fields as search criteria for duplicate records which do nothing except dilute the results.Microsoft Teams now available as an online meeting provider
Hello everyone, We're pleased to announce that Zoho CRM now supports Microsoft Teams as an online meeting provider—alongside the other providers already available. Admins can enable Microsoft Teams directly from the Preferences tab under the MeetingsIs it possible to create a word cloud chart in ZoHo Analystics?
Hi there, I have a volume of transaction text that I would like to analyse using word cloud (or other approcah to detect and present word frequency in a dataset). For example, I have 50,000 records describing menu items in restaurants. I want to be ableNext Page