Visualize your data with a new set of charts: Treemap, Butterfly, Sankey, and Cluster charts in Zoho CRM
Dear customers,
When it comes to analytics, it's not just about the numbers; it's about understanding the story behind them.
With that philosophy in mind, we’re excited to introduce a line of representations to the existing array of chart types in Zoho CRM: Treemap, butterfly, sankey and cluster charts. Let's go!
Treemaps
Treemap charts are used to visually represent hierarchical datasets in a rectangular layout. It aligns its parent categories as larger tiles with their sub-categories nested within them. The size of each tile is proportional to its corresponding value, making it easy to compare different segments within the hierarchy.
This is how a treemap chart looks:

These structured data representations help you understand overall performance and contributions, as well as compare participating entities at a glance.
Unlike traditional bar charts or pie charts, treemaps can be used if your datasets are large and exhibit parent-child relationships.
Here are some examples to better understand their usage:
Comparing revenue distribution between functions
A company's revenue is distributed among its functions before it gets further disbursed to its employees. Treemap charts can be used to depict this distribution and compare it between functions. As you can see below, the hierarchy can be represented as a treemap to compare it directly with other functions:

The hierarchy at the top shows just the numbers and levels, but the treemap chart represents the numbers proportionally, allowing leaders to visualize the difference in distribution.
Interpretation: As you can easily see in the treemap, sales and marketing receive the same amount of revenue, while engineering is given significantly more than the other two.
Likewise, with treemap charts, you can:
- Compare popular lead sources with lead counts is the measure and lead source being the participating entity—a classic single-grouping configuration.
- View cost savings achieved across departments. With the departments as the grouping parameters and the cost saved as the measured amount, the chart lays out all the departments as tiles in proportion, based on money saved.
- Compare ad spends across channels, where channels are the parent grouping and ad spend is the measured unit.
Butterfly
Butterfly charts are used to compare two related datasets side-by-side, resulting in a representation that looks like a butterfly or tornado.
Now, how does it differ from bar charts?
The standard bar chart can compare two entities for a given measure. Say, you are comparing the performance of Mary and Charles. The two users' data is represented using bars, and the length will denote their performances. But, when it comes to comparing their performances over a period or their contribution across different stages, a bar chart is not sufficient.


With butterfly charts, you can:
- Compare revenue between two of your branches each month. With branches being compared for sum of sales revenue, grouped by closing date.
- Compare the performance of two reps in a given quarter. Compared between two users for average of amount of deals, grouped by closing date until today.
In addition to the user-based comparison above, butterfly charts are well-suited to visualizing other types of data comparisons, like:
- Picklist-based comparisons
- Duration-based comparisons
- Aggregate-based comparisons
Business scenario
Comparing the number of deals closed for each lead sources: Duration-based comparison
You can identify the productive lead source by comparing the number of deal closures for every lead source in your organization based on their closing week.

Analyzing effective sales methodology, inbound vs. outbound: Picklist-based comparison
Businesses use both inbound and outbound lead generation strategies, and each of these methods can reap different results based on the season and occasion. By comparing inbound versus outbound each month, you can identify which works best at what time.

Analyze the amount versus the expected revenue between accounts: Aggregate-based comparison
Expected revenue is a result of a deal's progression in the sales pipeline. Comparing the amount versus their expected revenue will not only help visualize the expected revenue of participating accounts but also indicate the accounts' stage in the sales pipeline.

Sankey
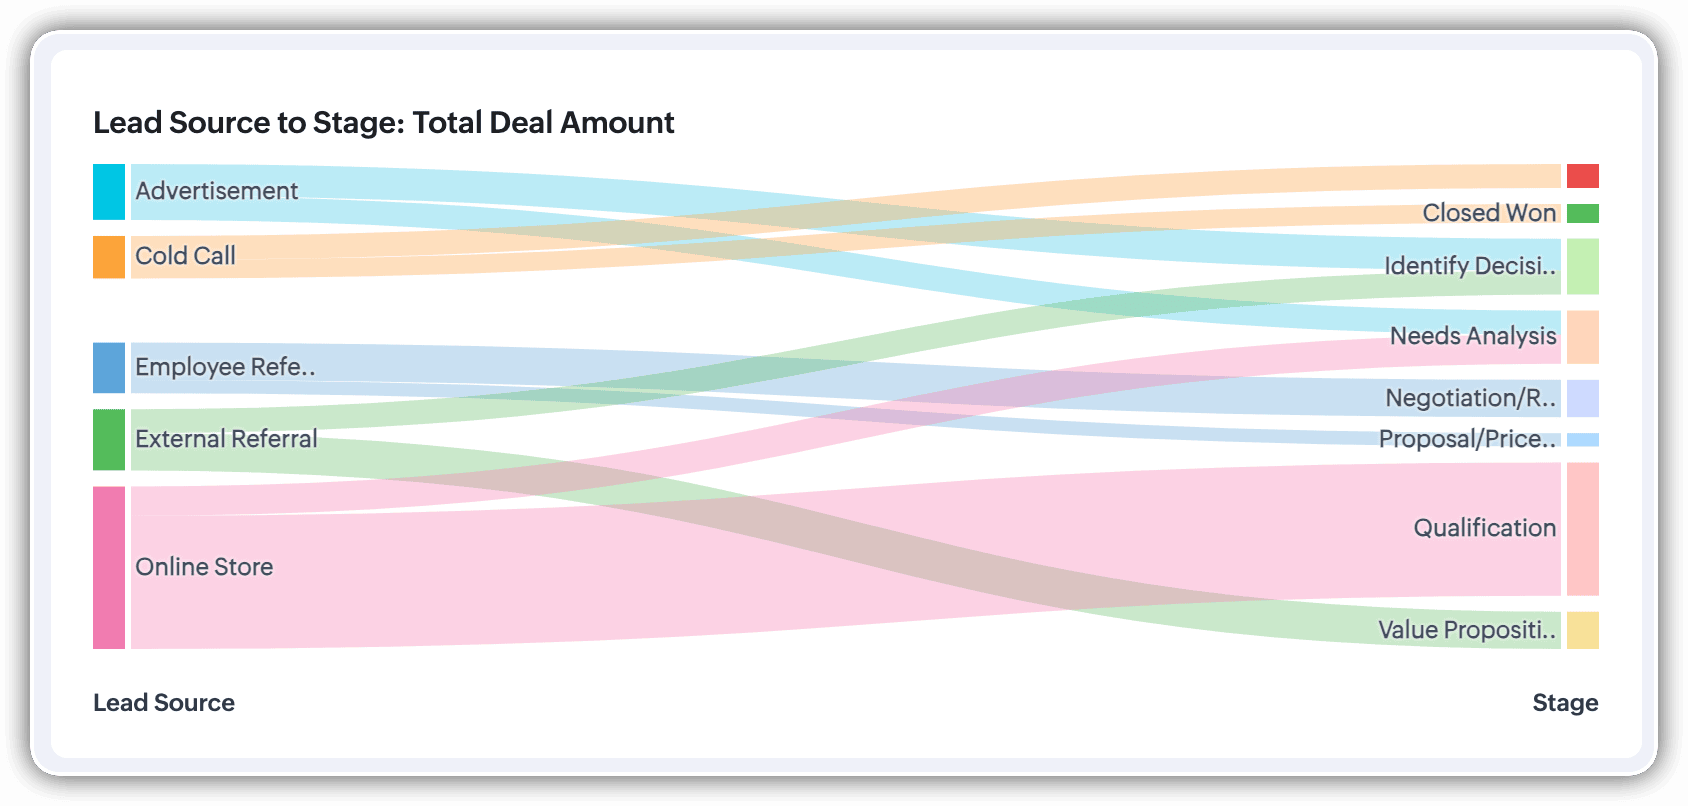
A Sankey Chart is designed to visualize the movement of data across different data groups. Unlike traditional charts—such as bar, column, pie, or donut—that mainly provide a static distribution of values, the Sankey Chart focuses on illustrating the flow between multiple segments or grouping fields. This makes it an ideal choice when you want to track how values (like lead counts, revenue, or deal statuses) move from one category to the next.

Key features
- Flow visualization: With the Sankey Chart, you can observe the movement of data between different groups.
- Multiple grouping fields: This chart works best when you have at least two grouping fields. You can go even further and add a third grouping to see an even more detailed mapping of your data flow.
- Simple configuration: The configuration for the Sankey Chart is as simple as any other chart type in Analytics.
Business scenarios:
Imagine you’re a sales manager trying to get a better handle on your team’s performance and your company’s pipeline. You want to understand not just how many deals are coming in, but also which sources are contributing the most value—and how those deals are progressing through different sales stages.
Let’s say you want to understand which lead sources are driving the most deal activity and how those deals progress through the pipeline. You can create a Sankey chart that maps the count of deals from Lead Source to Stage.

After analyzing the chart, you might notice that Online Store brings in a high volume of early-stage deals, while sources like External Referral contribute fewer deals that are more likely to reach advanced stages like Proposal or Negotiation.
This insight helps you prioritize nurturing the most profitable channels.
Sankey charts can also be helpful in other operational scenarios where understanding transitions across stages or teams is essential:
- Regional revenue distribution: Visualize how revenue flows across different regions, product categories, and their corresponding annual revenue. This helps you compare which regions contribute the most to each product line and where your high-value segments lie.
- Ticket handling flow: Visualize the flow of support tickets from their origin channel to internal departments and finally to resolution statuses. This can reveal workload imbalances or common points of delay in your support process.
Cluster
A cluster chart is similar to stacked column charts, but instead of stacking horizontally, the data is represented as vertical bars. As you create a column chart with multiple groupings, you can change the type of column chart to a cluster chart to achieve this representation.

In the above image, you can see the stacked column chart compares the number of lead conversions based on popular sources between countries. The stacks appearing on top of existing stacks ask you to calibrate the record count (y-axis) based on the previous stacks, which can lead to inaccurate interpretations. In this case, a cluster representation will paint a clearer picture of the analyses.
Other minor enhancements:
In addition to the three charts we mentioned above, we've also made the following minor changes:
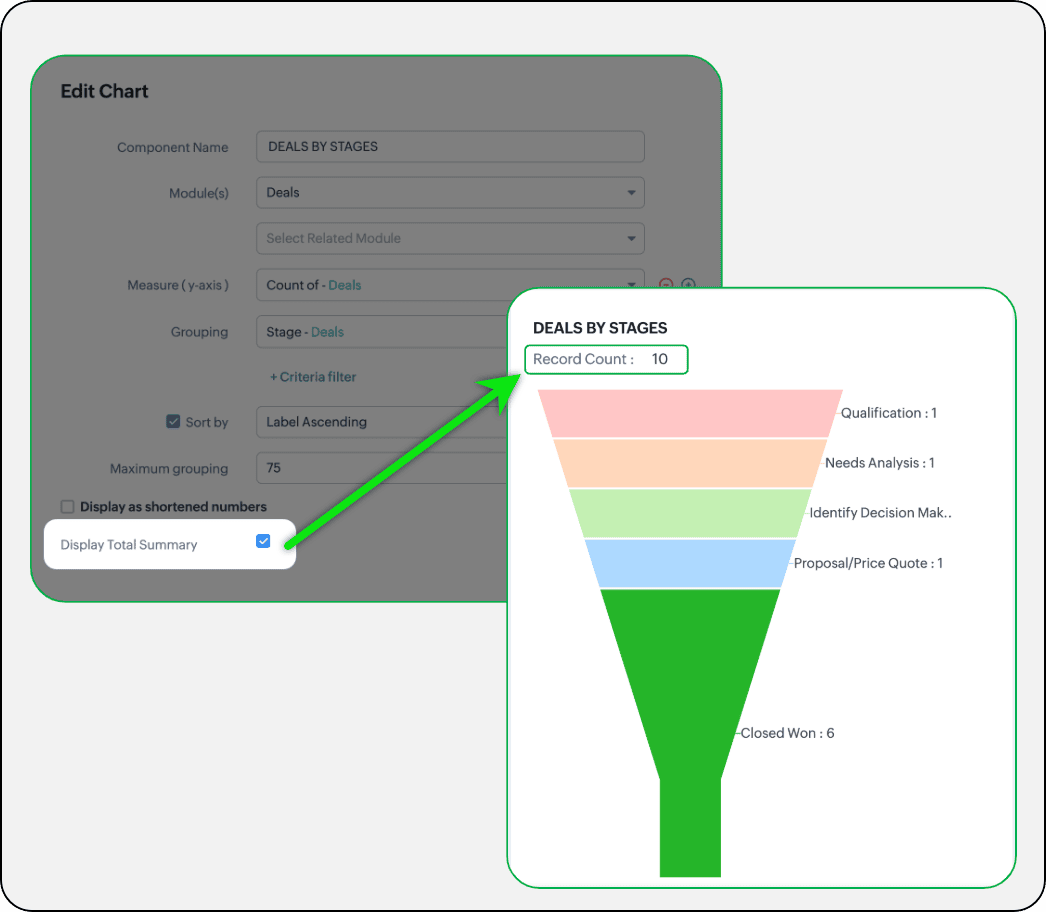
- Display total summary: Thus far, for all charts, each participating measure included labels. Now, to better understand overall contributions, a check box to display the total summary is provided under More options on the Chart Configuration page. Based on the configuration, the total revenue or the rolled-up quantities will be prominently displayed.
- Merge Y-axis: For charts that use two y-axis measurements, the intention is to view the progression of one entity against these two measures. Despite the scale, if the y-axis on the left is disproportionate to the values of the y-axis on the right, the plotted graph will result in a graphically and logically incorrect representation.
As you can see in the image below, the plot area of the sum of amount bar and the sum of expected revenue aligns close together, while, the difference between $700,000 and $40,500 is drastic, creating inaccurate interpretations.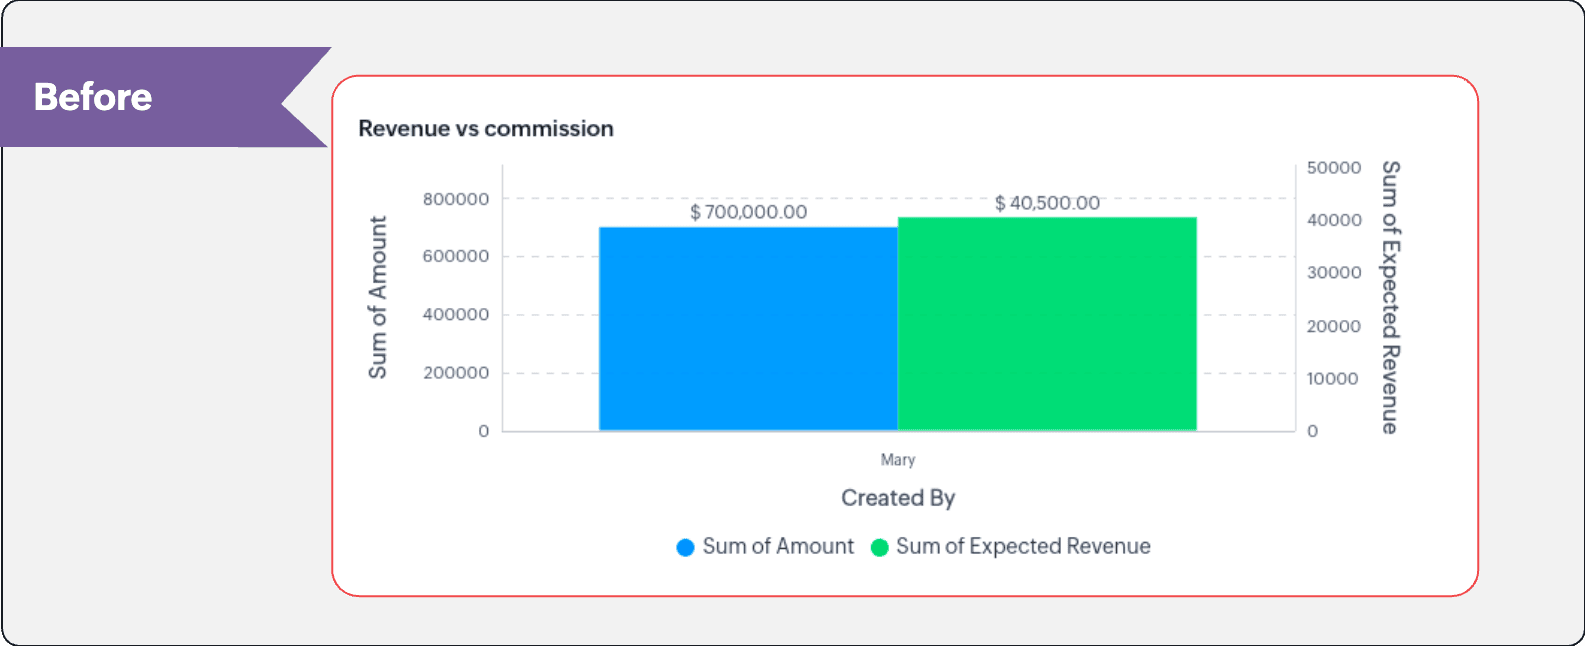
In this enhancement, we're allowing neighboring values of measures to merge so that the interpretation can be more visually accurate.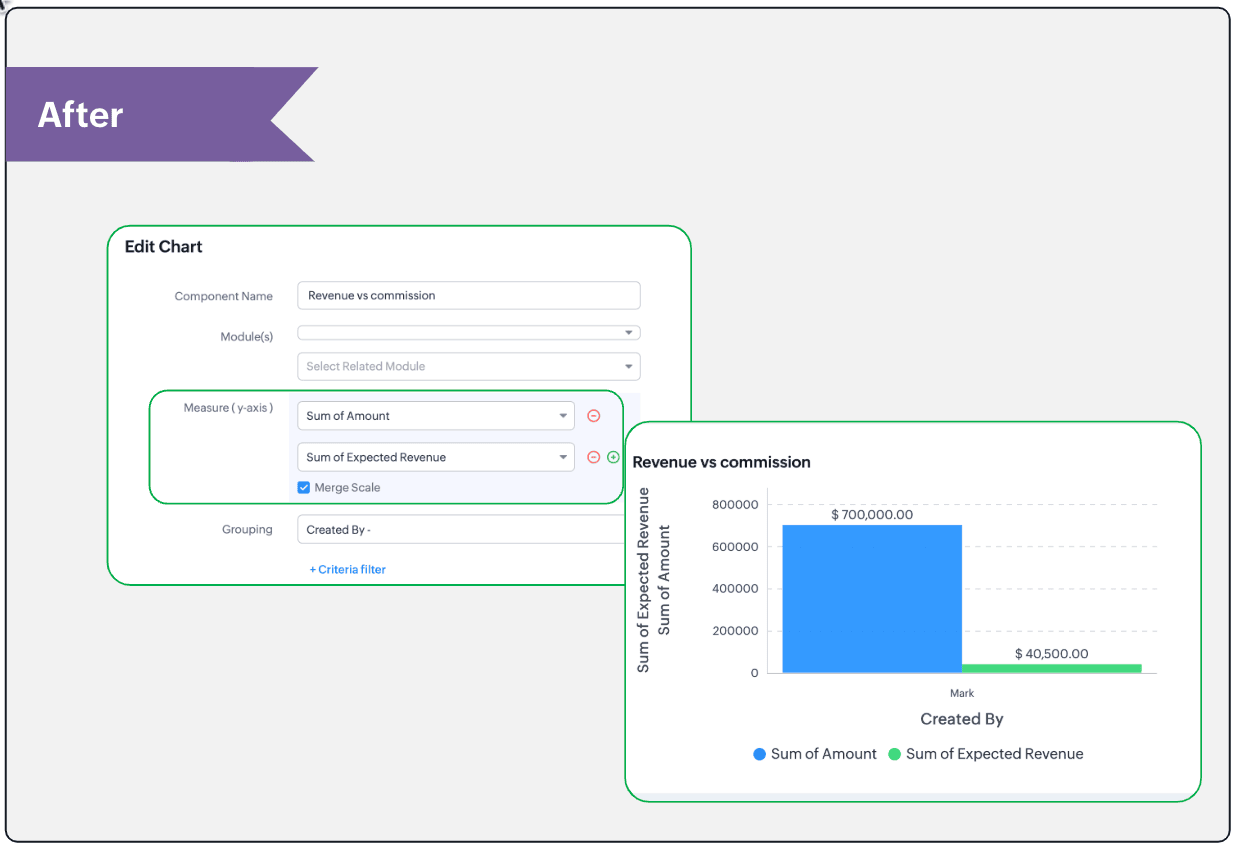
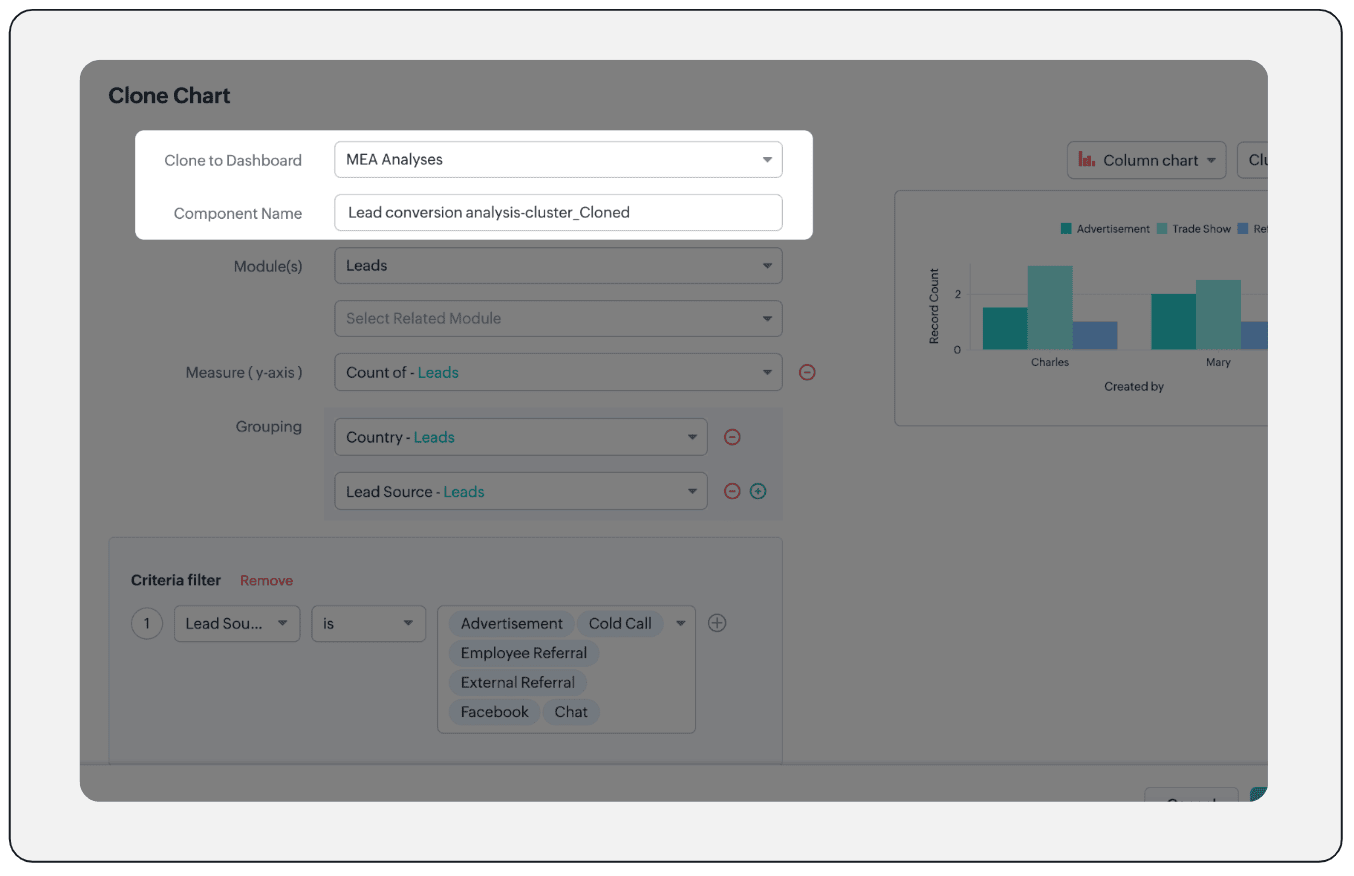
- Clone components to a different dashboard: Dashboards in Analytics serve in unique ways for various audiences—there can be separate dashboards for the sales team, marketing team, engineering team, and so on, and the chances of using the same measure for reference is common. Thus, when you clone a chart, you can now determine the target dashboard in which the cloned chart can be placed.
Resource: Help document
Thanks and have a good one!
Kind regards,
Saranya Balasubramanian
Saranya Balasubramanian
Topic Participants
Saranya Balasubramanian
Sticky Posts
Presenting ABM for Zoho CRM: Expand and retain your customers with precision
Picture this scenario: You're a growing SaaS company ready to launch a powerful business suite, and are looking to gain traction and momentum. But as a business with a tight budget, you know acquiring new customers is slow, expensive, and often deliversGood news! Calendar in Zoho CRM gets a face lift
Dear Customers, We are delighted to unveil the revamped calendar UI in Zoho CRM. With a complete visual overhaul aligned with CRM for Everyone, the calendar now offers a more intuitive and flexible scheduling experience. What’s new? Distinguish activitiesCreate and populate a record in an instant: Introducing zero-shot field prompting to Zia's ICR
A couple of months ago, we upgraded our in-house AI image detection and validation tool, Zia Vision, with intelligent character recognition (ICR). By training Zia with sample images, you could create and enrich CRM records with data extracted from standardIn-person ZUG Meetups for Real Estate Professionals - US Q1 2026
The Real Estate Zoho User Group is going on a multi-city, in-person meetup tour across the US, and we’d love to see you there! These meetups are a great opportunity to: Connect with fellow real estate professionals using Zoho Share challenges and discoverNimble enhancements to WhatsApp for Business integration in Zoho CRM: Enjoy context and clarity in business messaging
Dear Customers, We hope you're well! WhatsApp for business is a renowned business messaging platform that takes your business closer to your customers; it gives your business the power of personalized outreach. Using the WhatsApp for Business integration
Nederlandse Hulpbronnen
Recent Topics
Can I execute two 'functions' when completing a mail merge from CRM?
Hi, I have set up a mail merge from CRM Deals to a template. I want a copy of this to be saved in Workdrive, and then a copy also saved back into the deal record from which the merge occurred. I can do both independent of each other, and managed to getExternal Share > Edit: Cannot Create Zoho Files
Hi Zoho, When we create an external share link with Edit permission, our external users are unable to create a Zoho file (Zoho Writer, Zoho Sheet and Zoho Show). They can only upload files. They can edit the Zoho files if we create them internally andUsing IMAP configuration for shared email inboxes
Our customer service team utilizes shared email boxes to allow multiple people to view and handle incoming customer requests. For example, the customer sends an email to info@xxxx.com and multiple people can view it and handle the request. How can I configurethe custom domain forwards by default to the old career site / how to switch it off??
dear friends, how to switch off the old version of the career site?? The set up custom domain forwards directly to the old site, so that I cant publish it... Any ideas? Thank you! KR, VictoriaZoho learn Custom portal - networkurl & CustomPortalId
I want to get my individual account’s networkurl and customportalId to use in this API: https://learn.zoho.com/learn/api/v1/portal/<networkurl>/customportal/<customportalId>/manual How can I retrieve the networkurl and customportalId using the API? IZoho Mail iOS app update - RTL languages support and access emails using permalink and universal link, image upload resolution
Hello everyone! In the most recent version of the Zoho Mail iOS app update, we have brought in support for RTL languages(Arabic and Urudu), providing a seamless reading experience with proper text alignment and layout throughout the app. We have alsoPresenting ABM for Zoho CRM: Expand and retain your customers with precision
Picture this scenario: You're a growing SaaS company ready to launch a powerful business suite, and are looking to gain traction and momentum. But as a business with a tight budget, you know acquiring new customers is slow, expensive, and often deliversWhy are emails sending with @viazohocrm.com ?
I just sent out mass emails from CRM. They are sending from the email below and people cannot reply, and they are getting this message: Address not found Your message wasn't delivered to sales.XXXXXXXX.com.au@viazohocrm.com because the address couldn'tDuplicating and referencing datasets
I am moving from PowerBI to Zoho Analytics and while I find Zoho easier to use in many ways, there is one function that I use in PowerBI that I have not been able to find in Zoho. I have several data sets that I need to modify in different ways to getFrom Zoho CRM to Paper : Design & Print Data Directly using Canvas Print View
Hello Everyone, We are excited to announce a new addition to your Canvas in Zoho CRM - Print View. Canvas print view helps you transform your custom CRM layouts into print-ready documents, so you can bring your digital data to the physical world withZoho Inventory Now Supports VeriFactu for Businesses in Spain
Starting from January 1, 2026, Spain requires real-time invoice reporting for all B2B transactions. From July 2026, this requirement will extend to B2C transactions as well. All reporting must be carried out through the VeriFactu to AEAT (Agencia EstatalConditional Email Forwarding
How can I set conditional email forwarding of the users? For example: Mail should be forwarded to a address only if it comes from a particular sender. So, I want such email forwarding, which forwards mails based on particular conditions, like the incomingWhy am I seeing deleted records in Zoho Analytics syncing with Zoho CRM?
I have done a data sync between Zoho CRM and Zoho Analytics, and the recycle bin is empty. Why do I see deleted leads/deals/contacts in Zoho Analytics if it doesn't exist in Zoho CRM? How can I solve this problem? ThanksEnhancements to Zoho Map integration tasks
Hello everyone, We're excited to announce enhancements to the Zoho Map integration tasks in Deluge, which will boost its performance. This post will walk you through the upcoming changes, explain why we're making them, and detail the steps you need toLet’s Talk Recruit: Meet Zia, your all-in-one AI assistant (Part-3)
Welcome back to the Let’s Talk Recruit series. In the part 2 post, we explored how Zia has evolved with smarter summaries and seamless AI-assisted content creation. This time, we’re diving into the latest upgrades that take productivity even further —Announcing Early Access to "Zoho CRM for Everyone" — A new and exciting update to Zoho CRM
Update : Zoho CRM For Everyone's Nextgen Interface gets an upgrade! Hello everyone, We’ve updated the Zoho CRM for Everyone Nextgen interface based on your feedback. The UI is now simpler with a unified sidebar, a more visible global search and featuresProblem with signature on zoho survey
Hello, I'm trying to export individual responses with signatures on zoho survey. But the signatures on some of my surveys are not exported as the original image, but as a generic image, same for all (screen joins). Is there a solution to have the signaturesUnable to verify domain for Zoho People
I have added TXT records in my DNS (GoDaddy) [screenshot attached], but unable to verify even after 12 hours after adding. On checking the console, it shows some errors [screenshot attached]. It appears that the verification flow is broken - please provideZoho Invoice Now Supports VeriFactu for Businesses in Spain
Starting from January 1, 2026, Spain requires real-time invoice reporting for all B2B transactions. From July 2026, this requirement will extend to B2C transactions as well. All reporting must be carried out through the VeriFactu to AEAT (Agencia EstatalZoho Billing Now Supports VeriFactu for Businesses in Spain
Starting from January 1, 2026, Spain requires real-time invoice reporting for all B2B transactions. From July 2026, this requirement will extend to B2C transactions as well. All reporting must be carried out through the VeriFactu to AEAT (Agencia EstatalWeekly Tips : Make your email content error free with Spell check in Zoho Mail
As someone who writes multiple emails a day, we are bound to make both grammatical and spelling errors. Most of them we may not even notice, and even if we do, we may not have the time to correct each one individually when we are in a hurry. So how doIntroducing Enhanced Storage Management
We’re excited to roll out two new enhancements in Zoho Recruit, Subscription Information and Storage Management — designed to give admins complete visibility into subscription details, feature limits, and storage consumption — all from one place insidehow to download all my files
We are in the middle of zoho docs to zoho workdrive migration. I can not access my zoho docs page. I get redirected immediately to a zoho workdrive page. I would like to download all my files so that I have a backup in case something goes wrong with theConvert Zoho Books SalesOrder - Invoice
Converting a Zoho Books Sales Order into an Invoice Using the SalesOrder Convert API Hello Zoho Developers, Today, we are sharing a simple and effective solution to convert a Zoho Books Sales Order into a Zoho Books Invoice using the SalesOrder ConvertZoho Expense - Report Templates
Hi Expense Team, I do a recurring trip once every week which has the same cost: Per diem Milage Toll Payment It would be great if there was a feature which allowed me to clone a previously submitted report or create a template reports. This would saveHow to add tabular data when execute Add Record API
Hi everyone! I was send api updateRecord follow by this request url : https://people.zoho.com/people/api/forms/json/<formLinkName>/updateRecord with parameters "inputData", "tabularData", "recordId". Ex picture below And response success: But. When ITip #51- Centralized Contact Management for Better Remote Support- 'Insider Insights'
For our final topic of November, we’re diving into one of the most helpful features in Zoho Assist, the Contacts section on Zoho Assist;s dashboard. Whether you’re managing multiple clients, tracking past sessions, or simply looking to streamline yourUsing gift vouchers
We would like to be able to offer a limited number of gift vouchers, of varying values, to our customers, and are looking for the best way to do this. We have looked at Coupons and Gift Certificates, but neither seem to fit the bill perfectly. Coupons:Option to Customize Career Site URL Without “/jobs/Careers”
Dear Zoho Recruit Team, I hope you are doing well. We would like to request an enhancement to the Career Site URL structure in Zoho Recruit. In the old version of the career site, our URL was simply: 👉 https://jobs.domain.com However, after moving toSay Hello to Telephony in Zoho FSM
Zoho FSM now brings complete telephony support so your team can manage inbound and outbound calls without switching tabs. Faster responses, smarter routing, and total call visibility—all in one place. Choose the telephony setup that works for you Zoho’sZoho Sign - Zoho CRM extension upgrade
Hi everyone, We've updated Zoho Sign extension for Zoho CRM with significant internal changes. Impact on existing Zoho Sign extension users Users using the extension without customization If you are using the integration without implementing Zoho Sign'sSent mail sort by date disappeared
Hello, We used to be able to sort the emails by date in the sent folder, but this feature has recently disappeared. Can we bring it back?E-Invoicing in Belgium with Zoho Inventory
Starting January 1, 2026, Belgium is introducing mandatory electronic invoices (e-invoicing) for all B2B transactions between VAT-registered businesses. Invoices and credits notes must be exchanged in a prescribed digital format. How E-Invoicing WorksEmployee ID is not correct in get records api V2 for leave
Hi Team, We are facing an issue when calling the Get Records API V2. The employee.id returned in the response is not the actual employee record ID in Zoho People. As a result, our integration is forced to make an additional Get Record API call for everyFormatting Mailing Labels
I want to use the "Print Mailing Labels" function on the drop down list, but I am not seeing a way to change the formatting on the mailing labels. At the moment, the information that appears on the mailing labels ARE NOT mailing addresses, but randomZoho People. Updating TabularData
I am trying to update tabular data in the record. I always have the same response. I have checked many times. Section ID is correct. May be something wrong with request structure itself. Can someone help me. Body content type: form urlencoded query paramsCanvas View - Print
What is the best way to accomplish a print to PDF of the canvas view? Latest update (27th November 2025): We are excited to announce that the Canvas Print View is now available! We encourage you all to try it out and share your feedback with us. LearnNew to automation - please help
Hi there! We are new to automations in Zoho. We built out one automation campaign and it seems to be firing off for some people but others not. Please advise what's the best practice or if anything we should tweak. Thank you so much!E-Invoicing in Belgium with Zoho Billing
Starting January 1, 2026, Belgium is introducing mandatory electronic invoices (e-invoicing) for all B2B transactions between VAT-registered businesses. Invoices and credits notes must be exchanged in a prescribed digital format. How E-Invoicing worksZia Conversation Summary: Context at a glance for every customer interaction
Hello everyone! Every customer conversation tells a story—but in CRM, that story is rarely in one place. A sales rep moving between multiple leads has to reopen long email threads, check call remarks, and revisit meeting notes just to remember what wasNext Page
