How to display historical ticket information of the total time spent in each status
Hi All,
Hoping someone can help me, as I am new to Zoho Analytics, and I am a little stuck.
I am looking to create a bar chart that looks back over tickets raised in the previous month and displays how much time was spent in each status (With Customer, With Support, With Engineering). I want to do this primarily so I can graph over time if the time with engineering is going down.
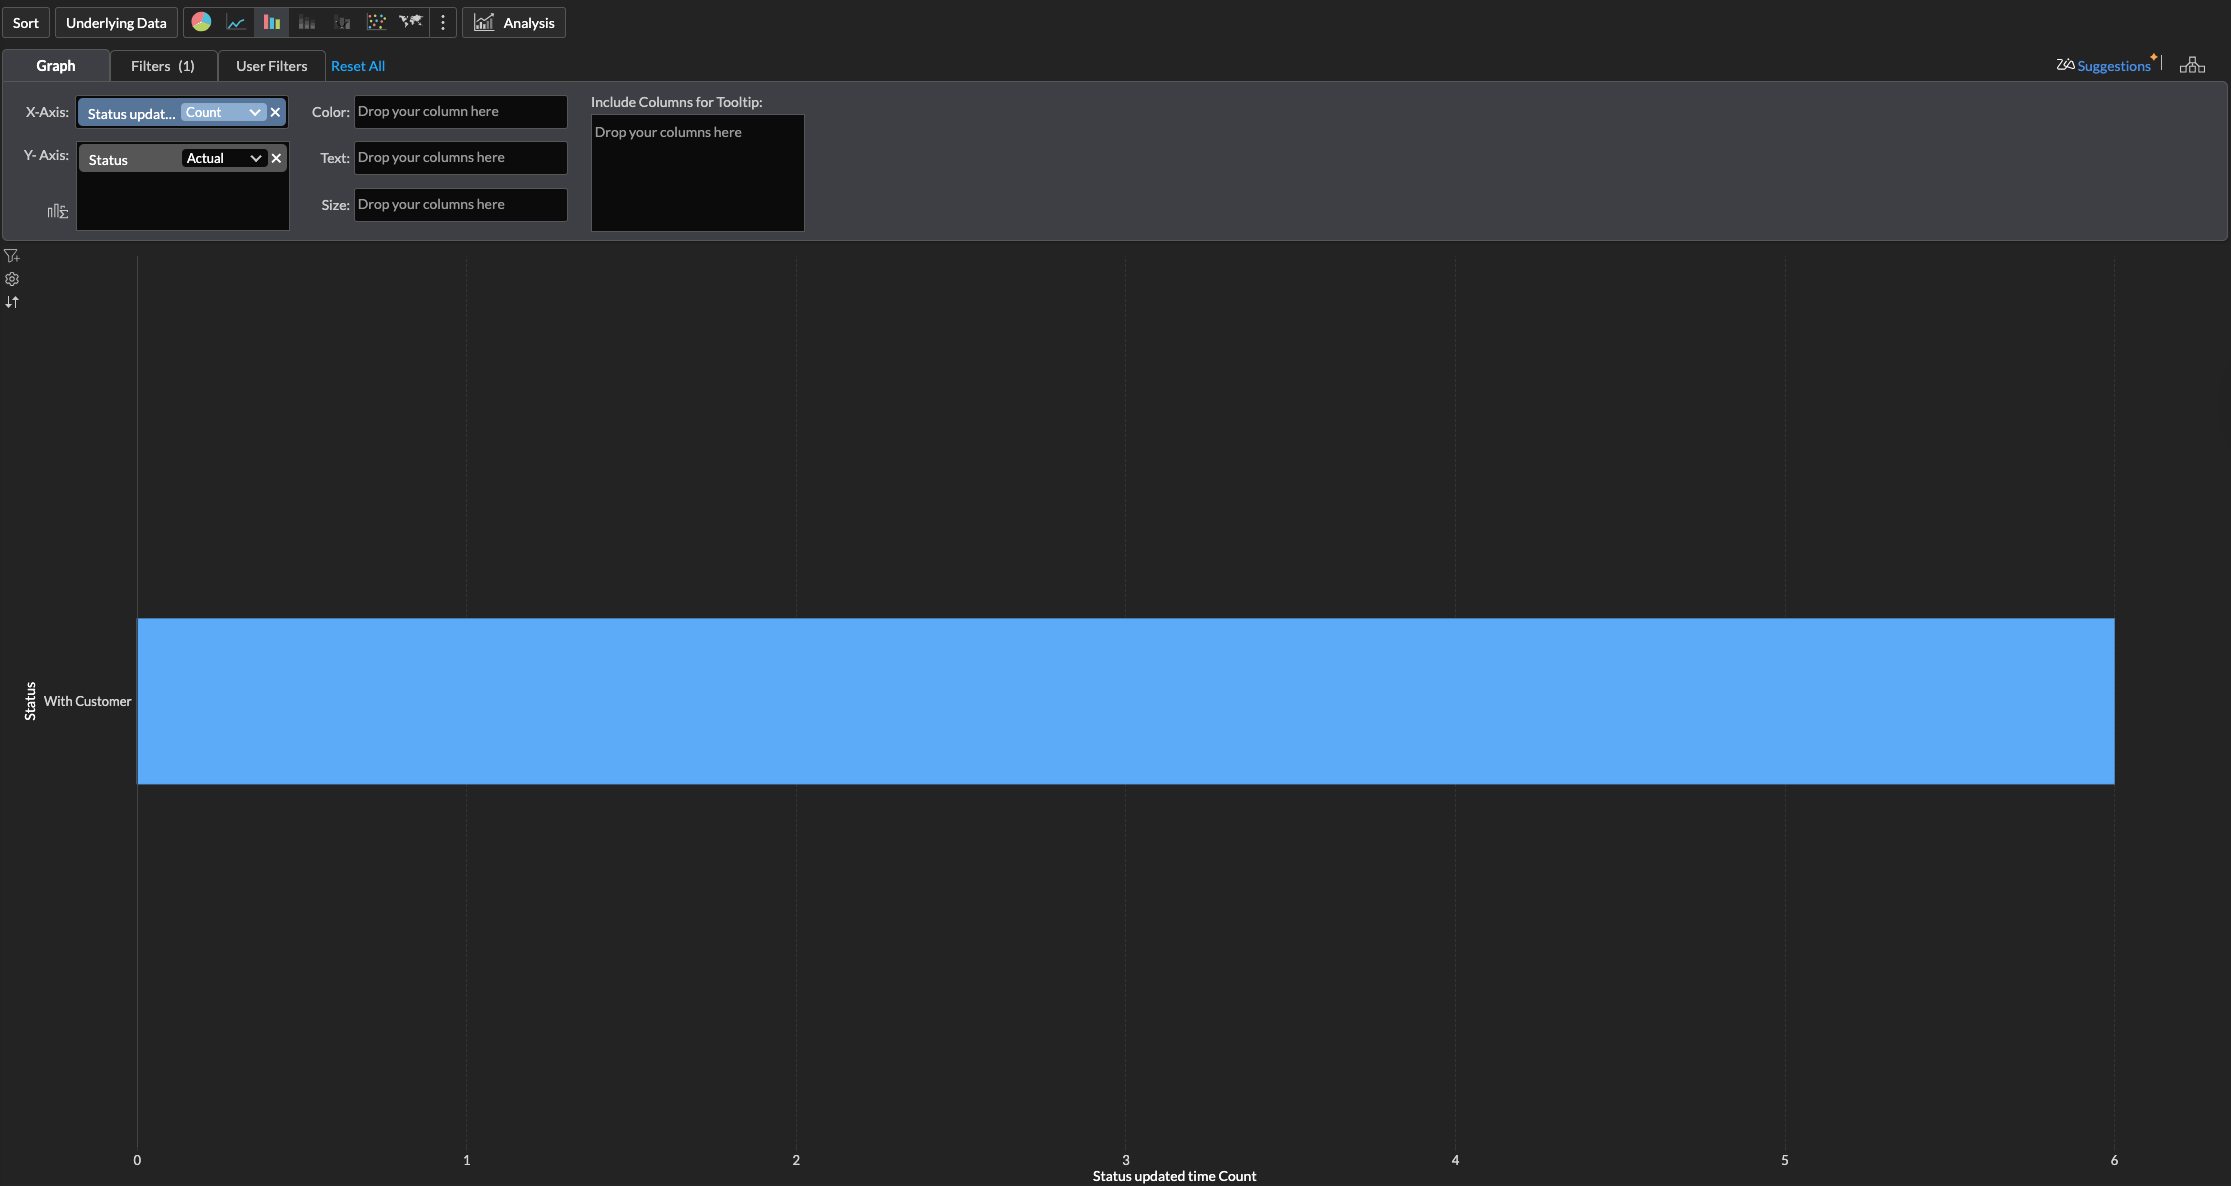
The graph I am looking to produce is one with time on the X axis and Status on the Y axis.
Example: If I had 5 tickets in August, with each spending 0.5 hours in With Customer, one hour in With Support, and 2 hours in With Engineering, the graph would display a bar chart showing:
With Support = 5 Hours
With Customer = 2.5 Hours
With Engineering = 10 hours
Unfortunately, I only seem to be able to get data for tickets that are currently open and not ones that have been open historically. Does anyone know how I can go about doing this???
This is my current graph and parameters.
Topic Participants
Matthew Torr
Naresh Kumar K K R
Sticky Posts
What's New in Zoho Analytics - January 2026
Hello Users! We are starting the year with a strong lineup of updates, marking the beginning of many improvements planned to enhance your analytics experience. Explore the latest improvements built to boost performance, simplify analysis, and help youWhat's New in Zoho Analytics - November 2025
We're thrilled to announce a significant update focused on expanding your data connectivity, enhancing visualization capabilities, and delivering a more powerful, intuitive, and performant analytics experience. Here’s a look at what’s new. Explore What'sWhat's New in Zoho Analytics - October 2025
Hello Users! We're are back with a fresh set of updates and enhancements to make data analysis faster and more insightful. Take a quick look at what’s new and see how these updates can power up your reports and dashboards. Explore What's New! ExtremeWhat’s New in Zoho Analytics – September 2025
Hello Users!! In this month’s update, we’re raising the bar across multiple touchpoints, from how you bring in data, plan and track projects to how you design and brand your dashboards. We’ve added the all-new Gantt chart for project visualization, expandedAnnouncing Agentic AI - Ask Zia!
We are delighted to roll out the new agentic AI capabilities in Ask Zia, where every stage of the BI workflow is assisted by AI. With a human-in-the-loop approach, Ask Zia ensures that you’re in command of the decision, while AI handles the complexity.
Recent Topics
Interview booked through Invite but no Notifications
We have a workflow that was developed through a developer/partner that was tested and worked. Today, we pushed a candidate through the process and invited them to an in-office interview. They were sent the booking link (as usual and as tested before successfully)WebDAV support
I need WebDAV support so that I can upload/download (and modify) documents from my local file system. Is anything planned in his direction?Automatiser la gestion des SLA dans Zoho Desk avec Zoho Contracts
Les équipes du service client s’efforcent d’assurer un support rapide, régulier et fiable pour garantir la satisfaction de chaque client. Les accords de niveau de service (SLA) permettent de clarifier les engagements en définissant les termes et conditionsiOS App doesn't refresh for Document Creation
Hello Zoho team, I have created a workflow to be used on a mobile iOS device which starts in Zoho Creater and ends with a murge and store function that then opens the newly created document within the Zoho Writer app. This process is working great howeverUploading a signed template from Sign to Creator
Good day, Please help me on how to load a signed document back into Creator after the process has been completed in Sign. Below is the code that I am trying, pdfFile = response.toFile("SignedDocument_4901354000000372029.pdf"); info pdfFile; // AttachZoho DataPrep and File Pattern configuration
I'm using Zoho data prep to ingest data from One Drive into Zoho Analytics... The pipeline is super simple but I can't any way to get all the files that I need. Basically I need to bring all the files with a certain pattern and for that I'm using a regexAssistance needed: Activation of a domain
Hello Zoho Support, I purchased the .com domain "primesolva.com" via Zoho 6 days ago. The domain is still pending, and I cannot access the DNS panel to add the TXT verification for domain ownership. Please confirm the registration status and help me activateOperation not permitted
I am trying to add an email address to the list of user but I am getting error Operation not permittedRequest to Permanently Delete Email User (info@mehbobgulf.com ) from Old Organization
Please permanently delete the user email info@mehbobgulf.com It is still associated with my old Zoho organization. I cannot delete it because it shows ‘You cannot delete email. Zoho host’. I need to use this email in a new Zoho account.”Client host [89.36.170.5] blocked using Spamhaus
Hello please make make actions for delist ..... "Client host [89.36.170.5] blocked using Spamhaus"Suggestion: Option to Re-run a migration
As I'm going through a migration process, I like the IMAP migration tool, but it would be better if there were an option to re-run the same migration as configured. There's not even an option to copy/edit one that's already there. Just run if it hasn'tIssue with "Add Your Mobile Number"
Hello, I am trying to sign up for email service for a domain name, and I cannot finish the authentication. When I enter my mobile number, I receive the message "We’re unable to send OTP to this mobile number. Please contact support-as@zohocorp.com". Izoho mail non vérifié
Bonjour, Il y'a un jour que j'ai acheté un domaine et toute les tentatives pour l'associé a mon compte shopify son vaine. j'ai essayé TXT sans suite après, j'ai essayer avec CNAME sans suite. j'aurais besoin de votre assistance pour associé mon mail.Unable to send message;Reason:553 Relaying disallowed. Invalid Domain
i have facing the issue "Unable to send message;Reason:553 Relaying disallowed. Invalid Domain" if i verify domain evertthing i did but still face the same error.ZohoMail is so close to being Perfect BUT
Why don’t you have HILIGHTING???!! I've been trying to find a substitute for Edison Mail but I want & need hilighting (preferably in more than just yellow)! Is this even on your To Do list? I’m so disappointed. 🙄Override Auto Number field?
We are preparing to migrate from Salesforce. In Salesforce, we auto-generate a unique number on our Opportunities (Potentials). If the Opportunity results in a contract, we use that unique number as the Contract number. There are some situations whereUsing a third party service provider want to move directly with Zoho
Hi good day I’m currently using Zoho but I’m using a third party service provider I want to move directly with you guys I’m using Zoho email and invoices and my domain please let me know if it’s possible to move away from the third party provider my emailRequest for Assistance Regarding Email Sending Issue (554 5.1.8 - Email Outgoing Blocked)
Dear Zoho Support Team, I hope this message finds you well. I am writing to request assistance with an issue we are currently facing regarding our Zoho Mail account. Our email account, admin@tuyensinhcanuoc.com, is encountering the following error whenZoho Mail API returns empty inbox (0 messages) but webmail shows 37 unread emails
Hello, I'm experiencing a discrepancy between Zoho Webmail and the Mail API (EU region). **Setup:** - Account: EU datacenter (mail.zoho.eu) - API: Self Client OAuth2 via api-console.zoho.eu - Scopes: ZohoMail.messages.READ, ZohoMail.messages.UPDATE, ZohoMail.folders.READ,Zoho Mail not working
Zoho Mail not workingShipStation and Zoho Inventory
Hello, I am looking to sync zoho inventory with shipstation ZOHO INVENTORY SHIP STATION Sales Order ==> create ORDERS INVOICE <== Shipments What exactly does BETA mean on the Shipstation connector? This is required for me to sign-on in the next month. Thanks in advance for your efforts550 5.4.6 Unusual sending activity detected. Please try after sometime
Hi, I am receiving this error message when trying to send my emails. The only reason I can think why this is happening is my previous two emails were bounced back to me due to a non working mailbox error. I have followed the online links for unblocking but it says there are no blocks on my account. How and when can I get my email working again to send emails? Thanks,E
We are trying to add our Zoho Form embed in our Elementor Page Builder. After adding Zoho Forms widget in elementor page builder it’s displaying in backend page builder but it’s giving 403 error while trying to save, as it’s not reflecting in front end.Formatting Problem | Export to Zoho Sheet View
When I export data to Zoho Sheet View, ID columns are automatically formatted as scientific notation. Reformatting them to text changes the actual ID values. For example, 6557000335603071 becomes 6557000335603070. I have attached screenshots showing thisConnecting Zoho Inventory to ShipStation
we are looking for someone to help connect via API shipStation with Zoho inventory. Any ideas? Thanks. Uricustom module import.
Is there a way to import data into a custom module? Thanks RudyHEIC File Type Viewer
Hi, It would be nice to be able to click on the images in the All Entries/Reports Tables which are HEIC the same as JPG, PNG, etc. so they open in a viewer from Zoho or the Attachment Service, today HEIC requires you to download each image and open itBuilding Toppings #4 - Setting up and using connections in Bigin toppings
When building a topping to extend Bigin's functionality and connect it with third-party applications, creating and handling connections is an important step. Connections provide a secure way for your topping to authenticate and communicate with otherNeed code format to specify default values
Can someone please direct me to the code syntax or the proper translation per the instructions circled below. These instructions don't seem correct.AI Interview Insights: Turn Recorded Interviews into Quick Transcripts & Summaries
Evaluating interviews shouldn’t require replaying long recordings or taking manual notes. With AI Interview Insights, you can now review complete transcripts and AI-generated summaries of your One-way (Recorded) interviews right inside Zoho Recruit. ThisFacing email delivery issues? Verify your domain's DNS records
Have you ever wondered why your legitimate emails are landing in the recipient’s spam folder? Or been surprised to see emails sent from your registered domain getting rejected by recipient email servers? Why does this happen? In most cases, this happensOrder of Departments in Help Desk
In the end user portal, , the departments are sorted by the date of creation of the department (or perhaps their id). Is there a way to choose the display order of the departments or at least to be able to sort them alphabetically?COGS - Account showing negetive
I have multiple COGS account and in these all there is one account is negetive so suggest why it is showing negetive value.?Create CRM Deal from Books Quote and Auto Update Deal Stage
I want to set up an automation where, whenever a Quote is created in Zoho Books, a Deal is automatically created in Zoho CRM with the Quote amount, customer details, and some custom fields from Zoho Books. Additionally, when the Sales Order is converted%PaymentLink%
Does not work. Software creates a BAD link. ....and yes payment options are turned on. Link on the invoice pdf once opened will work but this template is a joke.Google Photos
I am hoping that my question already has a fix. I current have Google synced accounts that I want to get away from. One in particular on is Google photos. Is there any software, or 3rd parties that I can join to back my photos up straight to specifically designated file in the ZOHO cloud that's tied to Docs? Please advise... MikeZoho Books Items Categorisation/Grouping/Folder
Is there a way to do items categorisation? a folder structure? Product Type A - Option 1/2/3 Product Type B - Option 1/2/3 Current problem : I have more than 50 items on the list, its hard for team to navigate.Cash payments before invoice date
We have been using zoho books for our hospitality business for some time and have been very happy with the system. However in 2025 an update was pushed through and we are now not able to record payments for invoices before the invoice date. the case scenarioCopy / Duplicate Workflow
I have workflows setup that are very similar to each other. We have a monitoring system watching servers, and all notifications - no matter what client it is about - will come from a noreply@ address which is not very helpful in having it auto assigned to the right account. I have setup a workflow that will change the contact name of the ticket (currently it would say noreply@) to the correct customer which is based on the subject line, as that mentions which server the alert it is about. I needTransfer between two customers (Peters Rental account to Peters Private account)
we are a Property Management company. Our customers have to accounts (registered as two customers - Peter Rental and Peter Private On the rental account all income and costs fron rental activities are noted. On the private account all private are notedNext Page