Visualize your data with a new set of charts: Treemap, Butterfly, Sankey, and Cluster charts in Zoho CRM
Dear customers,
When it comes to analytics, it's not just about the numbers; it's about understanding the story behind them.
With that philosophy in mind, we’re excited to introduce a line of representations to the existing array of chart types in Zoho CRM: Treemap, butterfly, sankey and cluster charts. Let's go!
Treemaps
Treemap charts are used to visually represent hierarchical datasets in a rectangular layout. It aligns its parent categories as larger tiles with their sub-categories nested within them. The size of each tile is proportional to its corresponding value, making it easy to compare different segments within the hierarchy.
This is how a treemap chart looks:

These structured data representations help you understand overall performance and contributions, as well as compare participating entities at a glance.
Unlike traditional bar charts or pie charts, treemaps can be used if your datasets are large and exhibit parent-child relationships.
Here are some examples to better understand their usage:
Comparing revenue distribution between functions
A company's revenue is distributed among its functions before it gets further disbursed to its employees. Treemap charts can be used to depict this distribution and compare it between functions. As you can see below, the hierarchy can be represented as a treemap to compare it directly with other functions:

The hierarchy at the top shows just the numbers and levels, but the treemap chart represents the numbers proportionally, allowing leaders to visualize the difference in distribution.
Interpretation: As you can easily see in the treemap, sales and marketing receive the same amount of revenue, while engineering is given significantly more than the other two.
Likewise, with treemap charts, you can:
- Compare popular lead sources with lead counts is the measure and lead source being the participating entity—a classic single-grouping configuration.
- View cost savings achieved across departments. With the departments as the grouping parameters and the cost saved as the measured amount, the chart lays out all the departments as tiles in proportion, based on money saved.
- Compare ad spends across channels, where channels are the parent grouping and ad spend is the measured unit.
Butterfly
Butterfly charts are used to compare two related datasets side-by-side, resulting in a representation that looks like a butterfly or tornado.
Now, how does it differ from bar charts?
The standard bar chart can compare two entities for a given measure. Say, you are comparing the performance of Mary and Charles. The two users' data is represented using bars, and the length will denote their performances. But, when it comes to comparing their performances over a period or their contribution across different stages, a bar chart is not sufficient.


With butterfly charts, you can:
- Compare revenue between two of your branches each month. With branches being compared for sum of sales revenue, grouped by closing date.
- Compare the performance of two reps in a given quarter. Compared between two users for average of amount of deals, grouped by closing date until today.
In addition to the user-based comparison above, butterfly charts are well-suited to visualizing other types of data comparisons, like:
- Picklist-based comparisons
- Duration-based comparisons
- Aggregate-based comparisons
Business scenario
Comparing the number of deals closed for each lead sources: Duration-based comparison
You can identify the productive lead source by comparing the number of deal closures for every lead source in your organization based on their closing week.

Analyzing effective sales methodology, inbound vs. outbound: Picklist-based comparison
Businesses use both inbound and outbound lead generation strategies, and each of these methods can reap different results based on the season and occasion. By comparing inbound versus outbound each month, you can identify which works best at what time.

Analyze the amount versus the expected revenue between accounts: Aggregate-based comparison
Expected revenue is a result of a deal's progression in the sales pipeline. Comparing the amount versus their expected revenue will not only help visualize the expected revenue of participating accounts but also indicate the accounts' stage in the sales pipeline.

Sankey
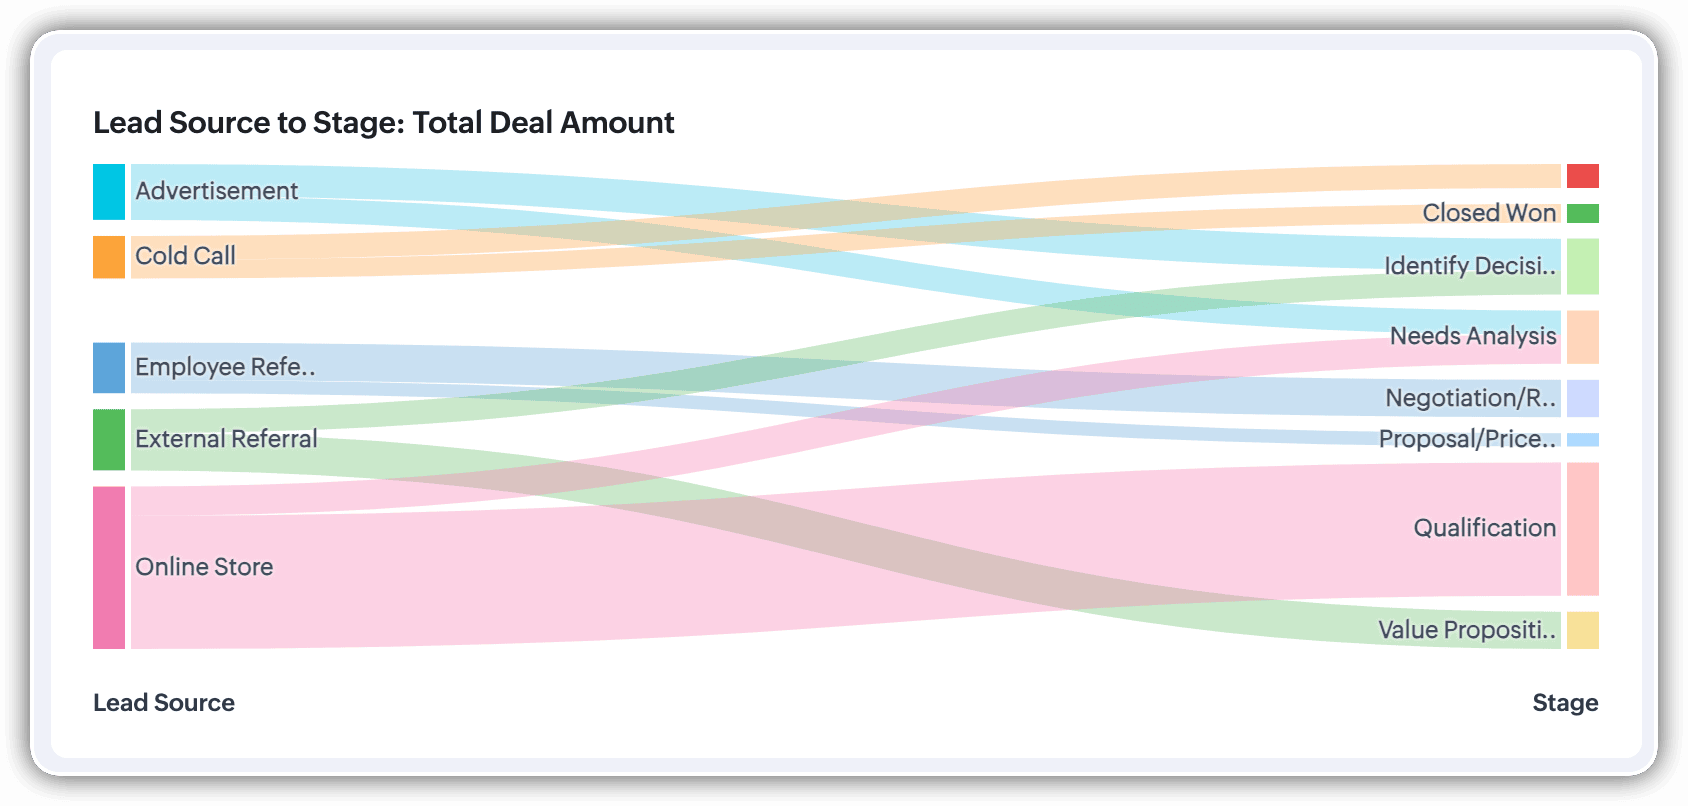
A Sankey Chart is designed to visualize the movement of data across different data groups. Unlike traditional charts—such as bar, column, pie, or donut—that mainly provide a static distribution of values, the Sankey Chart focuses on illustrating the flow between multiple segments or grouping fields. This makes it an ideal choice when you want to track how values (like lead counts, revenue, or deal statuses) move from one category to the next.

Key features
- Flow visualization: With the Sankey Chart, you can observe the movement of data between different groups.
- Multiple grouping fields: This chart works best when you have at least two grouping fields. You can go even further and add a third grouping to see an even more detailed mapping of your data flow.
- Simple configuration: The configuration for the Sankey Chart is as simple as any other chart type in Analytics.
Business scenarios:
Imagine you’re a sales manager trying to get a better handle on your team’s performance and your company’s pipeline. You want to understand not just how many deals are coming in, but also which sources are contributing the most value—and how those deals are progressing through different sales stages.
Let’s say you want to understand which lead sources are driving the most deal activity and how those deals progress through the pipeline. You can create a Sankey chart that maps the count of deals from Lead Source to Stage.

After analyzing the chart, you might notice that Online Store brings in a high volume of early-stage deals, while sources like External Referral contribute fewer deals that are more likely to reach advanced stages like Proposal or Negotiation.
This insight helps you prioritize nurturing the most profitable channels.
Sankey charts can also be helpful in other operational scenarios where understanding transitions across stages or teams is essential:
- Regional revenue distribution: Visualize how revenue flows across different regions, product categories, and their corresponding annual revenue. This helps you compare which regions contribute the most to each product line and where your high-value segments lie.
- Ticket handling flow: Visualize the flow of support tickets from their origin channel to internal departments and finally to resolution statuses. This can reveal workload imbalances or common points of delay in your support process.
Cluster
A cluster chart is similar to stacked column charts, but instead of stacking horizontally, the data is represented as vertical bars. As you create a column chart with multiple groupings, you can change the type of column chart to a cluster chart to achieve this representation.

In the above image, you can see the stacked column chart compares the number of lead conversions based on popular sources between countries. The stacks appearing on top of existing stacks ask you to calibrate the record count (y-axis) based on the previous stacks, which can lead to inaccurate interpretations. In this case, a cluster representation will paint a clearer picture of the analyses.
Other minor enhancements:
In addition to the three charts we mentioned above, we've also made the following minor changes:
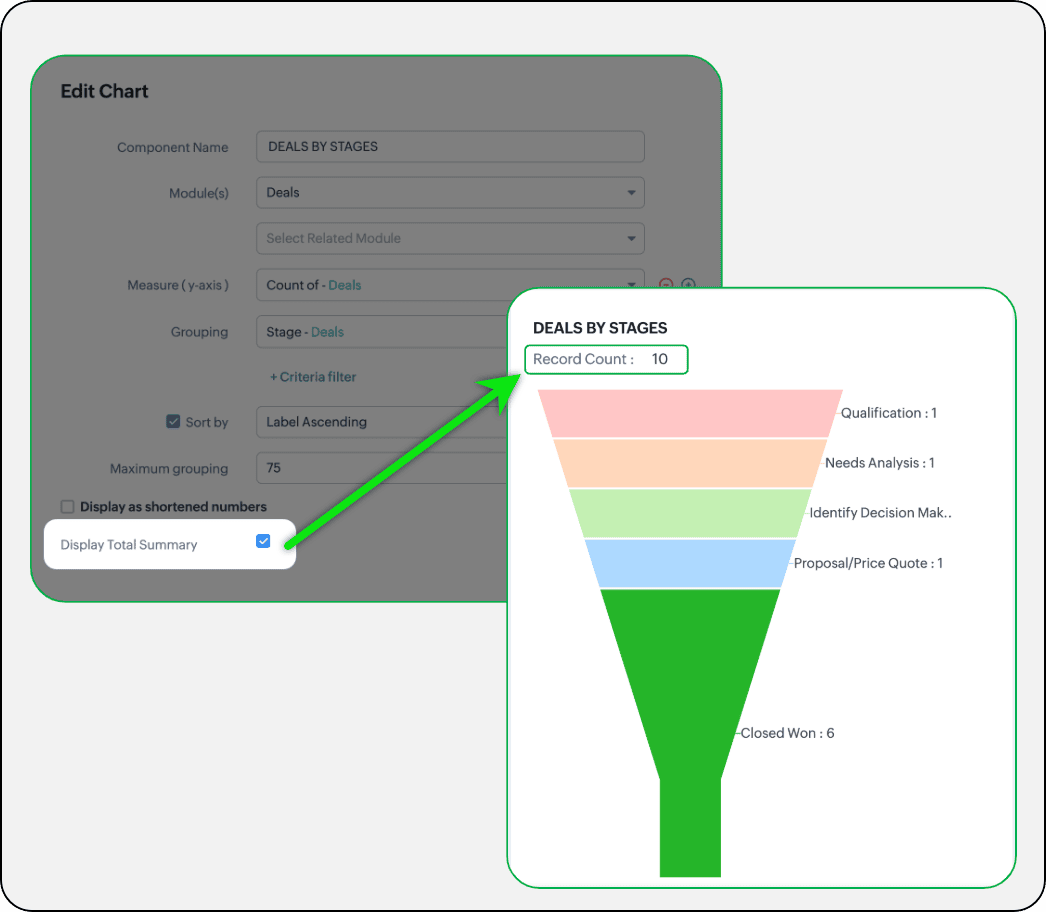
- Display total summary: Thus far, for all charts, each participating measure included labels. Now, to better understand overall contributions, a check box to display the total summary is provided under More options on the Chart Configuration page. Based on the configuration, the total revenue or the rolled-up quantities will be prominently displayed.
- Merge Y-axis: For charts that use two y-axis measurements, the intention is to view the progression of one entity against these two measures. Despite the scale, if the y-axis on the left is disproportionate to the values of the y-axis on the right, the plotted graph will result in a graphically and logically incorrect representation.
As you can see in the image below, the plot area of the sum of amount bar and the sum of expected revenue aligns close together, while, the difference between $700,000 and $40,500 is drastic, creating inaccurate interpretations.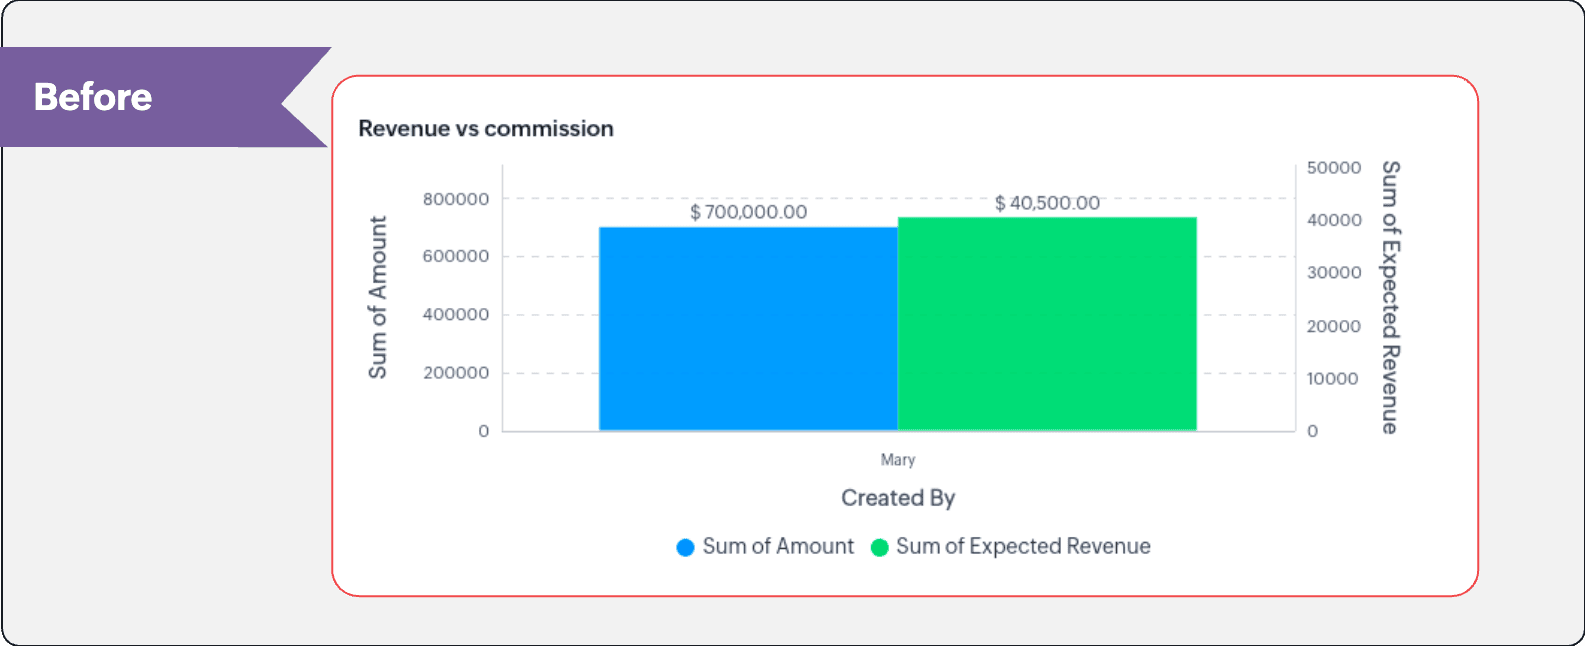
In this enhancement, we're allowing neighboring values of measures to merge so that the interpretation can be more visually accurate.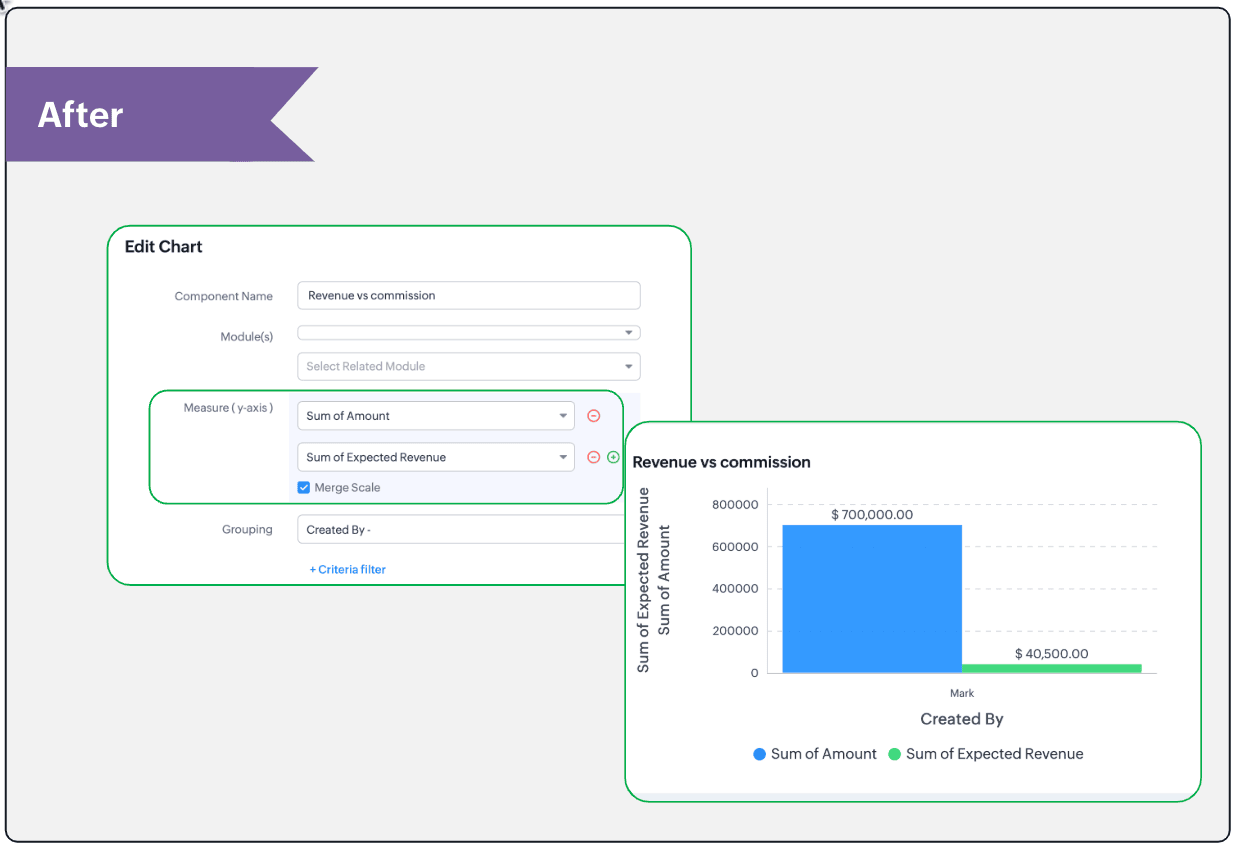
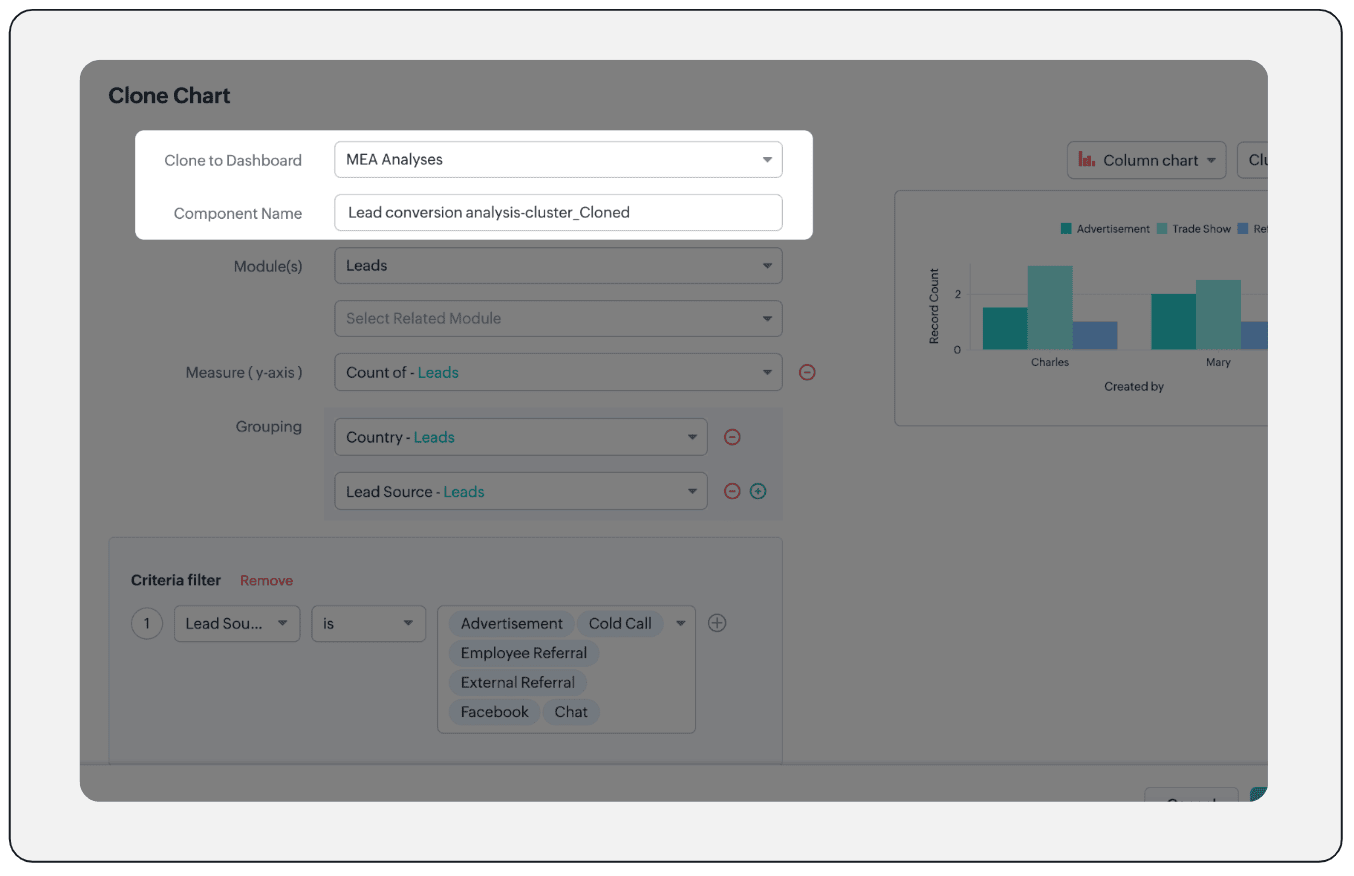
- Clone components to a different dashboard: Dashboards in Analytics serve in unique ways for various audiences—there can be separate dashboards for the sales team, marketing team, engineering team, and so on, and the chances of using the same measure for reference is common. Thus, when you clone a chart, you can now determine the target dashboard in which the cloned chart can be placed.
Resource: Help document
Thanks and have a good one!
Kind regards,
Saranya Balasubramanian
Saranya Balasubramanian
Topic Participants
Saranya Balasubramanian
Sticky Posts
Enhancements to the formula field in Zoho CRM: Auto-refresh formulas with the "Now" function, stop formula executions based on criteria, and include formulas within formulas
Dear Customers, We hope you're well! By their nature, modern businesses rely every day on computations, whether it's to calculate the price of a product, assess ROI, evaluate the lifetime value of a customer, or even determine the age of a record. WithElevate your CX delivery using CommandCenter 2.0: Simplified builder; seamless orchestration
Most businesses want to create memorable customer experiences—but they often find it hard to keep them smooth, especially as they grow. To achieve a state of flow across their processes, teams often stitch together a series of automations using WorkflowPresenting ABM for Zoho CRM: Expand and retain your customers with precision
Picture this scenario: You're a growing SaaS company ready to launch a powerful business suite, and are looking to gain traction and momentum. But as a business with a tight budget, you know acquiring new customers is slow, expensive, and often deliversNimble enhancements to WhatsApp for Business integration in Zoho CRM: Enjoy context and clarity in business messaging
Dear Customers, We hope you're well! WhatsApp for business is a renowned business messaging platform that takes your business closer to your customers; it gives your business the power of personalized outreach. Using the WhatsApp for Business integrationZoho CRM: Sales Rep Professional Certification Program on Coursera
We are happy to share that we have published the Zoho Sales Representative Professional Certificate in partnership with Coursera, a leading platform for online learning and career development that offers access to courses and degrees from leading universities
Recent Topics
Bug in allowing the user to buy out of stock items
Hi i want to allow the user to buy out of stock items, according to the commerce documentation if i disable Restrict "Out of stock" purchases it will, but it doesnt work, so i want to know if it had any relation with zoho inventory, and if theres anyTransition Criteria Appearing on Blueprint Transitions
On Monday, Sept. 8th, the Transition criteria started appearing on our Blueprints when users hover over a Transition button. See image. We contacted Zoho support because it's confusing our users (there's really no reason for them to see it), but we haven'tZoho CRM Sales Targets for Individual Salespeople
Our organistion has salespeople that are allocated to different regions and have different annual sales targets as a result. I am building an CRM analytics dashboard for the sales team, which will display a target meter for the logged in salesperson.Transfer all Related Data to new Account Owner
Currently when I change the account Owner I only see the option to change only the open deals But I want the new account owner to take over all the related modules and all the deal stages Is it not possible right now? Am I missing something? Do I reallyCan i connect 2 instagram accounts to 1 brand?
Can i connect 2 instagram accounts to 1 brand? Or Do i need to create 2 brands for that? also under what subscription package will this apply?Add an external email to the allowed list
I need to allow an external email to raise a ticket on Manage Engine ServiceDesk Plus. The external email is a outside of our domain and is not a domain user. The email address that needs to be allowed to raise a ticket request is noreply@formsatack.com.How to Calculate MTTR (Mean Time to Resolve)
We want to calculate MTTR (Mean Time to Resolve) in our Zoho Analytics report under Tickets. Currently, we are using the following fields: Ticket ID Ticket Created Time Ticket Closed Time Ticket On Hold Time We are planning to calculate MTTR (in days)How to export project tasks, including the comments
Hi, how can I export the project tasks, whereby I can also see the comments associated to a specific task? The use-case is that often we use comments to discuss or update a task related ideas. I would like to export the tasks, where we can also see theUnable to see Zoho contacts in Zoho app on ios
Hi Support Team, I am a new user, I have created my account and installed zohomail app on iOS 16 which works. I was also able to import my Gmail contacts into Zoho Contacts, which I can see. The problem is that I can’t see these imported cobalts in ZohomailDoes Zoho Sheet Supports https://n8n.io ?
Does Zoho Sheet Supports https://n8n.io ? If not, can we take this as an idea and deploy in future please? ThanksBigin Android app update: User management
Hello everyone! In the most recent Bigin Android app update, we have brought in support for the 'Users and Controls' section. You can now manage the users in your organization within the mobile app. There are three tabs in the 'Users and Controls' section:Share records with your customers and let them track their statuses in real time.
Greetings, I hope everyone is doing well! We're excited to introduce the external sharing feature for pipeline records. This new enhancement enables you to share pipeline records with your customers via a shareable link and thereby track the status ofLive webinar: Discover Zoho Show: A complete walkthrough
Hello everyone, We’re excited to invite you to our upcoming live webinar, Discover Zoho Show: A Complete Walkthrough. Whether you’re just getting started with Show or eager to explore advanced capabilities, this session will show you useful tips and featuresDeal Stage component/widget/whatever it is... event
Deal Stages I am trying to access the event and value of this component. I can do it by changing the Stage field but users can also change a Deal Stage via this component and I need to be able to capture both values. Clicking on 'Verbal' for instance,Create advanced slideshows with hybrid reports using Zoho Projects Plus
Are your quarterly meetings coming up? It’s time to pull up metrics, generate reports, and juggle between slides yet again. While this may be easier for smaller projects, large organizations that run multiple projects may experience the pressure whenAdd an option to disable ZIA suggestions
Currently, ZIA in Zoho Inventory automatically provides suggestions, such as sending order confirmation emails. However, there is no way to disable this feature. In our case, orders are automatically created by customers, and we’ve built a custom workflowFormula field with IF statement based on picklist field and string output to copy/paste in multi-line field via function
Hello there, I am working on a formula field based on a 3-item picklist field (i.e. *empty value*, 'Progress payment', 'Letter of credit'). Depending on the picked item, the formula field shall give a specific multi-line string (say 'XXX' in case of 'ProgressCRM x WorkDrive: File storage for new CRM signups is now powered by WorkDrive
Availability Editions: All DCs: All Release plan: Released for new signups in all DCs. It will be enabled for existing users in a phased manner in the upcoming months. Help documentation: Documents in Zoho CRM Manage folders in Documents tab Manage filesZoho CRMの流入元について
Zoho CRMとZoho formsを連携し、 formsで作成したフォームをサイトに埋め込み運用中です。 UTMパラメータの取得をformsを行い、Zoho CRMの見込み客タブにカスタム項目で反映される状況になっています。 広告に関してはUTMパラメータで取得できているため問題ないのですが、オーガニック流入でフォーム送信の場合も計測したいです。メールやGoogle、Yahoo、directなどの流入元のチャネルが反映されるようにしたいのですが、どのように設定したら良いでしょうか。 また、In App Auto Refresh/Update Features
Hi, I am trying to use Zoho Creator for Restaurant management. While using the android apps, I reliased the apps would not auto refresh if there is new entries i.e new kitchen order ticket (KOT) from other users. The apps does received notification but would not auto refresh, users required to refresh the apps manually in order to see the new KOT in the apps. I am wondering why this features is not implemented? Or is this feature being considered to be implemented in the future? With theError While Sign in on Zoho Work Drive
Dear Team, I hope this email finds you well. I have recently created a Zoho account and started using it. But while I am trying to log in to Zoho work drive it won't log me in its crashing every time I try it. I have tried it on android app, phone browserChoosing a portal option and the "Unified customer portal"?
I am trialling Zoho to replace various existing systems, one of which is a customer portal. Our portal allows clients to add and edit bookings, complete forms, manage their subscriptions and edit some CRM info. I am trying to understand how I might bestElevate your CX delivery using CommandCenter 2.0: Simplified builder; seamless orchestration
Most businesses want to create memorable customer experiences—but they often find it hard to keep them smooth, especially as they grow. To achieve a state of flow across their processes, teams often stitch together a series of automations using WorkflowUnified Directory : How to Access ?
I signed in to Zoho One this morning and was met with the pop up about the upgraded directory (yay!) I watched the video and pressed "Get Started" ... and it took me back to the standard interface. How do I actually access the new portal/directory ?Translation support expanded for Modules, Subforms and Related Lists
Hello Everyone! The translation feature enables organizations to translate certain values in their CRM interface into different languages. Previously, the only values that could be translated were picklist values and field names. However, we have extendedUnified task view
Possible to enable the unified task view in Trident, that is currently available in Mail?Bigin, more powerful than ever on iOS 26, iPadOS 26, macOS Tahoe, and watchOS 26.
Hot on the heels of Apple’s latest OS updates, we’ve rolled out several enhancements and features designed to help you get the most from your Apple devices. Enjoy a refined user experience with smoother navigation and a more content-focused Liquid GlassImporting data into Assets
So we have a module in Zoho CRM called customers equipments. It links to customers modules, accounts (if needed) and products. I made a sample export and created extra fields in zoho fsm assets module. The import fails. Could not find a matching parentAllow instruction field in Job Sheets
Hello, I would like to know if it is possible to have an instruction field (multi line text) in a job sheet or if there is a workaround to be able to do it. Currently we are pretty limited in terms of fields in job sheets which makes it a bit of a struggleStreamlining Work Order Automation with Zoho Projects, Writer & WorkDrive
Hello Community, Here is the first post in 'Integration & Automation' Series. Use Case :: Create, Merge, Sign & Store Documents in Zoho WorkDrive. Scenario :: You have a standard Work Order template created in Zoho Writer. When a task status is chosenThe dimensions of multilingual power
Hola, saludos de Zoho Desk. Bonjour, salutations de Zoho Desk. Hallo, Grüße von Zoho Desk. Ciao, saluti da Zoho Desk. Olá, saudações da Zoho Desk. வணக்கம், Zoho Desk இலிருந்து வாழ்த்துகள். 你好,来自 Zoho Desk 的问候。 مرحباً، تحيات من Zoho Desk. नमस्ते, ZohoMulti-line address lines
How can I enter and migrate the following 123 state street Suite 2 Into a contact address. For Salesforce imports, a CR between the information works. The ZOHO migration tool just ignores it. Plus, I can't seem to even enter it on the standard entry screen.Accessing Zoho Forms
Hi all, We're having trouble giving me access to our company's Zoho Forms account. I can log in to a Forms account that I can see was set up a year ago, but can't see any shared forms. I can log into Zoho CRM and see our company information there withoutArchiving Contacts
How do I archive a list of contacts, or individual contacts?Cost of good field
Is there a way we can have cost of good sold as a field added to the back end of the invoicing procedure and available in reports?How to add image to items list in Invoice or Estimate?
Hello! I have just started using Zoho Invoice to create estimates and, possibly to switch from our current CRM/ERP Vendor to Zoho. I have a small company that is installing CCTV systems and Alarm systems. My question is, can I add images of my "items" to item list in Zoho Invoice and Estimates and their description? I would like to show my clients the image of items in our estimates so they can decide if they like these items. And I tell you, often they choose more expensive products just becauseIssue with the Permission to Zoho Form
I am getting an error by signing in to zoho form as it is stated that i don't have permission to access this is admin accountCRM templates
Hello everyone, In my company we use Zoho campaigns where we set up all newsletters and we use Zoho CRM for transactional emails. I have created some templates in Zoho campaigns but from my understanding i cannot use those in Zoho CRM, right?Meet Canvas' Grid component: Your easiest way to build responsive record templates
Visual design can be exciting—until you're knee-deep in the details. Whether it's aligning text boxes to prevent overlaps, fixing negative space, or simply making sure the right data stands out, just ironing out inconsistencies takes a lot of moving parts.Pending Sales Order Reports
Pending sale order report is available for any single customer, Individual report is available after 3-4 clicks but consolidated list is needed to know the status each item. please help me.Next Page