Format a chart
Charts are used for data visualization and aids in conveying information to the audience effectively. Using appropriate formatting options for your chart allows you to improve its visual appearance. With the Show app for iOS, you can add a title, a legend, and change the color of the chart area and plot area according to your requirement.
Tap on the chart in the slide and Format from the bottom of the screen.
This will open the chart formatting options.
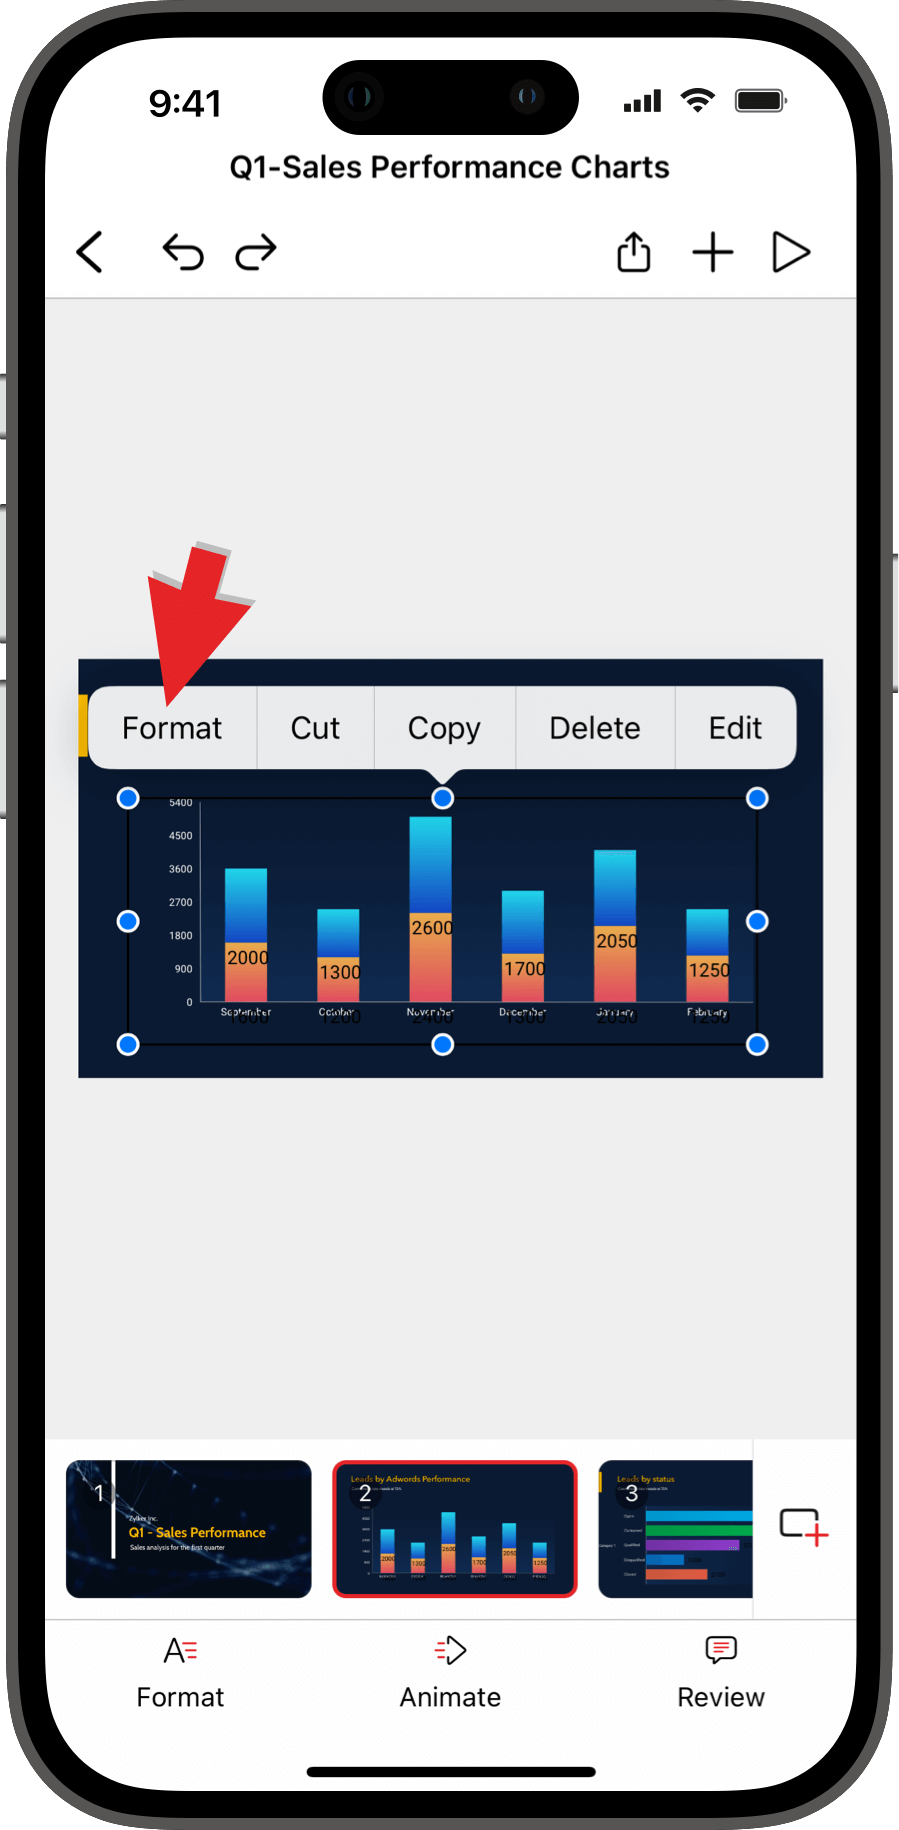
These formatting options include Chart, Style, and Arrange.
Chart
Tap Chart.
Title
- Toggle the Title switch on to enable the chart title.
- Toggle the Enable Title Overlay switch to place the chart over the title.
Legend
- Toggle the Legend switch on to enable the chart legend.
- Tap Legend Position to position the chart legend to the Top, Left, Bottom, or Right of the chart.
- Toggle the Enable Legend Overlay switch to place the chart over the legend.
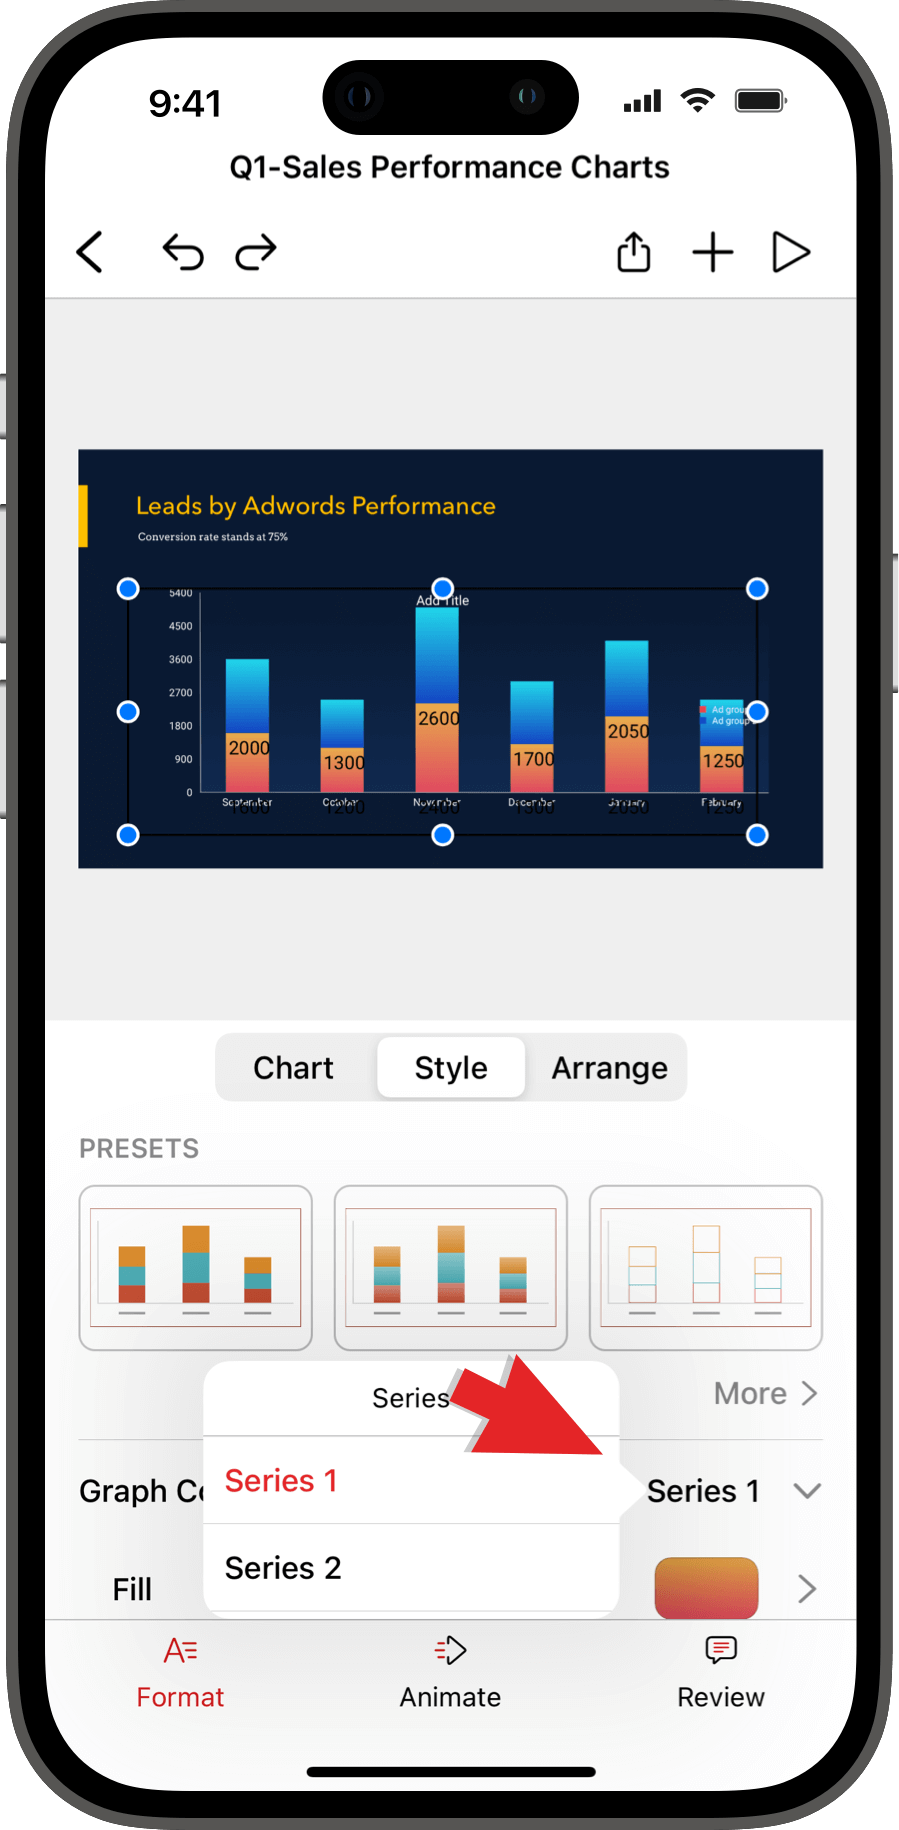
Style
Tap Style.
Chart Presets
Tap to select from the available presets and tap More to view other options.
Graph Colors
From the Graph Colors dropdown select the Series.
Apply Fill
Apply Stroke
Toggle the Stroke switch on.
Fill Area
Tap the Fill Area dropdown to select from the Chart Area, Plot Area, Title, and Legend.
Arrange
Tap the Arrange tab.