Customer Segmentation using RFM Analysis
How well do you know your customers? Whether you operate in a B2B or B2C space, chances are that 80% of your business comes from just 20% of your customers (Pareto's Principle). According to a study by Forbes, acquiring new customers costs five times more than retaining the existing ones. Identifying high-value customers is crucial to increase revenue and building brand loyalty.
Customer Segmentation is a critical strategy for businesses to understand and engage with customers effectively. Understanding the behavioral patterns of customers can help personalize the purchases they make and cater to their needs better.
Questions like who are the customers who contribute more to sales, who are the customers about to churn, will help digital marketers understand the behavioral patterns of their customers.
While there are many criteria based on which the customer base can be segmented, this solution focuses on segmenting customers based on the RFM analysis.
What is RFM Analysis?
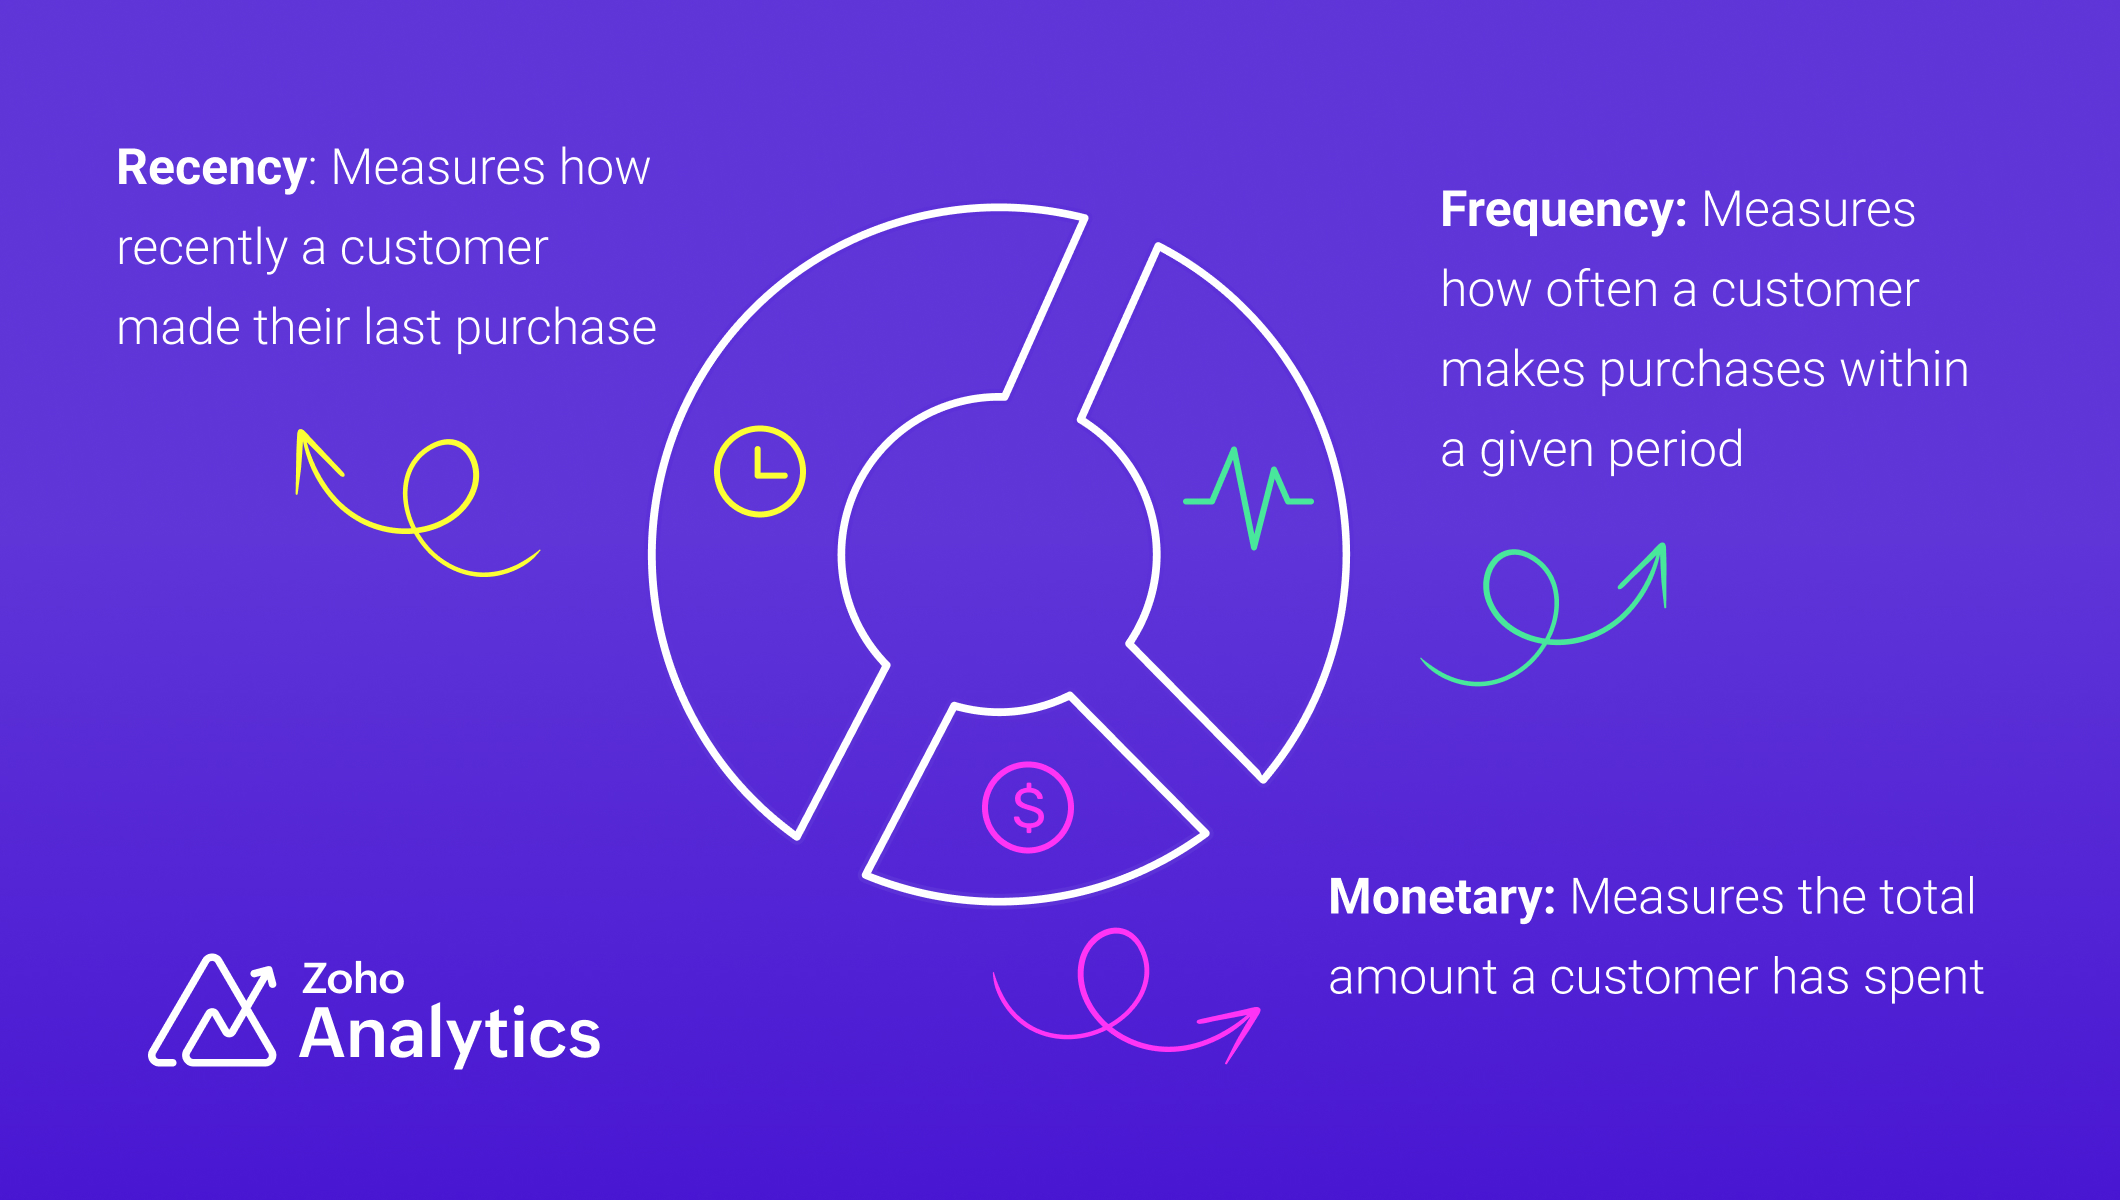
RFM analysis (Recency, Frequency and Monetary) is a method used to identify and segment existing customers based on their purchasing behavior. The key metrics of RFM analysis include
Recency
Recency refers to how recently a customer has made their purchase and this is the most important metric of the other metrics. This metric is a strong indicator of customer loyalty and interest.
Frequency
Frequency refers to how often a customer makes purchases or interacts with a business within a specific period. It measures the level of engagement and loyalty of a customer.
Monetary
Monetary value refers to the total amount of money a customer has spent with a business during a specific period.
Industry-Specific Applications of RFM Analysis
- SaaS and subscription services: RFM analysis can be adapted for SaaS and subscription services to segment users based on engagement, renewals, and revenue contribution.
- Financial Sector: RFM analysis can improve credit scoring and risk assessment by evaluating customer transaction patterns, helping financial institutions make more informed loan approval decisions.
Data Requirements
For RFM analysis, you'll need a transactional dataset with the following equivalent columns (details)
- A product (Product ID)
- A related transaction (Transaction ID)
- Number of products purchased in a transaction (Product Quantity)
- The product purchase price (Product Price)
- Transaction date (Date)
- Customer who made the purchase (Customer ID, Customer Name)
We have used a sample table of e-commerce data for illustration.
Steps for Implementing RFM analysis
1. Gather and Prepare Transaction Data :
Gather all transaction data, ensuring it includes customer identifiers, transaction dates, and monetary amounts, and address missing or inconsistent values, ensuring data integrity before analysis.
2. Compute RFM Metrics:
To segment customers based on their behavior, we compute three key metrics: Recency (R), Frequency (F), and Monetary Value (M). Below are SQL queries for each, along with detailed explanations.
Recency (R)
Recency measures how recently a customer made a purchase. It is calculated as the number of days since their last transaction. Customers with recent purchases are more engaged, while those who haven’t bought in a long time may be at risk of churn.
The time frame for RFM analysis should be tailored to your business model and industry. Choosing the right period for RFM analysis is essential, as it directly influences the accuracy of customer segmentation and the quality of insights derived.
Frequency (F)
Frequency tracks how often a customer makes purchases within a specific period. A higher frequency indicates a loyal customer who regularly shops, while a lower frequency suggests occasional or one-time buyers.
Monetary Value (M)
The total amount spent by the customer in the same period
RFM Query Table
|
SELECT
"Customer ID",
"Customer Name",
DAYS_BETWEEN(MAX("Transaction Date"), CURRENT_DATE()) AS "Recency",
COUNT ("Order ID") AS "Frequency",
SUM("Transaction Amount") AS "Monetary Value"
FROM "Customer Data"
GROUP BY "Customer ID",
"Customer Name"
ORDER BY "Recency" ASC,
"Frequency" DESC,
"Monetary Value" DESC
|
3. Segment Customers using Cluster Analysis
Manual scoring can skew the results and may not be practical for handling large volumes of data. In contrast, using machine learning algorithms like cluster analysis ensures unbiased, efficient, and data-driven segmentation. Unlike traditional scoring methods such as the quantile or percentile-based approach, cluster analysis recognizes inherent relationships and patterns in the data. With cluster analysis, business can obtain accurate segmentation and devise targeted strategies to improve sales and customer retention.
Follow the below steps to apply cluster analysis,
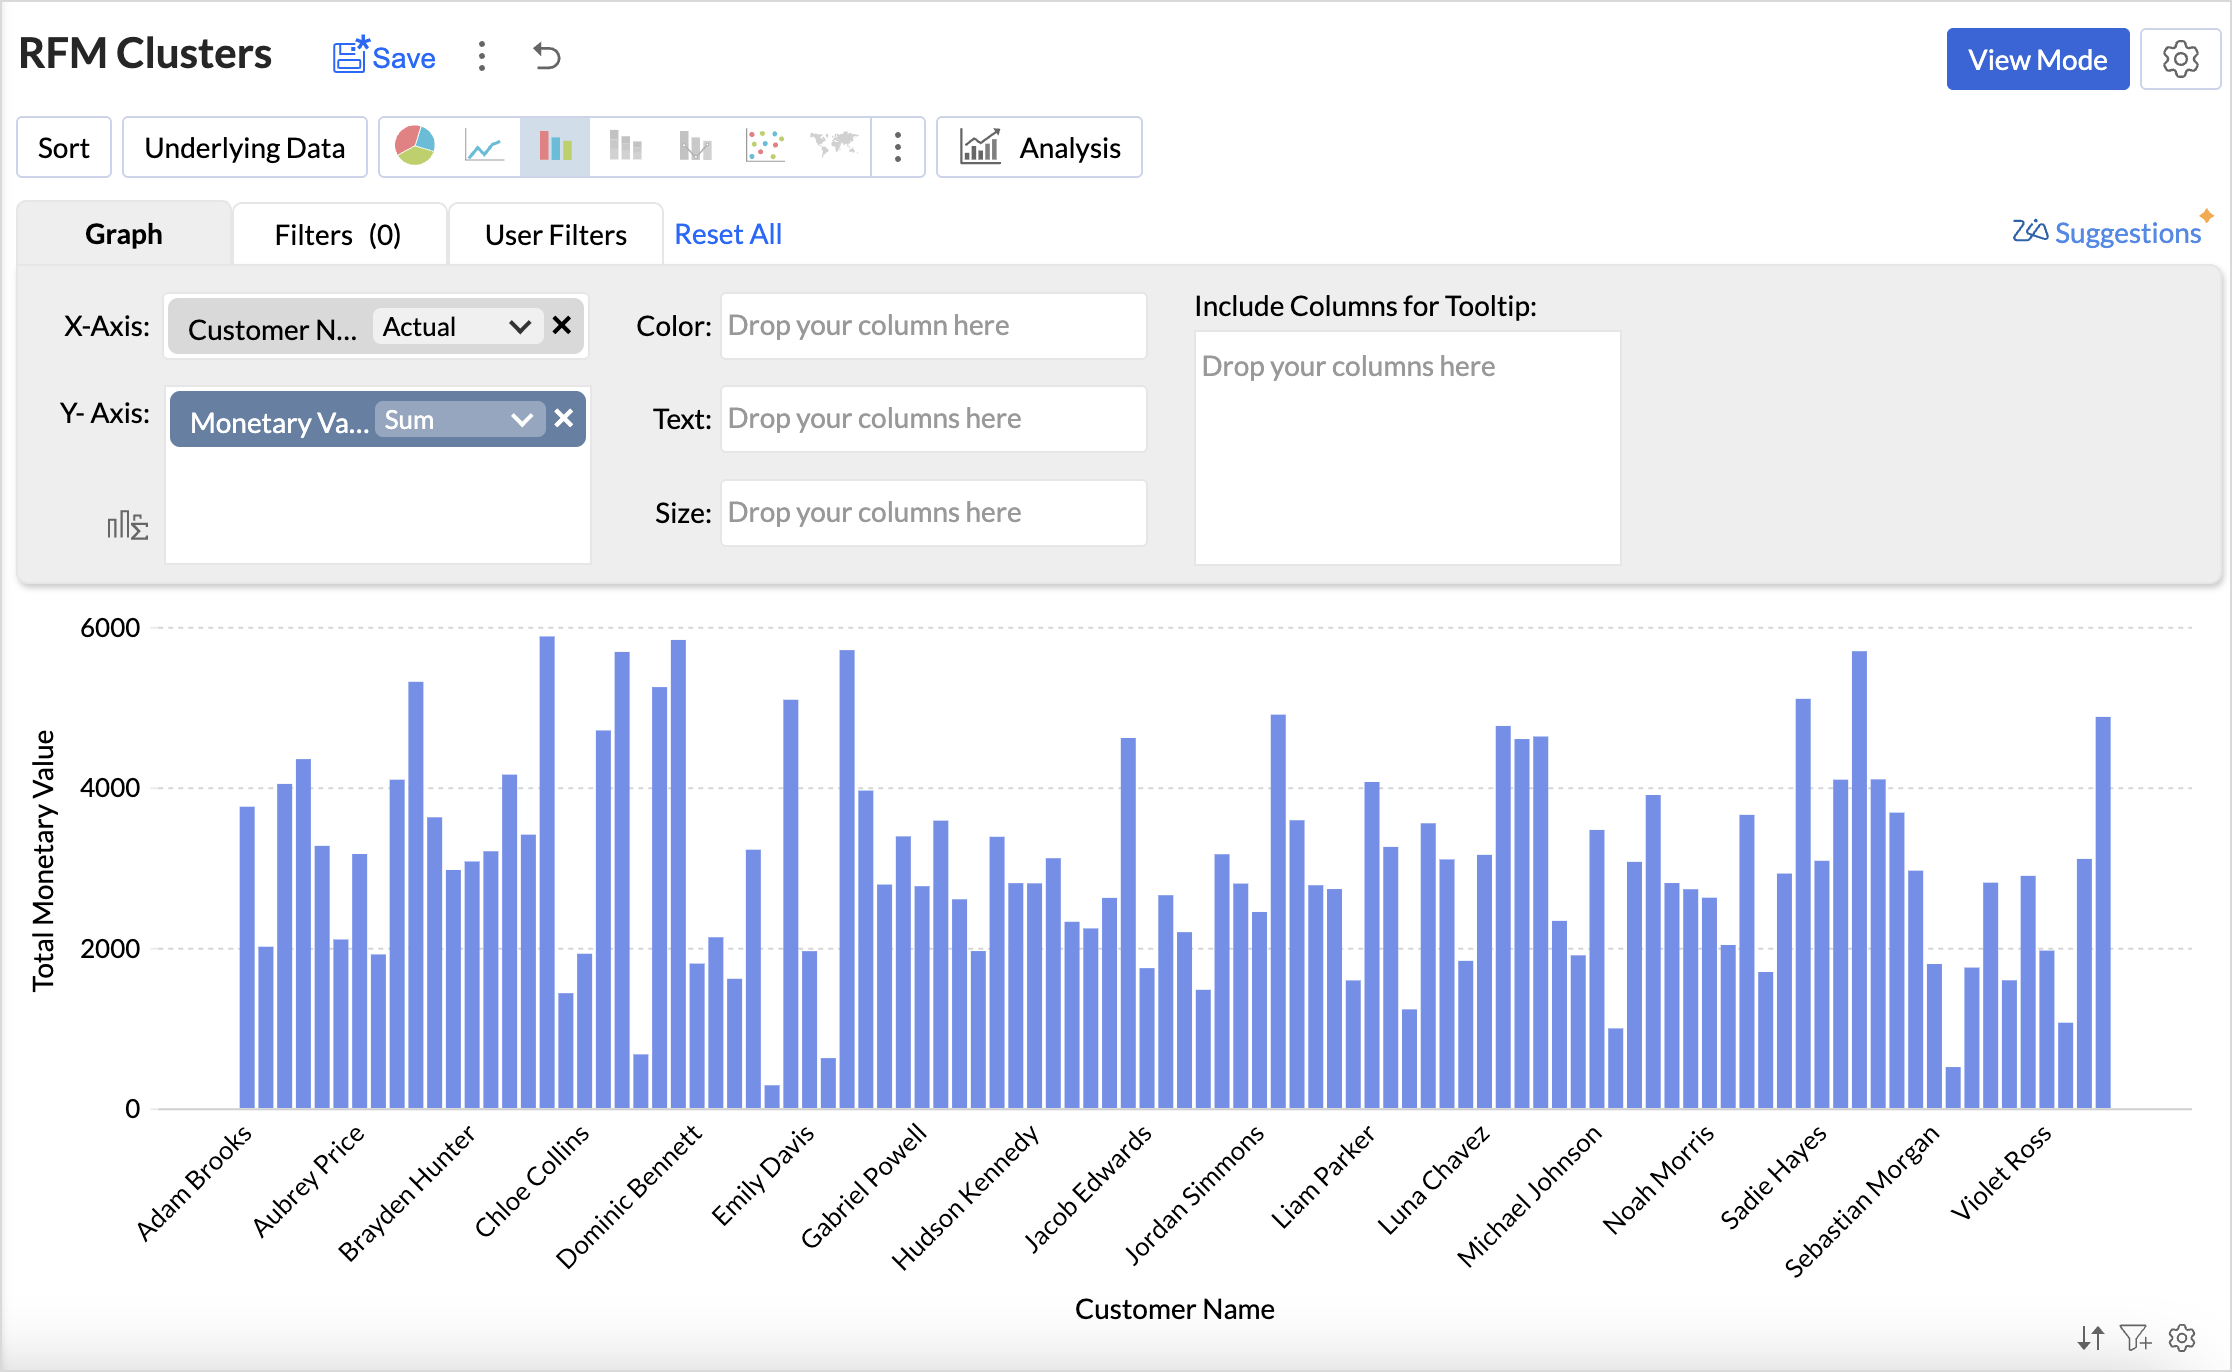
- Click the Create New icon and choose New chart from the drop-down menu.
- Add the columns to the chart shelf as shown below,
- X-axis: Customer Name
- Y-axis: Monetary Value with Sum function.
- Click Generate Graph and change the chart type to bar chart.
- Click the Analysis icon and select Cluster Analysis > Add Clusters.
- The Model is chosen automatically based on the columns dropped in the shelves.
- By default, the columns dropped in the shelves (Monetary Value) are selected as factors. Click the drop-down icon to include Recency and Frequency columns as factors.
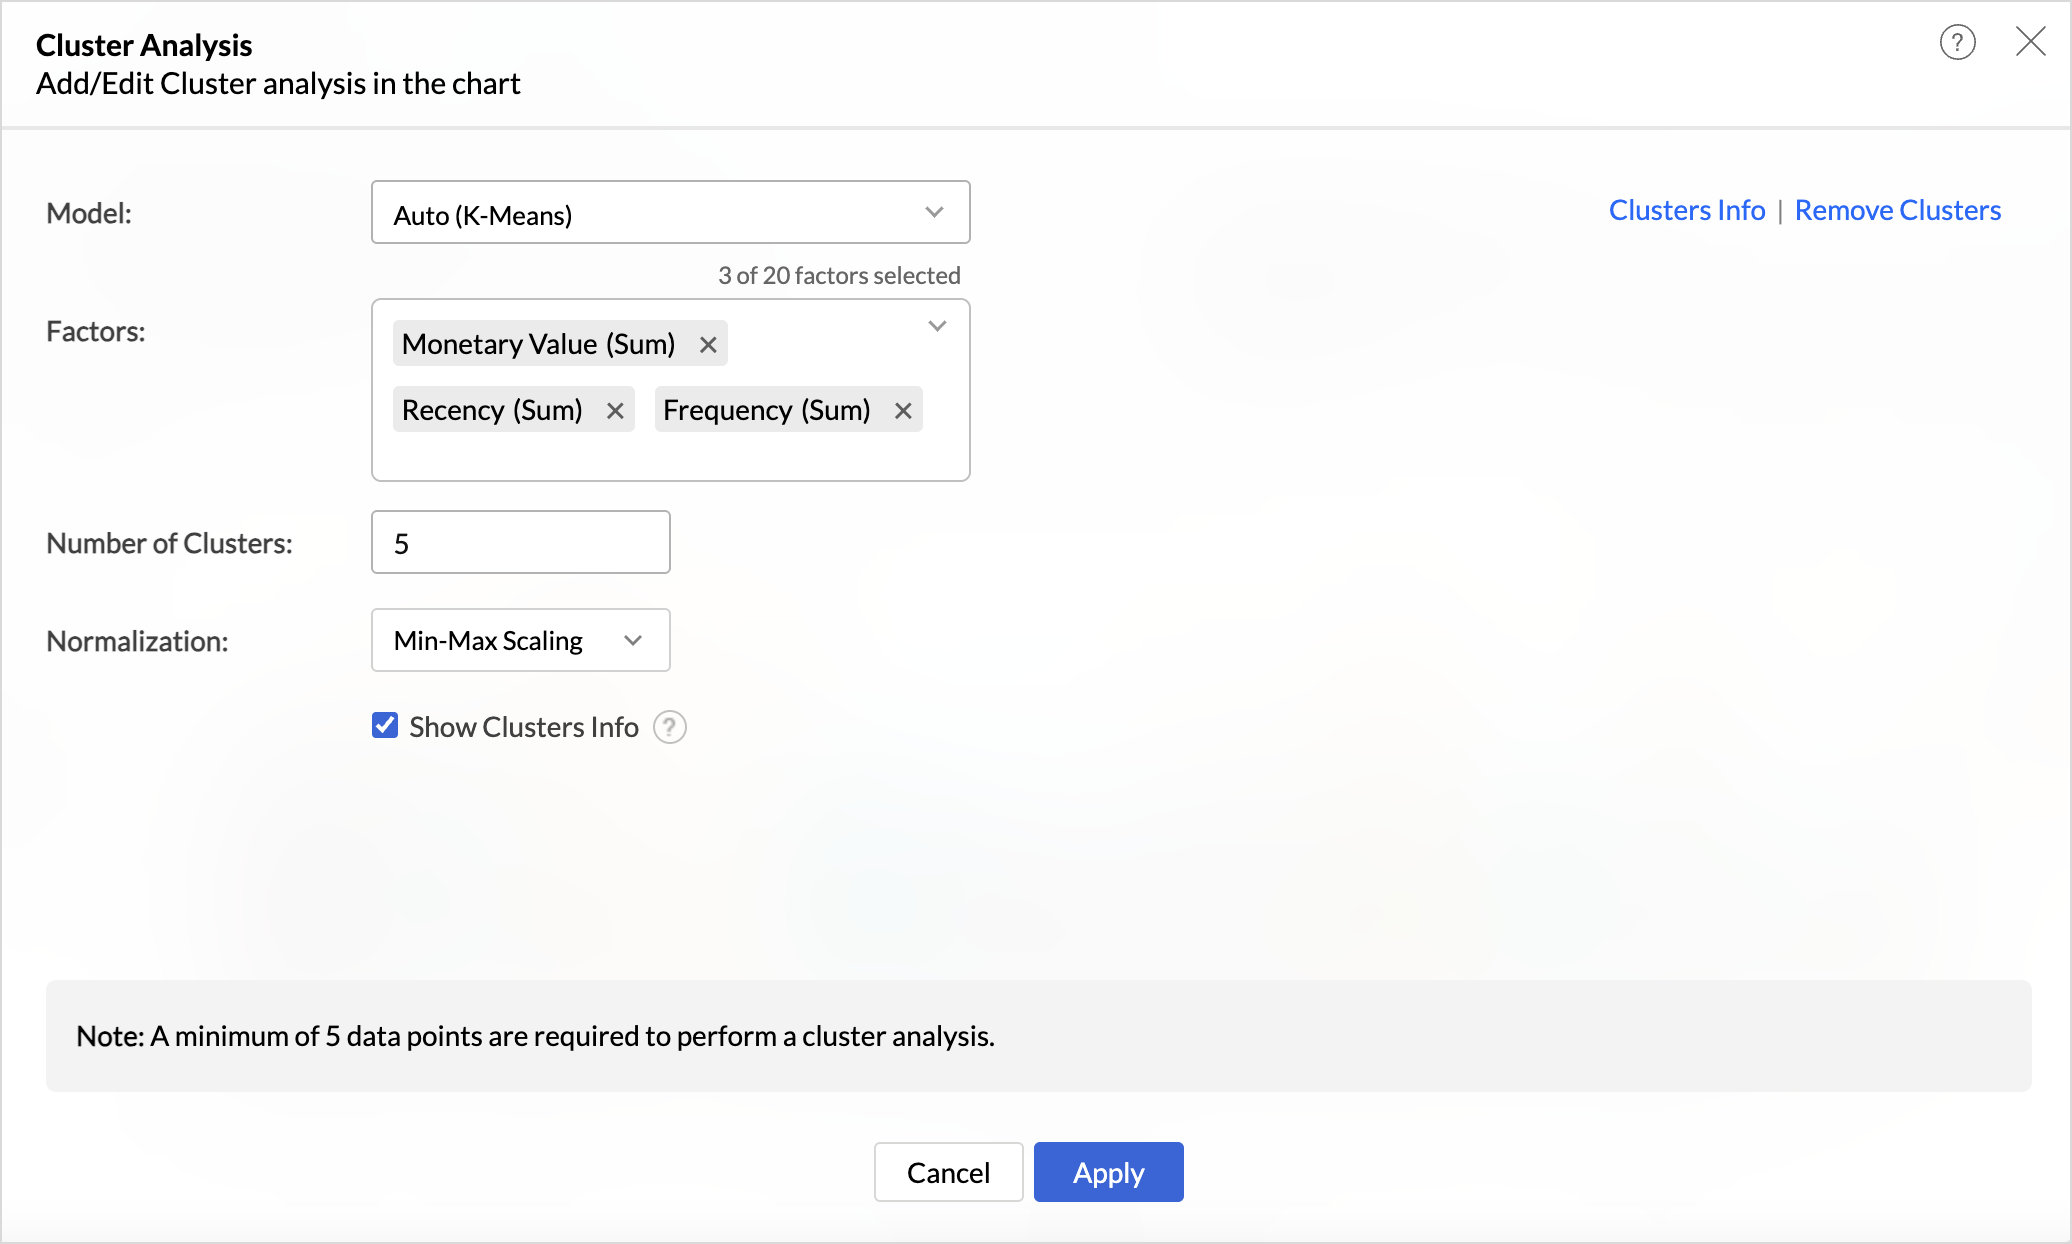
- The number of clusters is determined automatically but can be adjusted based on business needs and specific customer segmentation goals to ensure optimal categorization.
- Choose the Normalization method to prevent values of high ranges from dominating the results. For instance, Recency (measured in days) and Monetary Value (measured in currency) have different scales, and normalization ensures a balanced contribution from each metric.
- Click Apply.
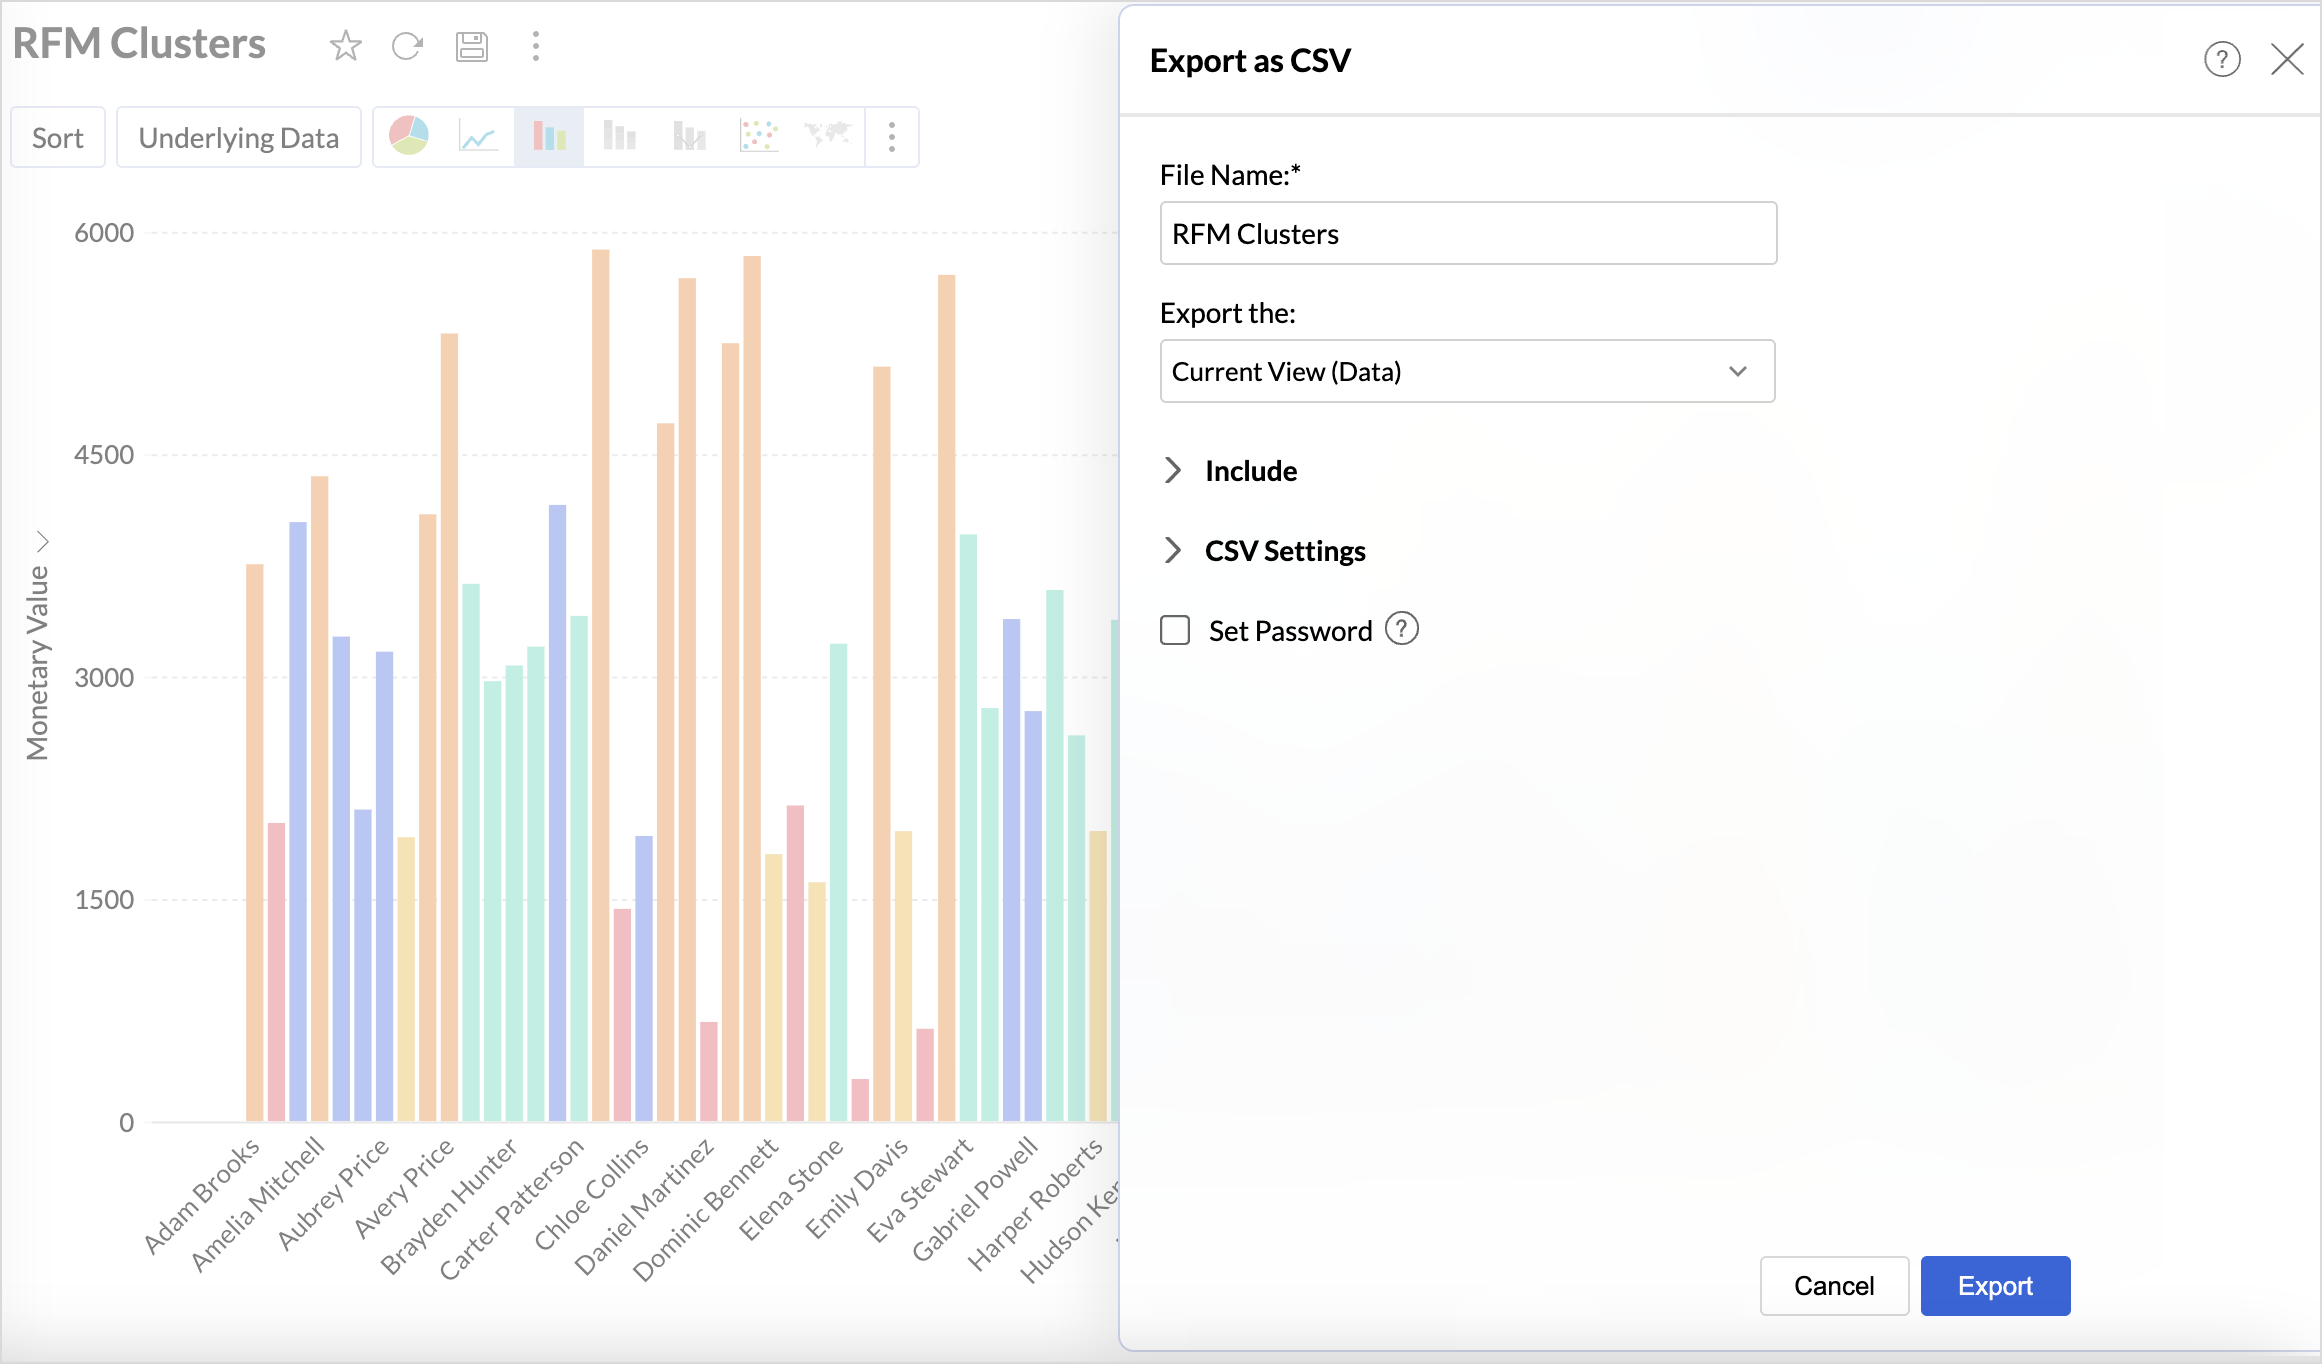
4. Export Clusters Data
Once the customer profiles have been segmented using cluster analysis, Export the Current view in the preferred table format to build more data visualizations to understand the clusters.
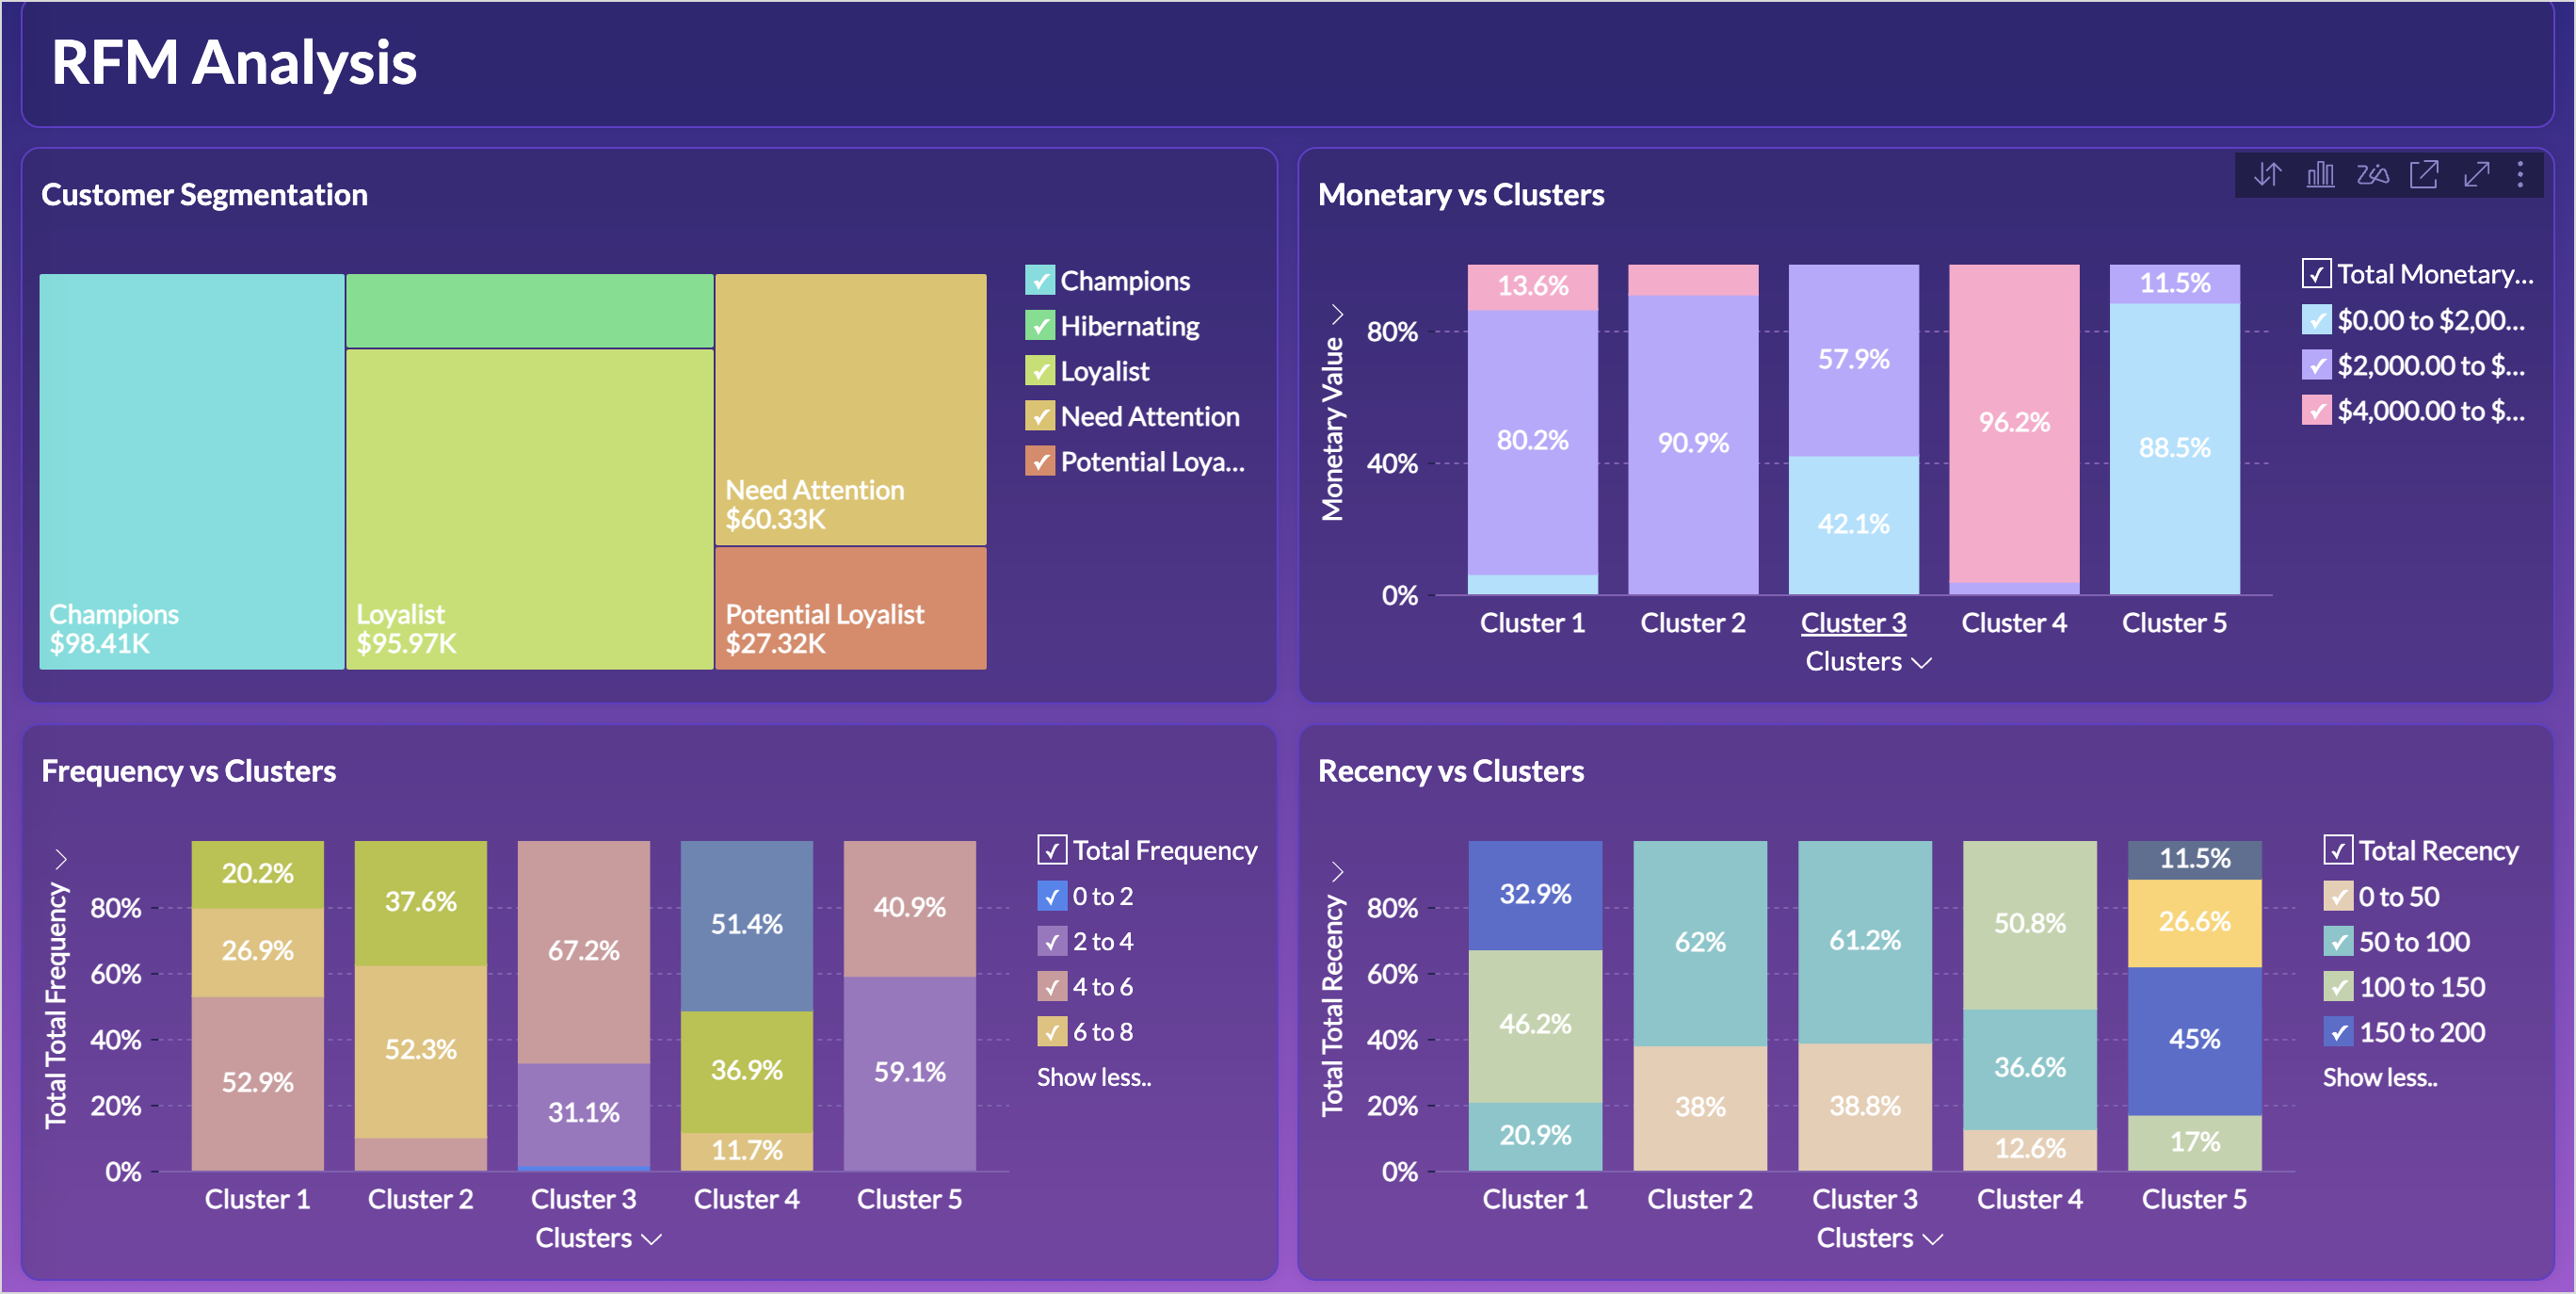
Build an RFM Analysis Dashboard
The RFM analysis dashboard provides a comprehensive view of customer behavior. Let's look at the steps involved in building this dashboard.
1. Import the Clusters Data
Import the downloaded clusters table back into Zoho Analytics using the files option as given below.
- Click the New icon on the side navigation panel and choose New Table/ Import Data.
- Select files and choose the Clusters Table to import and click Next.
- A data preview will be displayed; verify the data types of columns and click Create.
2. Create Reports to Understand the Characteristics of the Clusters
While the data is clustered, understanding the characteristics of each cluster is what enables businesses to take strategic actions. This includes identifying which customers need targeted marketing, personalized engagement, or retention efforts. Recognizing patterns within clusters provides insights into customer behavior, which is essential for optimizing marketing campaigns, improving retention strategies, and enhancing customer experience.
The below reports help understand the distribution of customers across different monetary value, recency and frequency segments within each cluster.
Clusters vs Monetary Value
- Access the cluster table (imported data) and click the new icon > chart view.
- Drag and drop the columns as given below:
- X-axis - Clusters
- Y-axis - Monetary Value with the Count function.
- Color - Monetary Value with the Actual Range function.
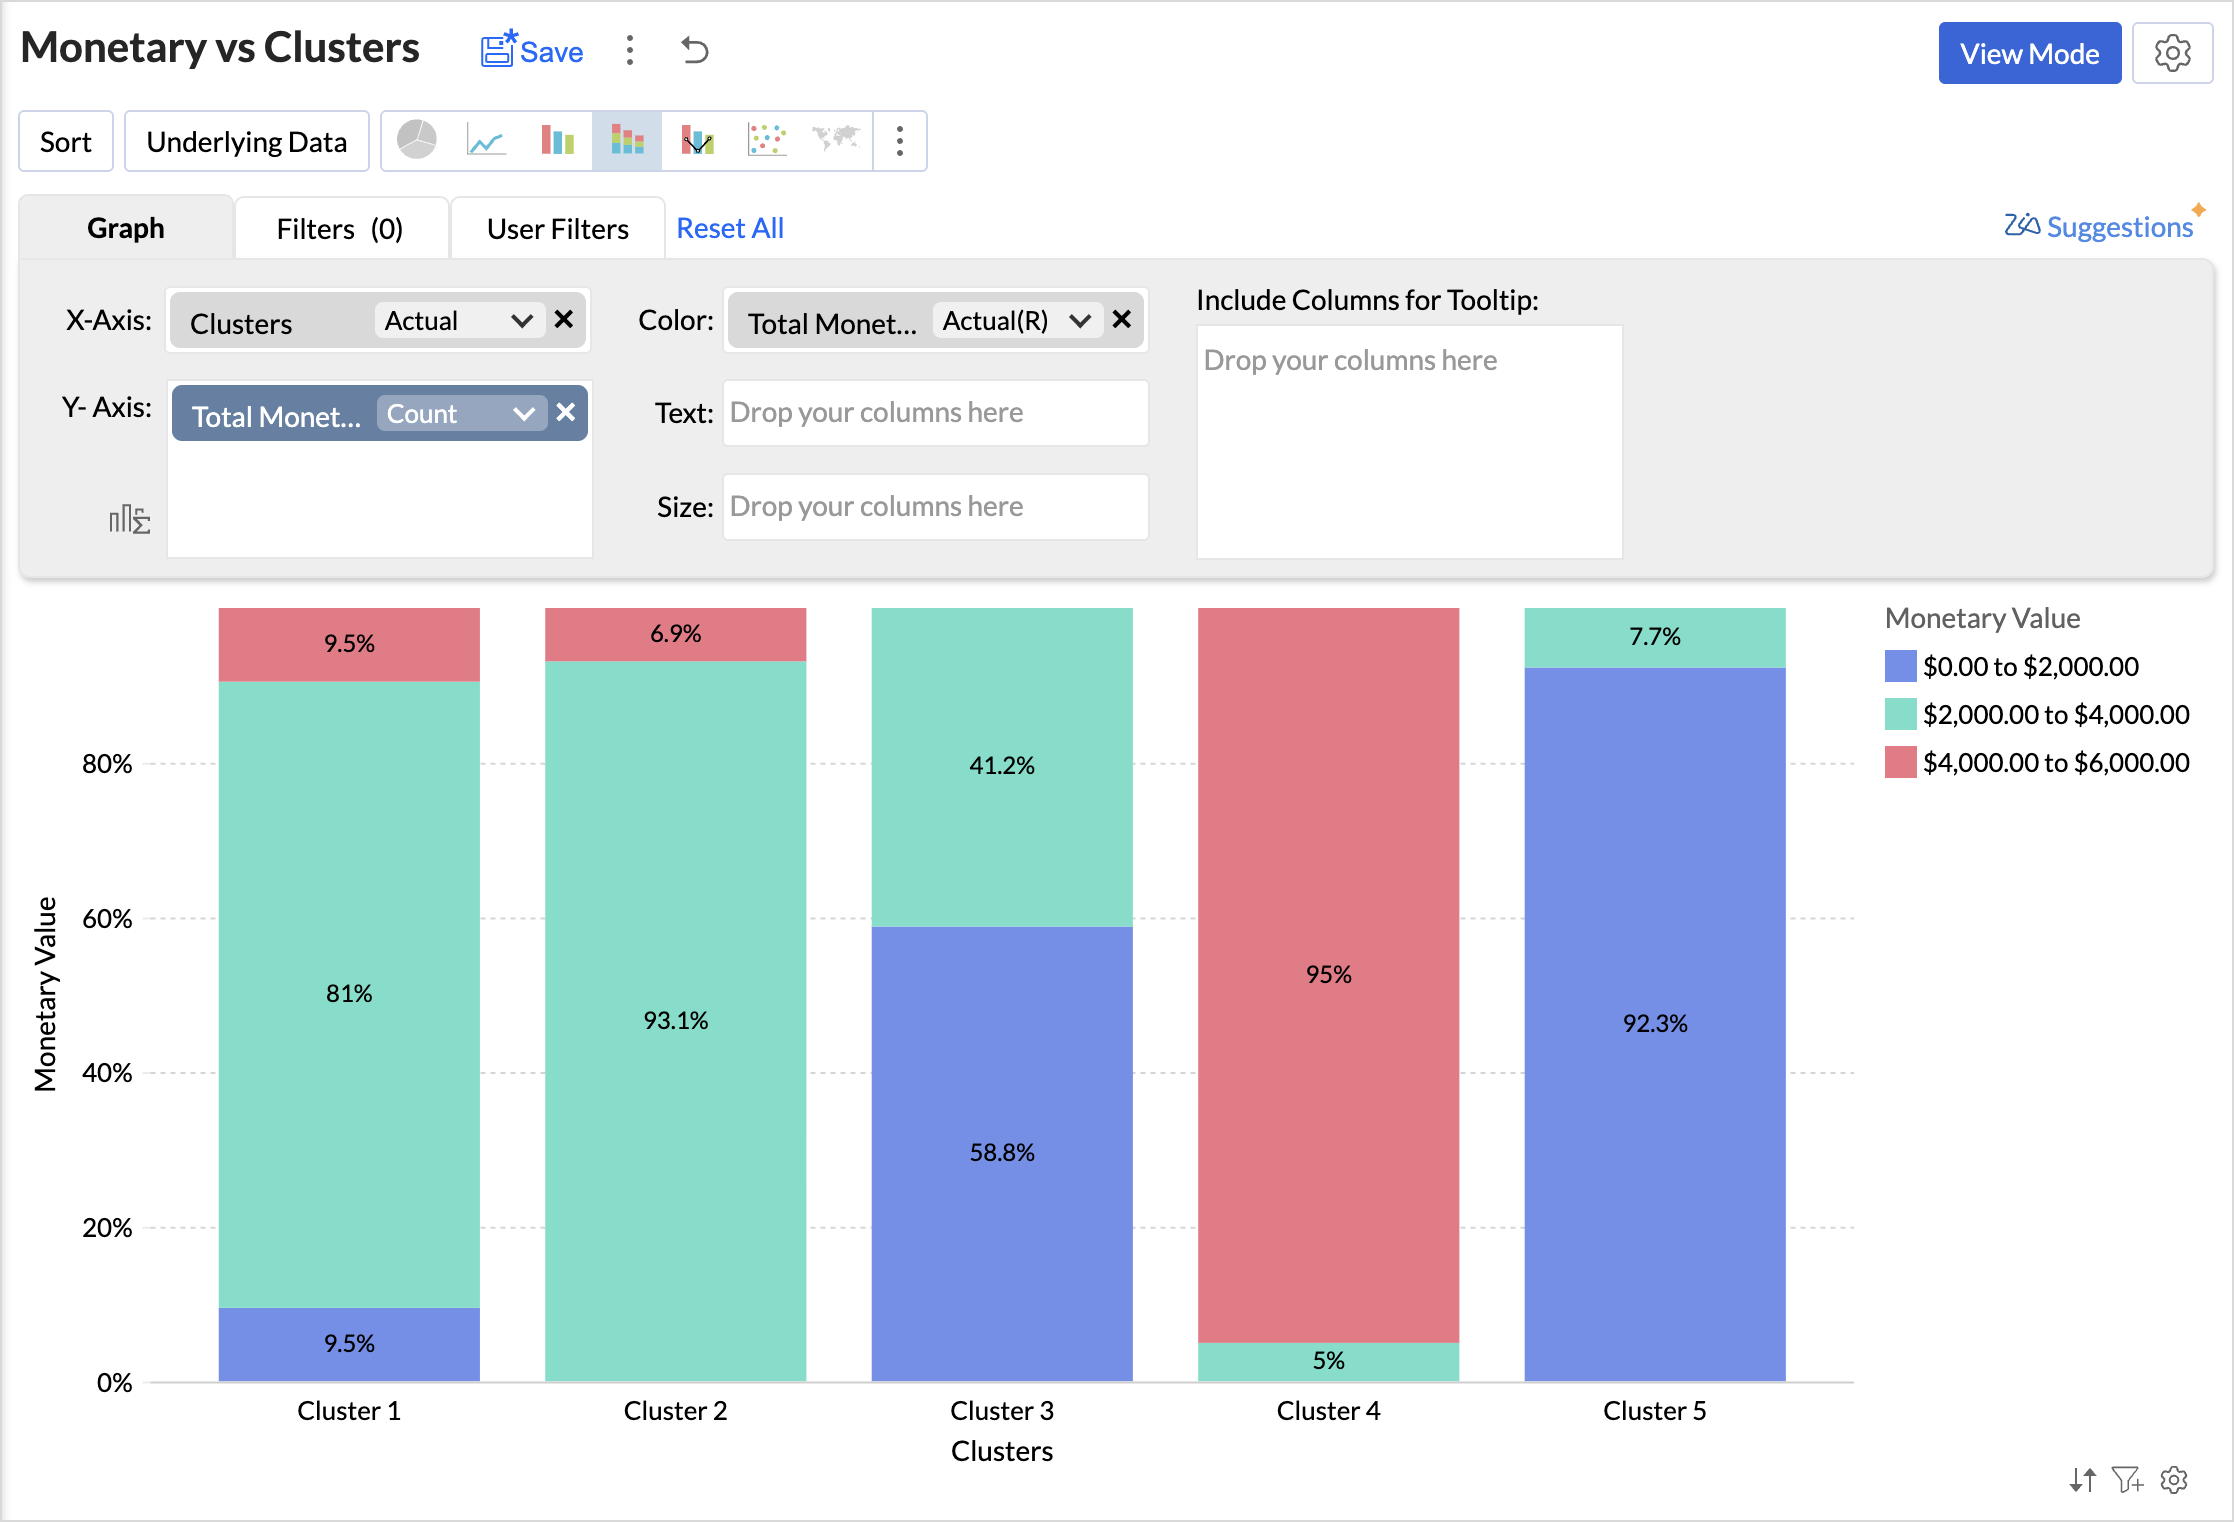
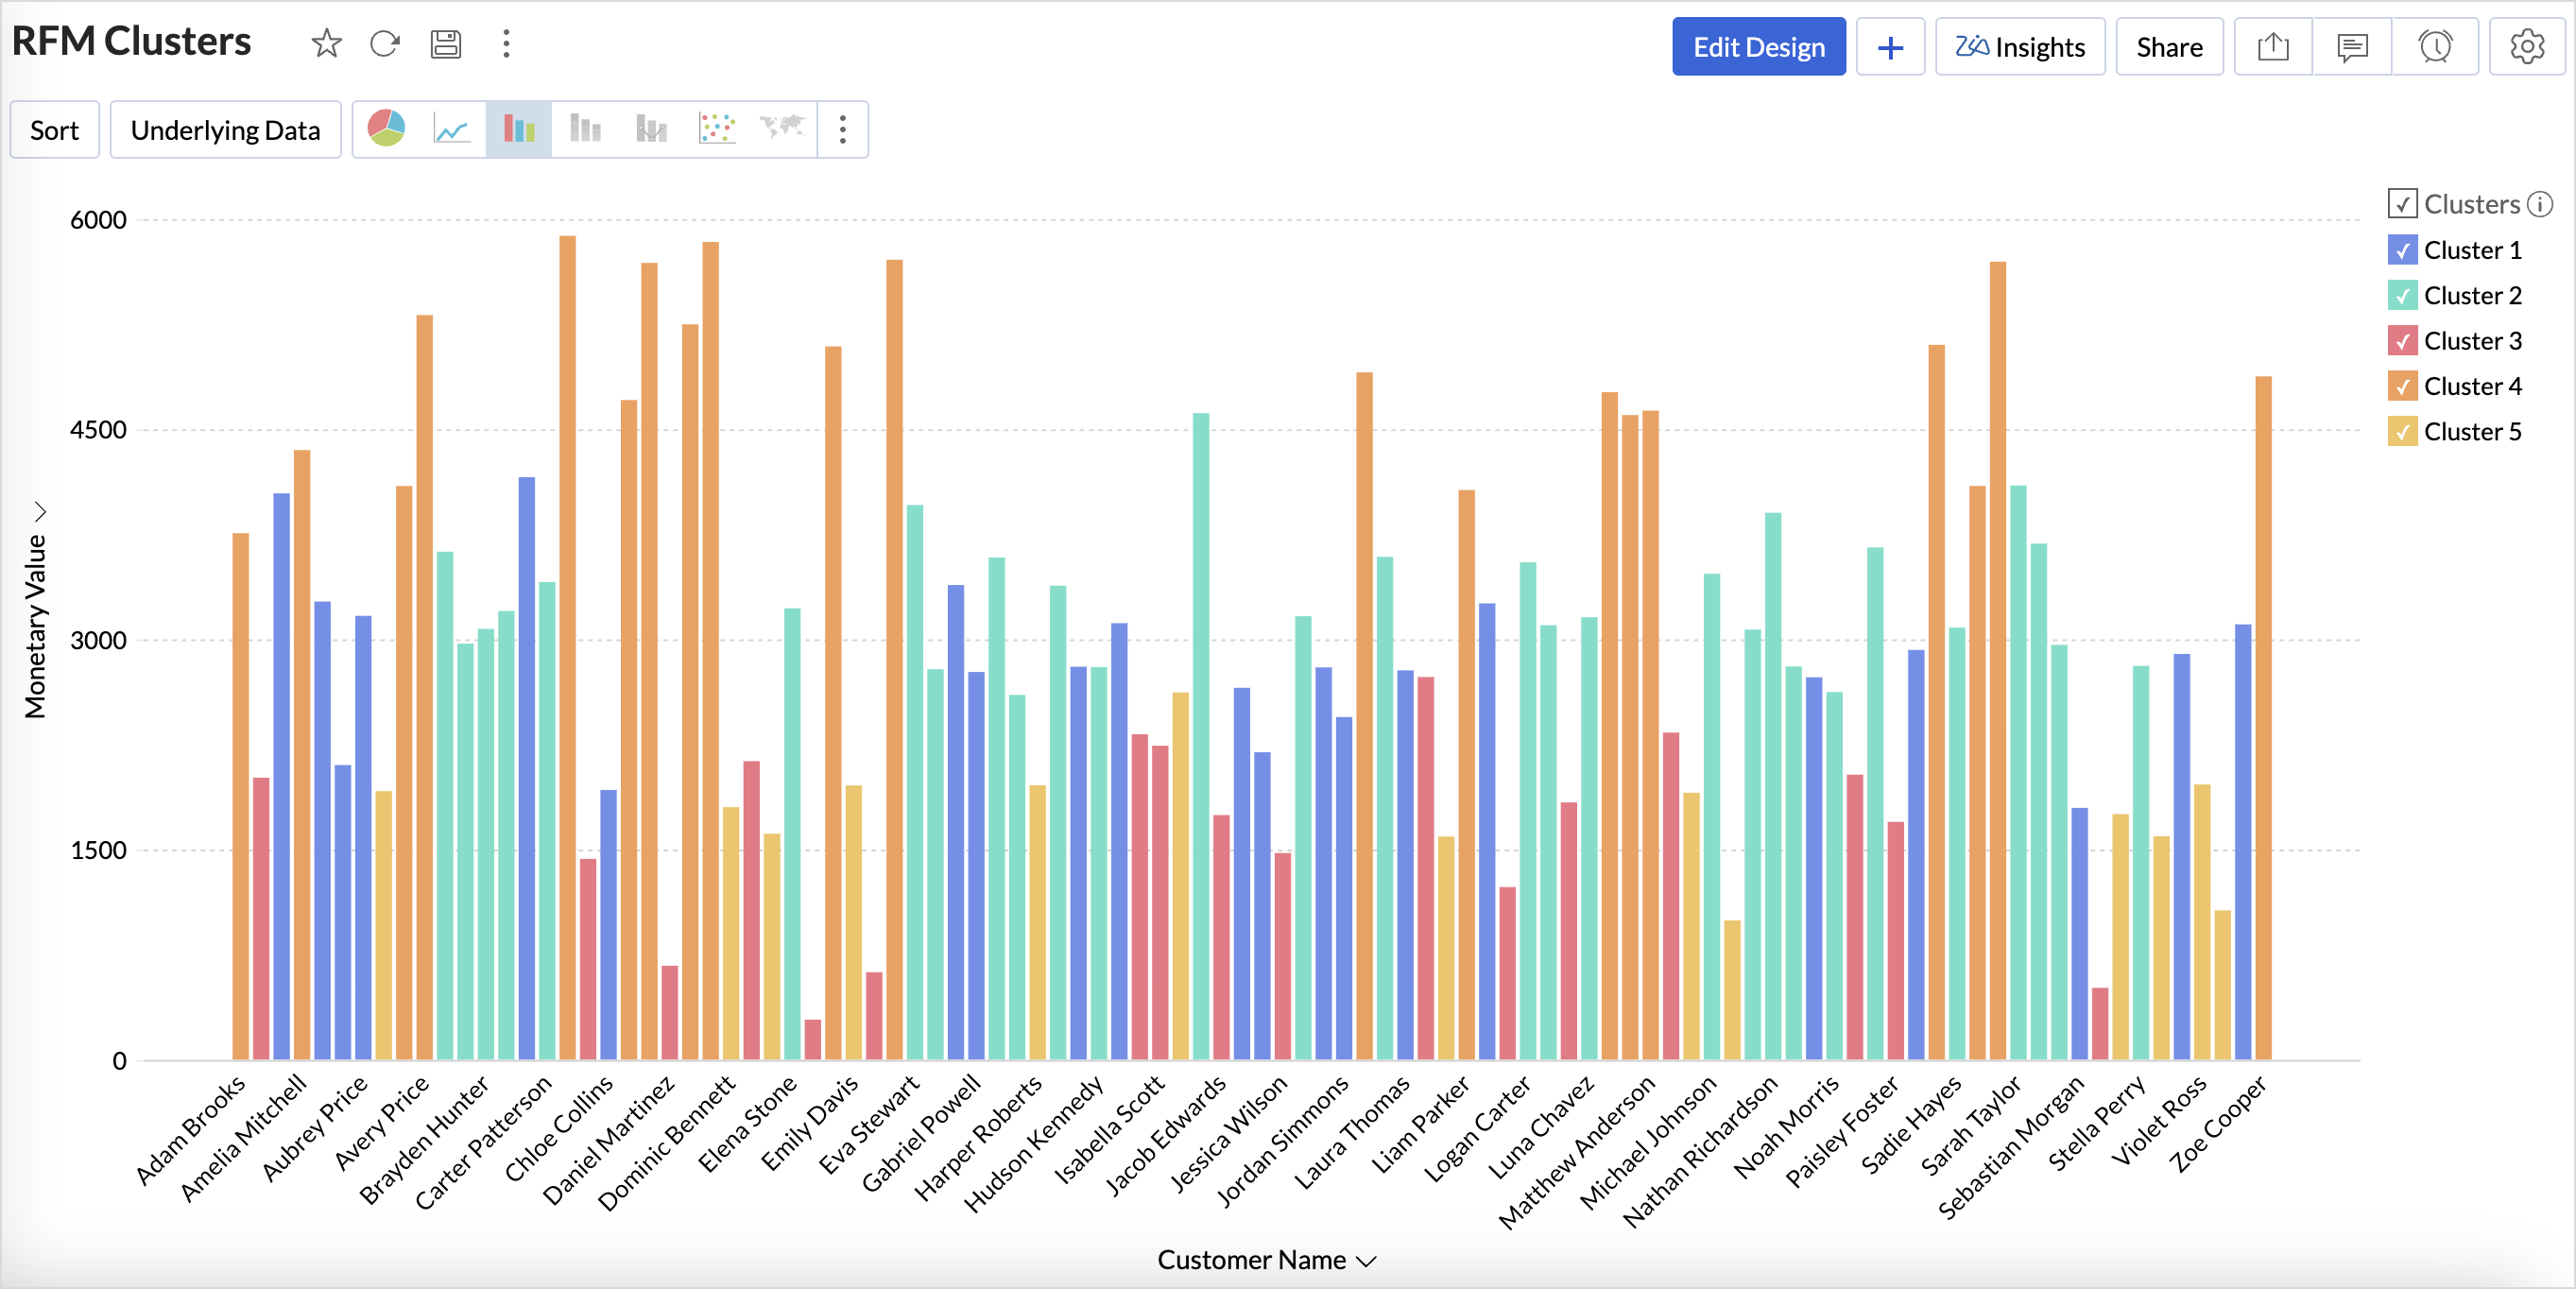
Analyzing the chart, we can infer that,
- Cluster 1 consists of a diverse group of customers spanning all spending levels.
- Cluster 2 includes moderate to high spenders who contribute significantly to revenue.
- Cluster 3 comprises low to mid-range spenders, often occasional buyers.
- Cluster 4 represents high-value customers with premium spending habits.
- Cluster 5 consists primarily of low spenders with minimal purchasing activity.
You can similarly create reports to know about the distribution of customers for the Recency and Frequency metrics.
The below table lists the characteristics of clusters
|
Cluster
|
Cluster Classification
|
Recency
|
Frequency
|
Monetary
|
Recommended actions
|
|
Cluster 1
|
Needs Attention
|
100 to 150 days
|
Low to Moderate
|
Diverse spending
|
Re-engagement campaigns, discounts, or reminders to encourage repeat purchases.
|
|
Cluster 2
|
Loyalist
|
0-50 (Highly Active)
|
High
|
Consistent moderate-to-high spenders
|
Loyalty programs, exclusive deals, early access to new products to maintain engagement.
|
|
Cluster 3
|
Potential Loyalist
|
0-50 (Active)
|
Low to Moderate | Budget-conscious, occasional buyers | Cross-selling, personalized recommendations, and value-based promotions. |
|
Cluster 4
|
Champions
|
100-150 (Inactive)
|
Moderate to High (Frequent buyers)
|
High spenders
|
VIP experiences, personalized services, and premium offers to retain and enhance their spending.
|
|
Cluster 5
|
Hibernating
|
Mostly inactive or infrequent
|
Low
|
Minimal spending
|
Win-back campaigns, incentives, special discounts, and targeted ads to regain interest.
|
Based on the above table, you can give specific labels to the clusters using the bucket columns option.
RFM Dashboard
Limitations & Considerations of RFM Analysis
While RFM analysis is a powerful customer segmentation tool, businesses should be aware of certain limitations and factors that can influence results:
- Data Freshness and Relevance: RFM analysis relies on transactional data, making the freshness and relevance of this data crucial for accurate customer segmentation. Setting up automated data imports ensures real-time updates, reducing the risk of working with stale data.
- Seasonal Variations: Customer purchasing behavior often fluctuates due to seasonal trends, holidays, and industry-specific cycles, which can impact RFM scores and lead to misleading segmentation if not accounted for properly. Instead of analyzing only recent months, compare customer behavior for the same period in previous years to detect true engagement patterns.
Topic Participants
Nisha Angel J
Hammer Group
Juan
Sticky Posts
What's New in Zoho Analytics - February 2026
Hello Users! We're back with another round of updates for Zoho Analytics. This month's release focuses on giving you greater flexibility in how you visualize, manage, and act on your data - with new features like custom visualizations, remote MCP server,What's New in Zoho Analytics - January 2026
Hello Users! We are starting the year with a strong lineup of updates, marking the beginning of many improvements planned to enhance your analytics experience. Explore the latest improvements built to boost performance, simplify analysis, and help youWhat's New in Zoho Analytics - November 2025
We're thrilled to announce a significant update focused on expanding your data connectivity, enhancing visualization capabilities, and delivering a more powerful, intuitive, and performant analytics experience. Here’s a look at what’s new. Explore What'sWhat's New in Zoho Analytics - October 2025
Hello Users! We're are back with a fresh set of updates and enhancements to make data analysis faster and more insightful. Take a quick look at what’s new and see how these updates can power up your reports and dashboards. Explore What's New! ExtremeWhat’s New in Zoho Analytics – September 2025
Hello Users!! In this month’s update, we’re raising the bar across multiple touchpoints, from how you bring in data, plan and track projects to how you design and brand your dashboards. We’ve added the all-new Gantt chart for project visualization, expanded
Recent Topics
Shift-Centric View for Assigning and Managing Shifts in Zoho People
Hello Zoho People Product Team, Greetings and hope you are doing well. This feature request is related to Zoho People - please don't move it to zoho one! We would like to submit a feature request regarding the shift assignment and management view in Zohocant upload images in signature- urgent help needed. ta!
HI, I have been trying to insert the company logo in the signature. i have tried it several times since yesterday, the longest I waited was 1 hour and 12 minutes for the pop up window to upload a 180 KB .jpg file. what am i doing wrong.. an urgent replyAdd Ticket button in Home view
When I go to the My Tickets or the Knowledge Base view in our Help Centre, the Add Ticket button is available, but not in the Home view. I would really like for it to be displayed in the Home view as well. Is this possible? Thanks.Problem using Zoho Desk API
Goodmorning, I am trying to use the Zoho Desk API to create a dashboard in Grafana, but I am having a problem. Following the instructions in the API documentation, I created the API Console application (server-based application). Then I created the stringAdd zoho calendar to google calendar
Hi I keep seeing instructions on how to sync Zoho CRM calendar with google calendar but no instructions on how to view Zoho calendar in my google calendar.How to print a label from zoho creator app?
Hello, I would like to print a label from zoho creator app record similar to attached one. Size 74mm x 102mm. I tried record template. It leaves plenty of space around the content and also I couldn't set the height of the page. So it is not printing properly. Could someone please direct me to right direction for this requirement?City field suggestion in Zoho Books
Hi team, We are using Customers module in Zoho Books. In the Address section, we want to understand whether the City field can show suggestions while typing using any API or built-in feature. For example, if a user types “Mum”, can the system suggestNon-responsive views in Mobile Browser (iPad)
Has anyone noticed that the creator applications when viewed in a mobile browser (iPad) lost its responsiveness? It now appears very small font size and need to zoom into to read contents. Obviously this make use by field staff quite difficult. This is not at all a good move, as lots of my users are depending on accessing the app in mobile devices (iPads), and very challenging and frustrating.How can I check all announce?
Hiii, May I ask how can I check all the announce based on broadcast date instead of reply date based So that I will not will miss out any new functionWhat are the create bill API line item requiered fields
While the following documentation says that the line items array is requiered it doesn't say what if any files are requiered in the array. Does anyone know? API documentation: https://www.zoho.com/inventory/api/v1/bills/#create-a-bill I'm trying to addCannot connect to imap.zoho.eu on iOS26
Hey, I recently migrated to another iPhone and since then use iOS26. Every since then, I was not able to connect to "imap.zoho.eu" from Apple Mail. I tried deleting the account and adding it again, did not work. I tried creating an app password, didn'tPersonalize your booking pages with Custom CSS
Greetings from the Zoho Bookings team! We’re introducing Custom CSS for Zoho Bookings, designed to give you complete control over the look and feel of your booking pages. With this new feature, you can upload your own CSS file to customize colors, fonts,Marketer's Space: Plan smarter with Zoho Campaigns' Calendar
Hello Marketers, Welcome to another post! Today, we'll talk about a discreet yet significant feature that's neatly tucked inside Zoho Campaigns: the calendar. It might look like an optional but somewhat unnecessary feature that you can use occasionally,Accounting for Territories
We have different territories i.e. Europe and US and although we can manage the sales process for each and allocate different currencies in the CRM - we want to keep the accounting separate for each territory as there are different reporting and accounting requirements - is there any way to do this? We want to avoid having two separate instances of zoho.User
If user is already part of manage engine endpoint central , what hapens when i try to add them to another Zoho org / directory? Are these users added as external users?Create static subforms in Zoho CRM: streamline data entry with pre-defined values
Last modified on (9 July, 2025): This feature was available in early access and is currently being rolled out to customers in phases. Currently available for users in the the AU, CA, and SA DCs. It will be enabled for the remaining DCs in the next coupleOutlook - Zoho CRM Calendar Integration
I'm facing an issue integrating Outlook with Zoho CRM. Has anyone successfully connected their Outlook to Zoho, and are all your meetings and emails being captured correctly in the CRM? Any insights or troubleshooting tips would be appreciated【Zoho CRM】ポータル機能のアップデート
ユーザーの皆さま、こんにちは。コミュニティチームの藤澤です。 今回は「Zoho CRM アップデート情報」の中から、ポータル機能のアップデートをご紹介します。 ポータル管理の新機能「自動招待」により、Zoho CRMからポータルへの招待を自動化できるようになりました。これまで必要だった、ユーザーごとの手動設定は不要になります。設定した条件に基づいて、対象ユーザーに自動で招待が送信されます。 ポータルの新機能 条件に基づく自動招待:指定した条件を満たすユーザーに、自動で招待を送信 招待設定:招待メールの言語を選択し、言語ごとに条件を設定可能Contact data removes Account data when creating a quote
Hi, Our customer has address fields in their quote layout which should be the address of the Account. They prefill the information, adding the account name - the address data is populated as per what is in the account - great. However when they then addExport all of our manuals from Zoho Learn in one go
Hi, I know there's a way to export manuals in Zoho Learn, but I want to export everything in one go so it won't take so long. I can't see a way to do this, can I get some assistance or is this a feature in the pipeline? Thanks, HannahAutomation#31: Automate Splitting Names for New Contact Records
Hello Everyone, This week, we present to you a custom function, which allows you to split the first and last names from the user's email ID based on the separator used in the ID. Having grown into a large firm, Zylker Techfix aims to optimize its processes,Automatically remove commas
Team, Please be consistent in Zoho Books. In Payments, you have commas here: But when we copy and paste the amount in the Payments Made field, it does not accept it because the default setting is no commas. Please have Zoho Books remove commas automProject Change Orders and Additions
We are in the process of migrating from QuickBooks Online to Zoho Books. We have Zoho One and like the ability to sync all of our data across everything. And I like that projects work in a way that's less dumb than QuickBooks. I'm trying to figure outZOHO Desk - Description of slave ticket disappeared after Merge
Dear Support, On Zoho Desk the description of a ticket disappeared after merging two ticket. The one which was the slave one completely disappeared. The problem that in this description there was an image which i had only on Desk in that ticket. CouldHow do I insert a cross-reference link to a different section within one Knowledge Base article using Zoho Desk?
I would like to insert a link within a Knowledge Base article to a different section of that same article. The section I want to link to is formatted with the Heading 3 style and is displayed within my TOC. However, I do not see any way to add a linkProblem Adding Facebook Account
Hi, I'm new here, I'm having trouble setting up my Facebook account as a social channel. I think the issue is down to how my Facebook is set up, which is pretty confusing. I have a personal Facebook account (let’s called it A) which is my main FacebookZoho Desk Teams App is not loading
Hi Zoho Desk support. Need an assistance on the Zoho Desk Teams app. Once I click View Ticket, it isn't showing anything. Kindly refer to attached: ZohoDesk Teams App_View Ticket Error.jpg For our Dashboard, we are still experiencing the same issue. KindlyMapping a new Ticket in Zoho Desk to an Account or Deal in Zoho CRM manually
Is there any way for me to map an existing ticket in Zoho desk to an account or Deal within Zoho CRM? Sometimes people use different email to put in a ticket than the one that we have in the CRM, but it's still the same person. We would like to be ableWhich WhatsApp API works seamlessly with Zoho CRM?
I’m exploring WhatsApp API solutions that integrate seamlessly with Zoho CRM for customer communication, lead nurturing, and automation. I would love to hear insights from those who have successfully implemented WhatsApp within Zoho CRM. My Requirements:Allow people to sign a zoho form by using esign or scanned signature
Allow people to sign a zoho form by using esign or scanned signatureButton to Reapply Filters on Sheet(s)
I wrote a macro that I attached to a button to reapply the filters on all my sheets and it says it works, but it doesn't actually do anything. What is wrong with it? Is there another way? Or even make it work for one sheet? Sub UniversalFilterRefresh()Integrate Multiple ZohoBooks organization with zoho projects
We have successfully connected our Zoho Books with Zoho Projects for synronizing timesheet data. Our Business specialty is, that the staff of the Main company (A) is working on several projects, but the Clients are sometimes contracted and paying to aZoho OAuth Connector Deprecation and Its Impact on Zoho Desk
Hello everyone, Zoho believes in continuously refining its integrations to uphold the highest standards of security, reliability, and compliance. As part of this ongoing improvement, the Zoho OAuth default connector will be deprecated for all Zoho servicesHow do I add todays date to merge field
I don't see any selection of todays date when creating a letter. Surely the date option of printing is standard? JohnTracking Emails sent through Outlook
All of our sales team have their Outlook 365 accounts setup with IMAP integration. We're trying to track their email activity that occurs outside the CRM. I can see the email exchanges between the sales people and the clients in the contact module. ButWhats that
Price?The same Contact associated to multiple Companies - Deals
Hi, I would like to know if there is an option to associate the same contact with multiple companies (two or more) deals, using the same contact details for all. This is because we have contacts who are linked to different companies or branches of thePortals-Adjust Column Sizes
I am trying to adjust the column widths in Portals tabs. Columns that don't need to be wide are wide and longer ones are very short. I thought adding more to the digits box in Edit would widen them, but it doesn't. Anyone know how to adjust these?Add link/button to open approved record from approval list and detail views?
Hi, How do I allow users to click on an approval record and open that submission? For example, userA submits a quotation then userB approves/rejects. They both can see the quotation on "completed task" list & detail views, but there's no way for themrecord submitted from creator and invoice is creating in books , but the workflow of books is not tiggering on create of record in books
record submitted from creator and invoice is creating in books , but the workflow of books is not tiggering on create of record in books headermap = Map(); headermap.put("X-ZOHO-Execute-CustomFunction","true"); response_inv = invokeurl [ url :"https://www.zohoapis.com/books/v3/invoices/fromsalesorder?salesorder_id="Next Page