Visualize your data with a new set of charts: Treemap, Butterfly, Sankey, and Cluster charts in Zoho CRM
Dear customers,
When it comes to analytics, it's not just about the numbers; it's about understanding the story behind them.
With that philosophy in mind, we’re excited to introduce a line of representations to the existing array of chart types in Zoho CRM: Treemap, butterfly, sankey and cluster charts. Let's go!
Treemaps
Treemap charts are used to visually represent hierarchical datasets in a rectangular layout. It aligns its parent categories as larger tiles with their sub-categories nested within them. The size of each tile is proportional to its corresponding value, making it easy to compare different segments within the hierarchy.
This is how a treemap chart looks:

These structured data representations help you understand overall performance and contributions, as well as compare participating entities at a glance.
Unlike traditional bar charts or pie charts, treemaps can be used if your datasets are large and exhibit parent-child relationships.
Here are some examples to better understand their usage:
Comparing revenue distribution between functions
A company's revenue is distributed among its functions before it gets further disbursed to its employees. Treemap charts can be used to depict this distribution and compare it between functions. As you can see below, the hierarchy can be represented as a treemap to compare it directly with other functions:

The hierarchy at the top shows just the numbers and levels, but the treemap chart represents the numbers proportionally, allowing leaders to visualize the difference in distribution.
Interpretation: As you can easily see in the treemap, sales and marketing receive the same amount of revenue, while engineering is given significantly more than the other two.
Likewise, with treemap charts, you can:
- Compare popular lead sources with lead counts is the measure and lead source being the participating entity—a classic single-grouping configuration.
- View cost savings achieved across departments. With the departments as the grouping parameters and the cost saved as the measured amount, the chart lays out all the departments as tiles in proportion, based on money saved.
- Compare ad spends across channels, where channels are the parent grouping and ad spend is the measured unit.
Butterfly
Butterfly charts are used to compare two related datasets side-by-side, resulting in a representation that looks like a butterfly or tornado.
Now, how does it differ from bar charts?
The standard bar chart can compare two entities for a given measure. Say, you are comparing the performance of Mary and Charles. The two users' data is represented using bars, and the length will denote their performances. But, when it comes to comparing their performances over a period or their contribution across different stages, a bar chart is not sufficient.


With butterfly charts, you can:
- Compare revenue between two of your branches each month. With branches being compared for sum of sales revenue, grouped by closing date.
- Compare the performance of two reps in a given quarter. Compared between two users for average of amount of deals, grouped by closing date until today.
In addition to the user-based comparison above, butterfly charts are well-suited to visualizing other types of data comparisons, like:
- Picklist-based comparisons
- Duration-based comparisons
- Aggregate-based comparisons
Business scenario
Comparing the number of deals closed for each lead sources: Duration-based comparison
You can identify the productive lead source by comparing the number of deal closures for every lead source in your organization based on their closing week.

Analyzing effective sales methodology, inbound vs. outbound: Picklist-based comparison
Businesses use both inbound and outbound lead generation strategies, and each of these methods can reap different results based on the season and occasion. By comparing inbound versus outbound each month, you can identify which works best at what time.

Analyze the amount versus the expected revenue between accounts: Aggregate-based comparison
Expected revenue is a result of a deal's progression in the sales pipeline. Comparing the amount versus their expected revenue will not only help visualize the expected revenue of participating accounts but also indicate the accounts' stage in the sales pipeline.

Sankey
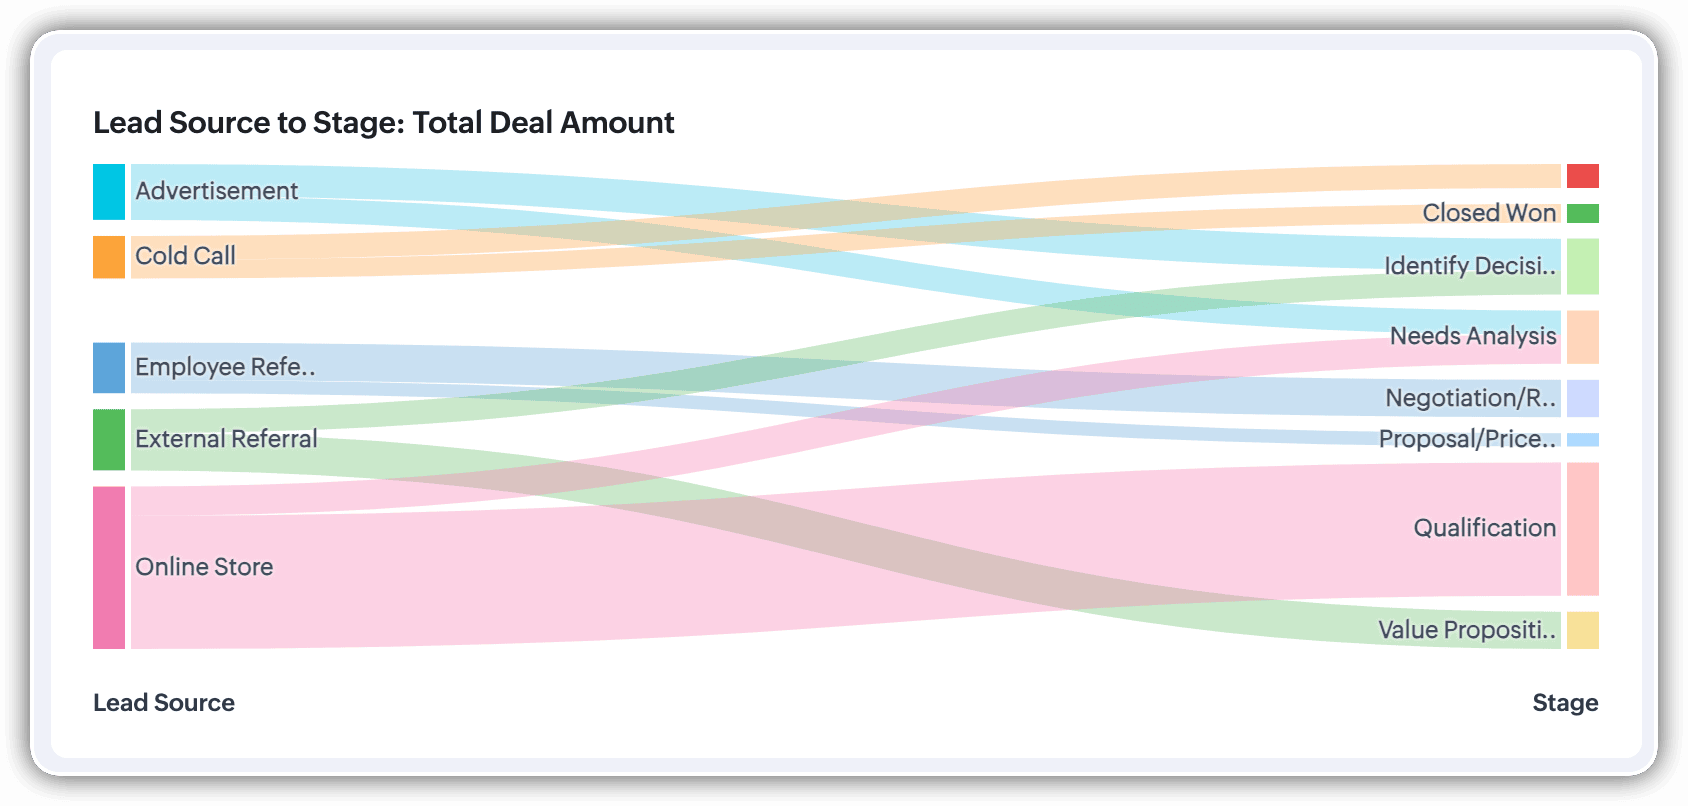
A Sankey Chart is designed to visualize the movement of data across different data groups. Unlike traditional charts—such as bar, column, pie, or donut—that mainly provide a static distribution of values, the Sankey Chart focuses on illustrating the flow between multiple segments or grouping fields. This makes it an ideal choice when you want to track how values (like lead counts, revenue, or deal statuses) move from one category to the next.

Key features
- Flow visualization: With the Sankey Chart, you can observe the movement of data between different groups.
- Multiple grouping fields: This chart works best when you have at least two grouping fields. You can go even further and add a third grouping to see an even more detailed mapping of your data flow.
- Simple configuration: The configuration for the Sankey Chart is as simple as any other chart type in Analytics.
Business scenarios:
Imagine you’re a sales manager trying to get a better handle on your team’s performance and your company’s pipeline. You want to understand not just how many deals are coming in, but also which sources are contributing the most value—and how those deals are progressing through different sales stages.
Let’s say you want to understand which lead sources are driving the most deal activity and how those deals progress through the pipeline. You can create a Sankey chart that maps the count of deals from Lead Source to Stage.

After analyzing the chart, you might notice that Online Store brings in a high volume of early-stage deals, while sources like External Referral contribute fewer deals that are more likely to reach advanced stages like Proposal or Negotiation.
This insight helps you prioritize nurturing the most profitable channels.
Sankey charts can also be helpful in other operational scenarios where understanding transitions across stages or teams is essential:
- Regional revenue distribution: Visualize how revenue flows across different regions, product categories, and their corresponding annual revenue. This helps you compare which regions contribute the most to each product line and where your high-value segments lie.
- Ticket handling flow: Visualize the flow of support tickets from their origin channel to internal departments and finally to resolution statuses. This can reveal workload imbalances or common points of delay in your support process.
Cluster
A cluster chart is similar to stacked column charts, but instead of stacking horizontally, the data is represented as vertical bars. As you create a column chart with multiple groupings, you can change the type of column chart to a cluster chart to achieve this representation.

In the above image, you can see the stacked column chart compares the number of lead conversions based on popular sources between countries. The stacks appearing on top of existing stacks ask you to calibrate the record count (y-axis) based on the previous stacks, which can lead to inaccurate interpretations. In this case, a cluster representation will paint a clearer picture of the analyses.
Other minor enhancements:
In addition to the three charts we mentioned above, we've also made the following minor changes:
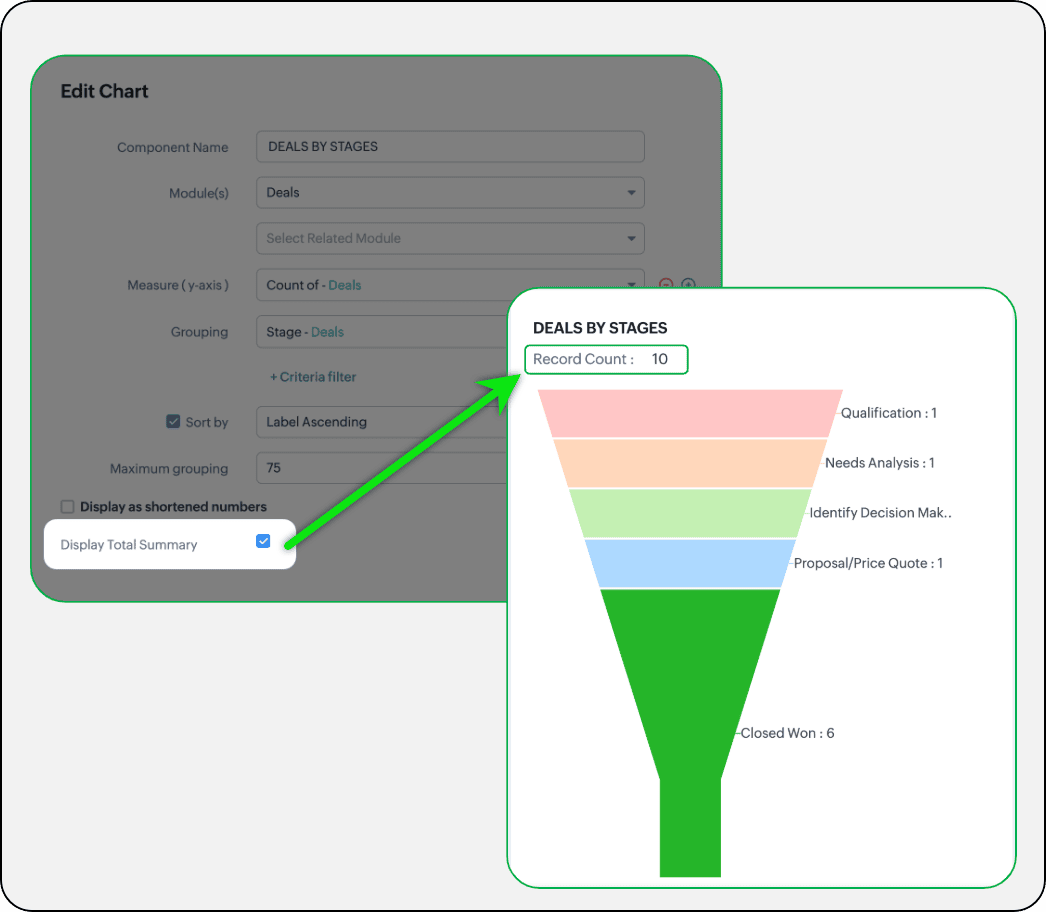
- Display total summary: Thus far, for all charts, each participating measure included labels. Now, to better understand overall contributions, a check box to display the total summary is provided under More options on the Chart Configuration page. Based on the configuration, the total revenue or the rolled-up quantities will be prominently displayed.
- Merge Y-axis: For charts that use two y-axis measurements, the intention is to view the progression of one entity against these two measures. Despite the scale, if the y-axis on the left is disproportionate to the values of the y-axis on the right, the plotted graph will result in a graphically and logically incorrect representation.
As you can see in the image below, the plot area of the sum of amount bar and the sum of expected revenue aligns close together, while, the difference between $700,000 and $40,500 is drastic, creating inaccurate interpretations.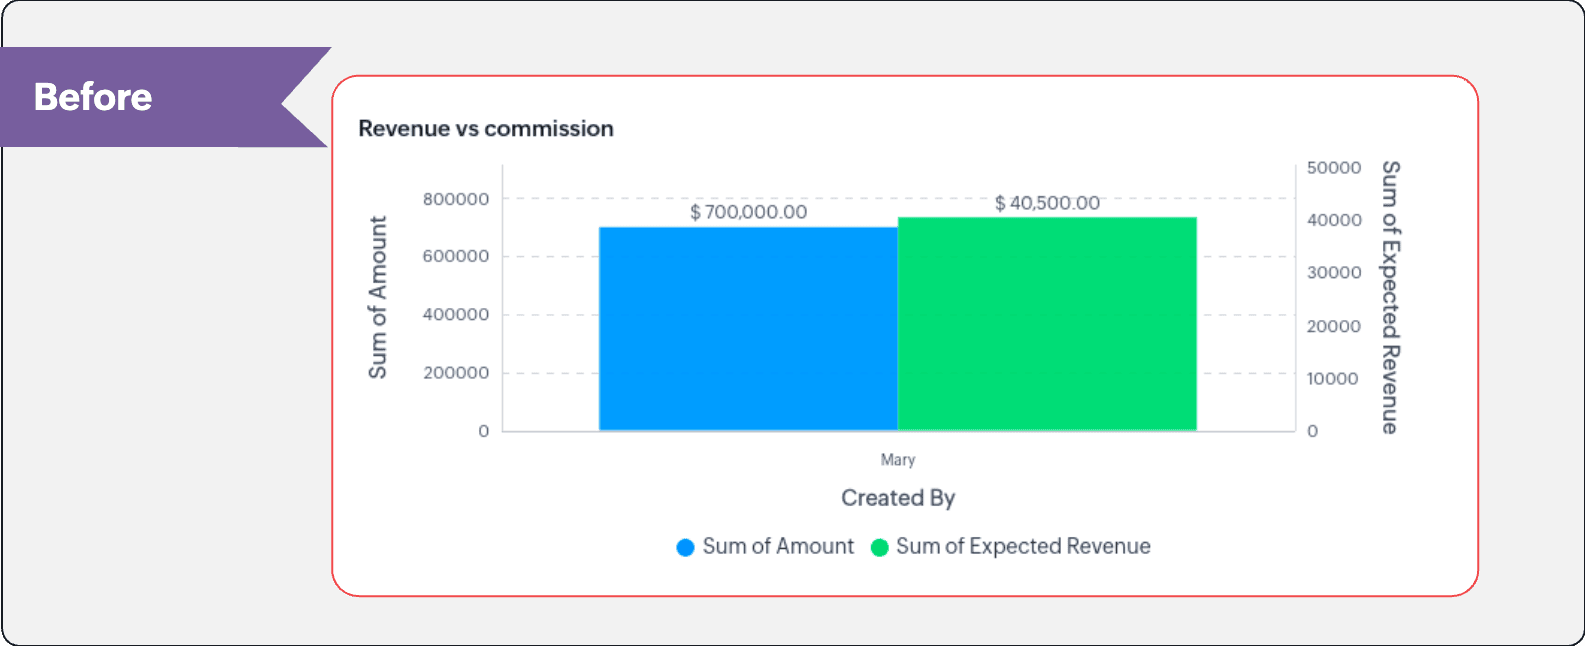
In this enhancement, we're allowing neighboring values of measures to merge so that the interpretation can be more visually accurate.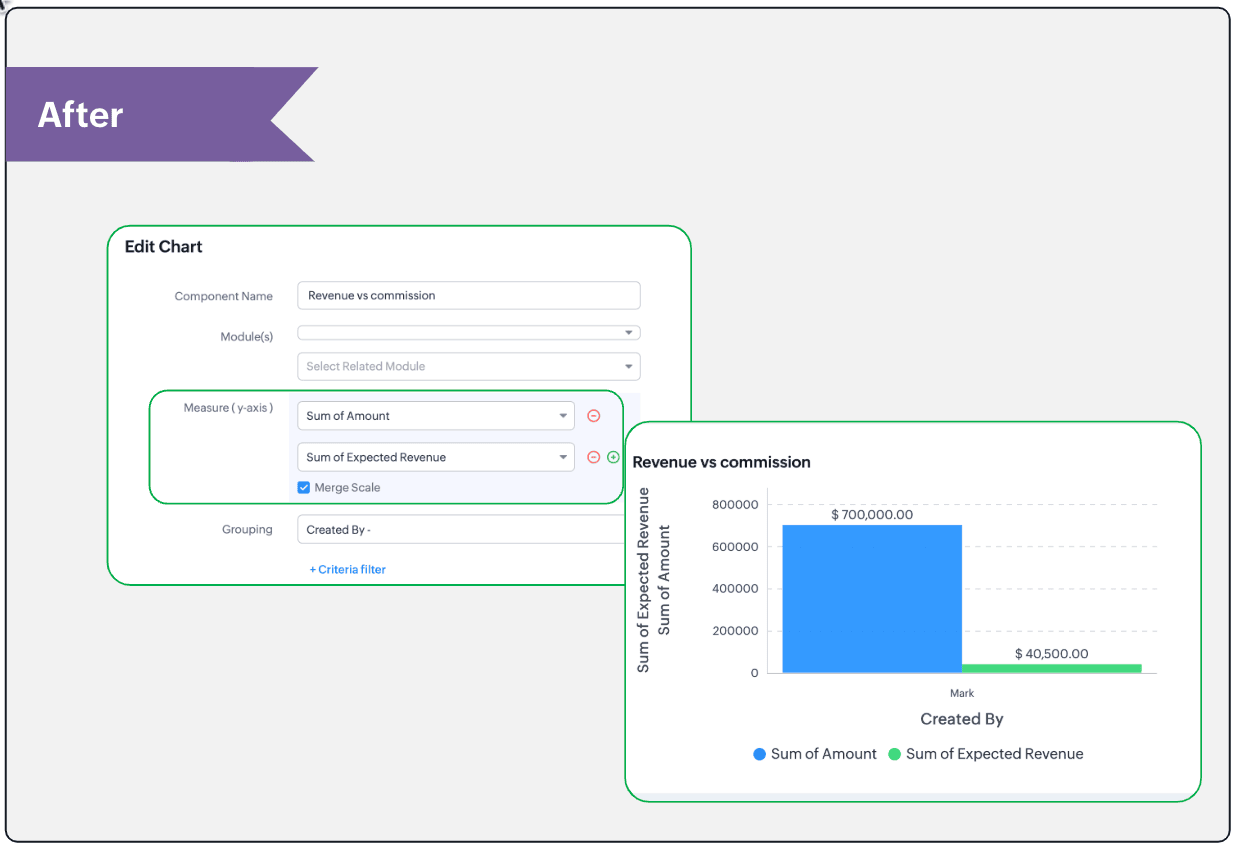
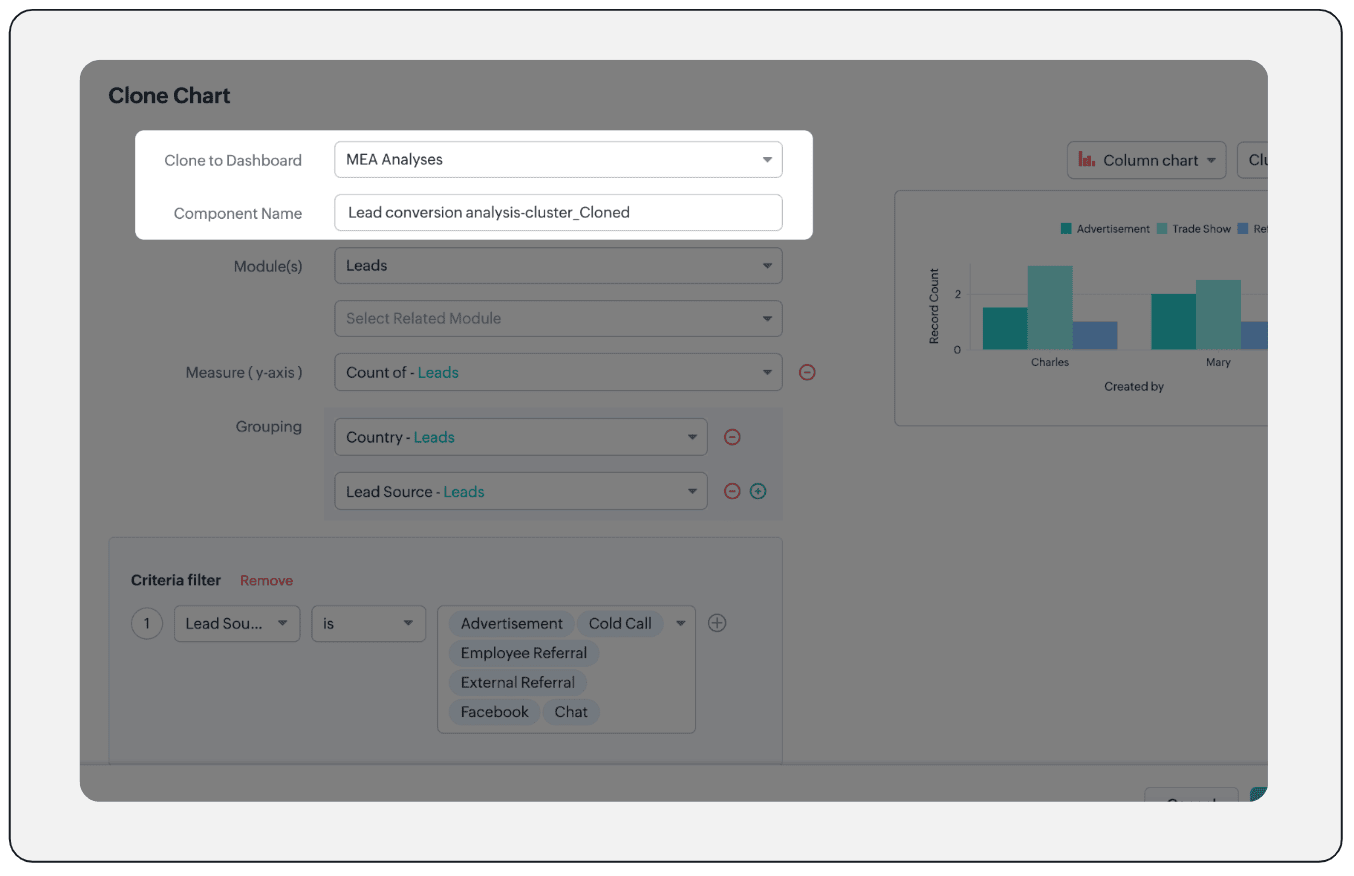
- Clone components to a different dashboard: Dashboards in Analytics serve in unique ways for various audiences—there can be separate dashboards for the sales team, marketing team, engineering team, and so on, and the chances of using the same measure for reference is common. Thus, when you clone a chart, you can now determine the target dashboard in which the cloned chart can be placed.
Resource: Help document
Thanks and have a good one!
Kind regards,
Saranya Balasubramanian
Saranya Balasubramanian
Topic Participants
Saranya Balasubramanian
Sticky Posts
Enhancements to the formula field in Zoho CRM: Auto-refresh formulas with the "Now" function, stop formula executions based on criteria, and include formulas within formulas
Dear Customers, We hope you're well! By their nature, modern businesses rely every day on computations, whether it's to calculate the price of a product, assess ROI, evaluate the lifetime value of a customer, or even determine the age of a record. WithElevate your CX delivery using CommandCenter 2.0: Simplified builder; seamless orchestration
Most businesses want to create memorable customer experiences—but they often find it hard to keep them smooth, especially as they grow. To achieve a state of flow across their processes, teams often stitch together a series of automations using WorkflowPresenting ABM for Zoho CRM: Expand and retain your customers with precision
Picture this scenario: You're a growing SaaS company ready to launch a powerful business suite, and are looking to gain traction and momentum. But as a business with a tight budget, you know acquiring new customers is slow, expensive, and often deliversNimble enhancements to WhatsApp for Business integration in Zoho CRM: Enjoy context and clarity in business messaging
Dear Customers, We hope you're well! WhatsApp for business is a renowned business messaging platform that takes your business closer to your customers; it gives your business the power of personalized outreach. Using the WhatsApp for Business integrationZoho CRM: Sales Rep Professional Certification Program on Coursera
We are happy to share that we have published the Zoho Sales Representative Professional Certificate in partnership with Coursera, a leading platform for online learning and career development that offers access to courses and degrees from leading universities
Recent Topics
Clarity on extended contract status
Clarity on “extended” status- How does Zoho “extend” a contract? E.g. if client extends by 1 month, can the “end date” be adjusted accordingly in Zoho and tagged as “Extended” with a clear audit trail that also captures the client’s email? Note- EmailCustomizing contract status
Can we customize/add/remove status on Zoho contracts ourselves or does Zoho needs to do this? Context- There is a long list of status on Zoho but not all of them are relevant for us . There are few status which are missing and needs to be added. E.g-Set Custom Business Calendars and Holidays for Global Teams
Managing a project across diverse teams means accounting for more than just tasks and deadlines; it means acknowledging how and when each team actually works. Users might follow different working days or observe region-specific holidays that cannot be[Integration edition] Deluge learning series - Integrations between Zoho apps and Third-party services with Deluge | 28 August 2025
We’re excited to welcome you to the Deluge learning series: Integration edition! The Integration edition will run for three months: Session 1 – Integrating Zoho Apps with Deluge using inbuilt integration tasks Session 2 – Integrating Zoho Apps with DelugeCritical Vulnerability in all major password manager plugins - is Zoho Vault affected?
Hi Zoho, a security researcher found a critical clickjacking vulnerability in all major browser password managers: DOM-based Extension Clickjacking: Your Password Manager Data at Risk | Marek Tóth Is Zoho Vault affected as well? Apparently the Vault extensionIntroducing SecureForms in Zoho Vault
Hey everyone, Let’s face it—asking someone to send over a password or other sensitive data is rarely straightforward. You wait. You nudge. You follow up once, twice—maybe more. And when the information finally arrives, it shows up in the worst possibleTables from ZohoSheets remove images when updated from source
I have a few tables from a ZohoSheet in a ZohoWriter document that will remove the images in the cells when I refresh from the source. The source still has the images in the table when I go to refresh. After updating from the source, as you can see theChange eMail Template for Event-Invitations
Hello ZOHO-CRM Team How I can change the eMail Template for Event-Invitations? I work with the German Version of the Free Version. I know how I can modify eMail alerts or Signature Templates, but where I can other eMails modify you send out? Thank you for your answer. Regards, JuergNeed Your Insights
Hi Zoho, I'm confused why the flow only sends to one output. setVariable15 is from a list. It doesn't consider the 2nd entry. Any thoughts?Map Dependency Fields - How can can I limit picklist values from a multi-select Parent field?
I know the "Map Dependency Fields" feature doesn't allow a multi-select parent field. However, I need the functionality. Can I do it through a deluge function, and would it still support color coding picklists? We need the color coding for quick scanningDYK 1 - Color Palette for Enhanced Visual Identification of Status
Introducing the Did You Know series of posts. The goal of this series is to familiarize users with certain features or enhancements in Zoho Projects that may not be evident at first glance. The first post in this series deals with color palettes for indicatingInvalid field in the COQL query
Dear Zoho Support! I believe that you already helped me with a similar problem a few years ago. One of my clients has a custom field named "LOB" in the "Deals" Module (see the field's metadata below). The COQL query using this field: : "select id, Deal_Name,Automating Employee Birthday Notifications in Zoho Cliq
Have you ever missed a birthday and felt like the office Grinch? Fear not, the Cliq Developer Platform has got your back! With Zoho Cliq's Schedulers, you can be the office party-cipant who never forgets a single cake, balloon, or awkward rendition ofTransferring domain registration to new registrar and switching email hosting at the same time?
I need to transfer an existing domain uv cure adhesive that's currently with SiteGround to Porkbun. I also need to move the existing custom email addresses from SiteGround to Zoho Mail. I'm not sure if I should transfer the domain first and then tackleSplit deposits
Can Zoho do split deposits. One deposit, two checks for two separate invoices from different customers. This is one of the most common tasks I can imaging. When I mark the two invoices paid, there are two deposits in bank register. When I try to match,Deactivate Desk Contact without Deleting Contat
We have a client who has multiple tenants for regulatory purposes, and as such, has a few users that have email addresses in both tenants. They've then emailed into the ticketing system, so we have multiple contacts (no big deal, we want to keep theirDelete my store of Zoho commerce
Hi Team, I want to delete my stores of commerce. Please help me asap. Looking for the positive response soon. Thanks Shubham Chauhan Mob: +91-9761872650Ability to add VAT to Retainer Invoices
Hello, I've had a telephone conversation a month ago with Dinesh on this topic and my request to allow for the addition of VAT on Retainer Invoices. It's currently not possible to add VAT to Retainer Invoices and it was mutually agreed that there is absolutely no reason why there shouldn't be, especially as TAX LAW makes VAT mandatory on each invoice in Europe! So basically, what i'm saying is that if you don't allow us to add VAT to Retainer Invoices, than the whole Retainer Invoices becomes[Free Webinar] Learning Table Series - Zoho Creator for Asset Management with AI Enhancements
Hello Everyone! We’re excited to invite you to another edition of Learning Table Series, where we showcase how Zoho Creator empowers industries with innovative and automated solutions. Each month highlights a specific sector, and this time our focus isMenu Building is completely broken
I have been 3 hours, I have not been able to edit the menu. Either it is completely broken, very little intuitive or I do now know anything... There is no way to create a megamenu, no way to create a menu. Despite the fact I go to menu configurartionCan you sell Subscriptions using Zoho Commerce?
In addition to physical products and the apparently coming soon 'Digital Products', it is possible to sell Subscriptions using Zoho Commerce?Kaizen #197: Frequently Asked Questions on GraphQL APIs
🎊 Nearing 200th Kaizen Post – We want to hear from you! Do you have any questions, suggestions, or topics you would like us to cover in future posts? Your insights and suggestions help us shape future content and make this series better for everyone.Multiple Languages for Product Names
Hi, I use 2 languages: spanish and english. I want to have for every product a name in spanish and a name on english. I want to have to possibility of choosing one of these languages when making an invoice or a purchase order. Is there any way to doItem with name in different languate
Hello, is there a way to have an item with its name in different languages? For example: I sell an item in different markets and I'd like to have a Proposal and the Invoice with the Item Name in a specific language. Rino Bertolotto Zoho Specialist, STESA srlContacts with most tickets? Alarm for multiple tickets?
Is it possible to see through the analytics/reports which contacts are creating the most tickets (not the most discussed ones)? Also, is there a way to set up a notification if a contact creates multiple tickets within a certain time frame?Issue with Template Subject Line Format in Zoho CRM
Hi Team, I’ve noticed that when I update the subject line of an email template in Zoho CRM, it sometimes appears in an incorrect format when used. Please see the attached screenshot for reference. Kindly look into this issue and fix this issue from backendTwo Data Labels in Bar Chart
I need to create a bar chart that has both the SUM and COUNT. I've concatenated them into a formula but it converts it into a stacked bar / scattered chart. The bar chart is no longer accessible. Since i'm comparing YOY, it would be best to have it inDisable field on subform row
Hi, Is it currently possible to disable a row item on a subform? I was just trying to do something whereby until another value is entered the field is disable but for the deluge scripting interface threw up an error saying such a function is not supported on a subform. Thanks in advance for your help. ShaheedLeads - Kanban view fit to screen
Hey guys, I created a custom layout for my leads, staged by lead status. I have 10 types of status. In Kanban view I see only 4 columns/stages and need to scroll to the right to see the rest. Is there a way to make columns/stages be displayed all together?Request to Differentiate Auto-Closed WhatsApp Conversations in SalesIQ
Hi Zoho Support, I’d like to raise a request related to the way WhatsApp conversations are auto-closed in SalesIQ. Every Monday, our Sales team has to manually review each closed WhatsApp conversation from the weekend to identify which ones were automaticallyKanban View UI gets a revamp
Hello everyone, In the coming week you will notice design related enhancements in Kanban View. The UI has been changed and a new option is introduced under Kanban View Settings that allows to change the color of the category headers. Please, note that the functionality is not changed. These changes will not apply to the Activities and Visits modules. Here are the details of the changes: 1. The column widths have been fixed to 300 px. The records will have a box around them for clear distinction.Can you stop Custom View Cadences from un-enrolling leads?
I'm testing Cadences for lead nurture. I have set un-enroll properties to trigger on email bounce/unsubscribe, and do NOT have a view criteria un-enroll trigger. However, help documents say that emails are automatically un-enrolled from a Cadence whenIssue with Anchor Link on Zoho Landing Page (Mobile/Tablet View)
Hi Team, I have created a landing page using Zoho Landing Page and added an anchor link to it. The anchor link is working fine on desktop view; however, it does not work properly on mobile or tablet view. I’ve tried debugging this issue in multiple ways,Simplest way to convert XML to a map?
I've reviewed the help info and some great posts on the forum here by Stephen Rhyne (srhyne). At the moment I'm using XPath to generate a list of xml nodes, iterating through that to fetch the field name/value pairs and adding them to a map (one map for each record in the data). I then convert the row map to a string and add it to a list. Here's the function: list xml.getRecordListFromXML(string xml_data, string ele_name) { result = List(); // get list of record nodes rec_list = input.xml_data.toXML().executeXPath("//"Introducing Creator Simplified: An exclusive learning series to enhance your app development skills
Hey Creators! Welcome to Zoho Creator's new learning series, Creator Simplified. In this series, we'll dive into real-world business use cases and explore how to translate your requirements into solutions in your Creator application. You can also expect[Product update] Updated Data Synchronization Process for QuickBooks - Zoho Analytics Integration.
Dear QuickBooks integration users, We’re making an important update in the way data is currently synced in your QuickBooks integration within Analytics workspace. What’s changing: Previously, with every data synchronization, Zoho Analytics used to fetchZoho CRM new calander format cannot strikethrough completed task
Hi, Recently there is a new format for calendar within Zoho CRM However, found out that a completed task will not cross out or strikethrough like previous format. Without strikethrough, it will be difficult to identify which task is still in Open status.How to edit form layout for extension
I am working on extension development. I have created all the fields. I want to rearrange the layout in Sigma platform. But there is no layout module in Sigma. How can I achieve this for extensions other than Zet CLI and putting the fields into widgetEmployees not Users
Hello, We are a construction company that has +180 employees and most of them are in remote location working onsite with no access to internet. Is it possible that we have data stored for all employees but have only 5-10 users who will be in charge of entering employees data? or do we have to pay for all +180 employees? even though they won't be using the system?Zoho people generatimg pdf
Hello , now i want to make a customm button in zoho people that is inside a deduction module , that fetches all the records and generate a pdf with a template that i have done in the mail merges template , i was told that i have to upload template onNext Page