Visualize your data with a new set of charts: Treemap, Butterfly, Sankey, and Cluster charts in Zoho CRM
Dear customers,
When it comes to analytics, it's not just about the numbers; it's about understanding the story behind them.
With that philosophy in mind, we’re excited to introduce a line of representations to the existing array of chart types in Zoho CRM: Treemap, butterfly, sankey and cluster charts. Let's go!
Treemaps
Treemap charts are used to visually represent hierarchical datasets in a rectangular layout. It aligns its parent categories as larger tiles with their sub-categories nested within them. The size of each tile is proportional to its corresponding value, making it easy to compare different segments within the hierarchy.
This is how a treemap chart looks:

These structured data representations help you understand overall performance and contributions, as well as compare participating entities at a glance.
Unlike traditional bar charts or pie charts, treemaps can be used if your datasets are large and exhibit parent-child relationships.
Here are some examples to better understand their usage:
Comparing revenue distribution between functions
A company's revenue is distributed among its functions before it gets further disbursed to its employees. Treemap charts can be used to depict this distribution and compare it between functions. As you can see below, the hierarchy can be represented as a treemap to compare it directly with other functions:

The hierarchy at the top shows just the numbers and levels, but the treemap chart represents the numbers proportionally, allowing leaders to visualize the difference in distribution.
Interpretation: As you can easily see in the treemap, sales and marketing receive the same amount of revenue, while engineering is given significantly more than the other two.
Likewise, with treemap charts, you can:
- Compare popular lead sources with lead counts is the measure and lead source being the participating entity—a classic single-grouping configuration.
- View cost savings achieved across departments. With the departments as the grouping parameters and the cost saved as the measured amount, the chart lays out all the departments as tiles in proportion, based on money saved.
- Compare ad spends across channels, where channels are the parent grouping and ad spend is the measured unit.
Butterfly
Butterfly charts are used to compare two related datasets side-by-side, resulting in a representation that looks like a butterfly or tornado.
Now, how does it differ from bar charts?
The standard bar chart can compare two entities for a given measure. Say, you are comparing the performance of Mary and Charles. The two users' data is represented using bars, and the length will denote their performances. But, when it comes to comparing their performances over a period or their contribution across different stages, a bar chart is not sufficient.


With butterfly charts, you can:
- Compare revenue between two of your branches each month. With branches being compared for sum of sales revenue, grouped by closing date.
- Compare the performance of two reps in a given quarter. Compared between two users for average of amount of deals, grouped by closing date until today.
In addition to the user-based comparison above, butterfly charts are well-suited to visualizing other types of data comparisons, like:
- Picklist-based comparisons
- Duration-based comparisons
- Aggregate-based comparisons
Business scenario
Comparing the number of deals closed for each lead sources: Duration-based comparison
You can identify the productive lead source by comparing the number of deal closures for every lead source in your organization based on their closing week.

Analyzing effective sales methodology, inbound vs. outbound: Picklist-based comparison
Businesses use both inbound and outbound lead generation strategies, and each of these methods can reap different results based on the season and occasion. By comparing inbound versus outbound each month, you can identify which works best at what time.

Analyze the amount versus the expected revenue between accounts: Aggregate-based comparison
Expected revenue is a result of a deal's progression in the sales pipeline. Comparing the amount versus their expected revenue will not only help visualize the expected revenue of participating accounts but also indicate the accounts' stage in the sales pipeline.

Sankey
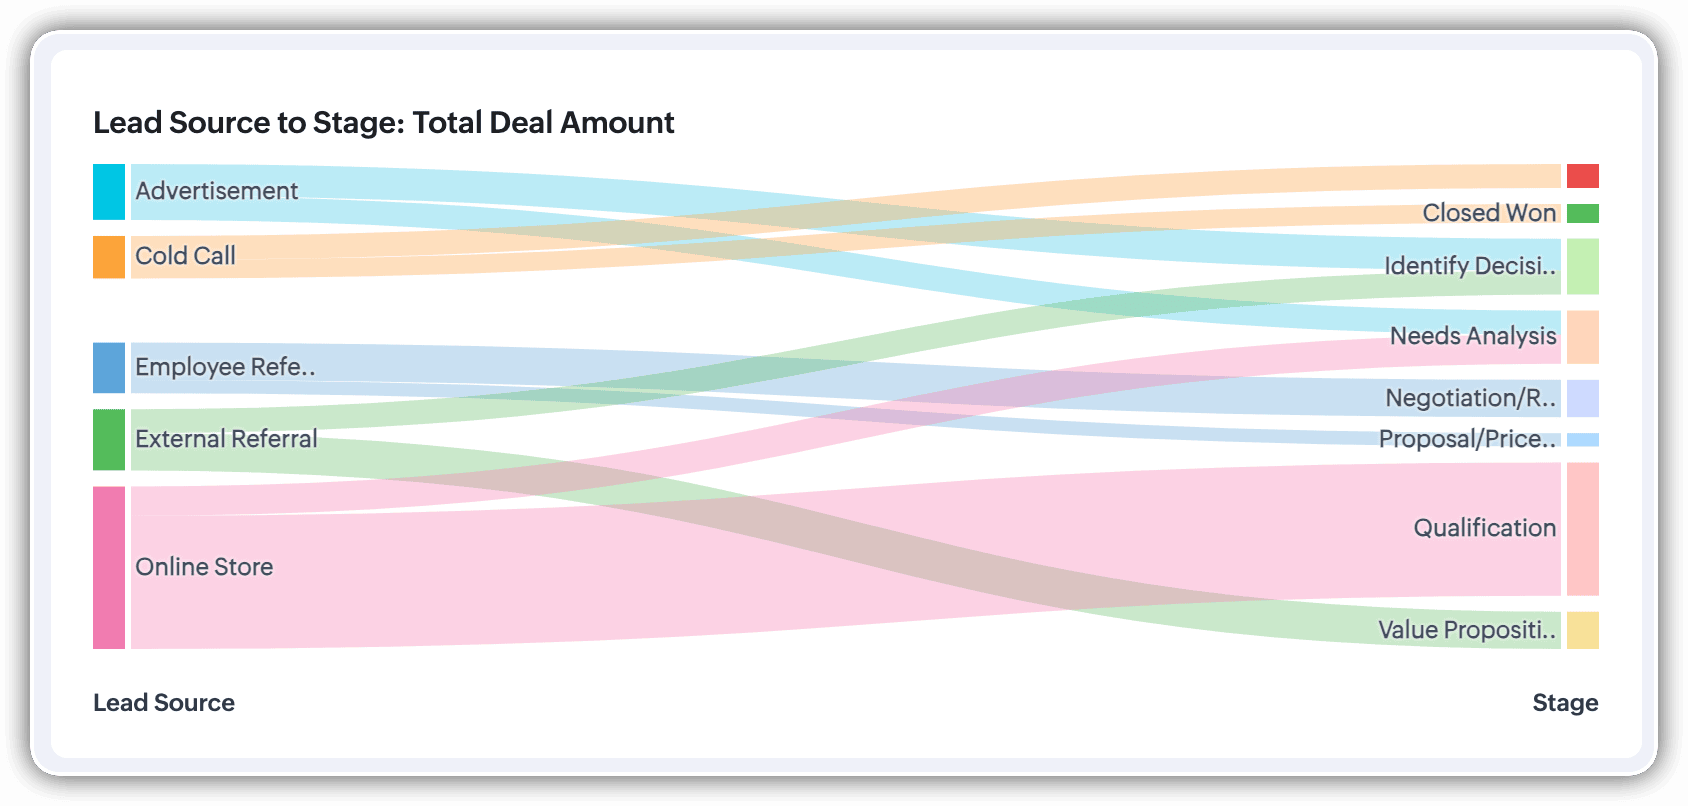
A Sankey Chart is designed to visualize the movement of data across different data groups. Unlike traditional charts—such as bar, column, pie, or donut—that mainly provide a static distribution of values, the Sankey Chart focuses on illustrating the flow between multiple segments or grouping fields. This makes it an ideal choice when you want to track how values (like lead counts, revenue, or deal statuses) move from one category to the next.

Key features
- Flow visualization: With the Sankey Chart, you can observe the movement of data between different groups.
- Multiple grouping fields: This chart works best when you have at least two grouping fields. You can go even further and add a third grouping to see an even more detailed mapping of your data flow.
- Simple configuration: The configuration for the Sankey Chart is as simple as any other chart type in Analytics.
Business scenarios:
Imagine you’re a sales manager trying to get a better handle on your team’s performance and your company’s pipeline. You want to understand not just how many deals are coming in, but also which sources are contributing the most value—and how those deals are progressing through different sales stages.
Let’s say you want to understand which lead sources are driving the most deal activity and how those deals progress through the pipeline. You can create a Sankey chart that maps the count of deals from Lead Source to Stage.

After analyzing the chart, you might notice that Online Store brings in a high volume of early-stage deals, while sources like External Referral contribute fewer deals that are more likely to reach advanced stages like Proposal or Negotiation.
This insight helps you prioritize nurturing the most profitable channels.
Sankey charts can also be helpful in other operational scenarios where understanding transitions across stages or teams is essential:
- Regional revenue distribution: Visualize how revenue flows across different regions, product categories, and their corresponding annual revenue. This helps you compare which regions contribute the most to each product line and where your high-value segments lie.
- Ticket handling flow: Visualize the flow of support tickets from their origin channel to internal departments and finally to resolution statuses. This can reveal workload imbalances or common points of delay in your support process.
Cluster
A cluster chart is similar to stacked column charts, but instead of stacking horizontally, the data is represented as vertical bars. As you create a column chart with multiple groupings, you can change the type of column chart to a cluster chart to achieve this representation.

In the above image, you can see the stacked column chart compares the number of lead conversions based on popular sources between countries. The stacks appearing on top of existing stacks ask you to calibrate the record count (y-axis) based on the previous stacks, which can lead to inaccurate interpretations. In this case, a cluster representation will paint a clearer picture of the analyses.
Other minor enhancements:
In addition to the three charts we mentioned above, we've also made the following minor changes:
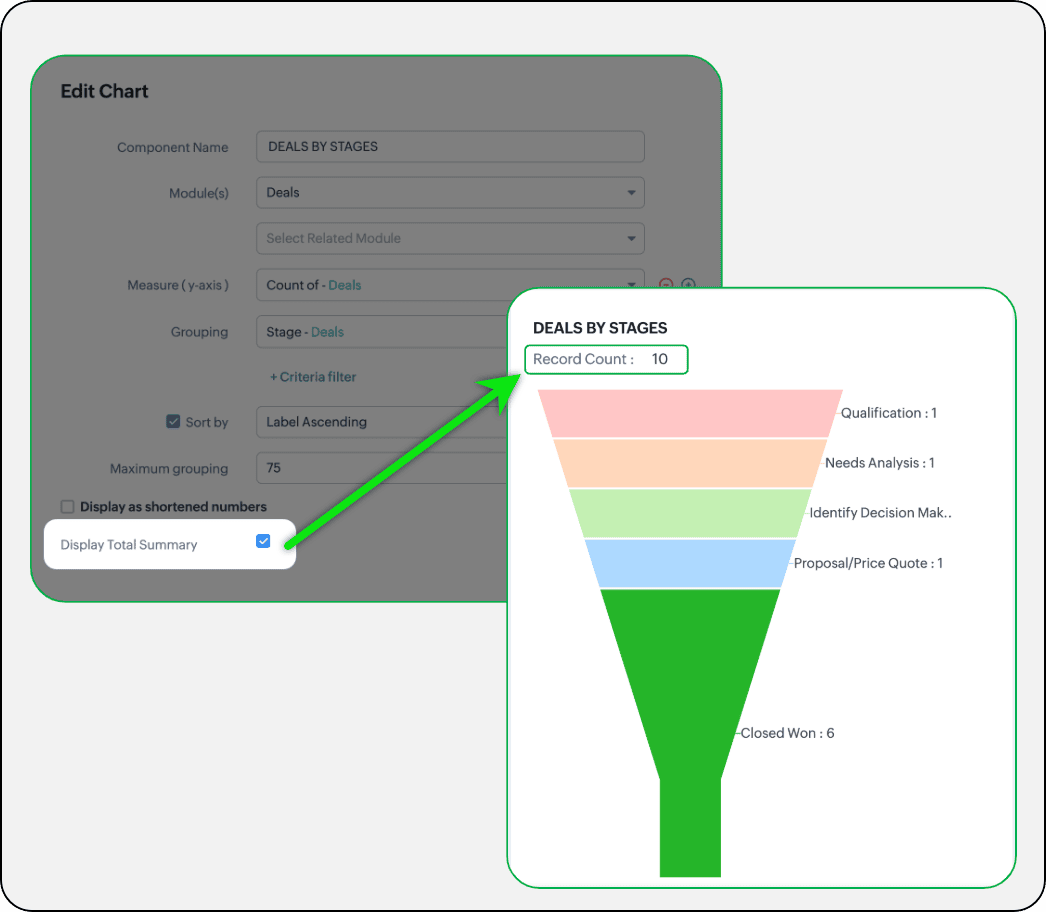
- Display total summary: Thus far, for all charts, each participating measure included labels. Now, to better understand overall contributions, a check box to display the total summary is provided under More options on the Chart Configuration page. Based on the configuration, the total revenue or the rolled-up quantities will be prominently displayed.
- Merge Y-axis: For charts that use two y-axis measurements, the intention is to view the progression of one entity against these two measures. Despite the scale, if the y-axis on the left is disproportionate to the values of the y-axis on the right, the plotted graph will result in a graphically and logically incorrect representation.
As you can see in the image below, the plot area of the sum of amount bar and the sum of expected revenue aligns close together, while, the difference between $700,000 and $40,500 is drastic, creating inaccurate interpretations.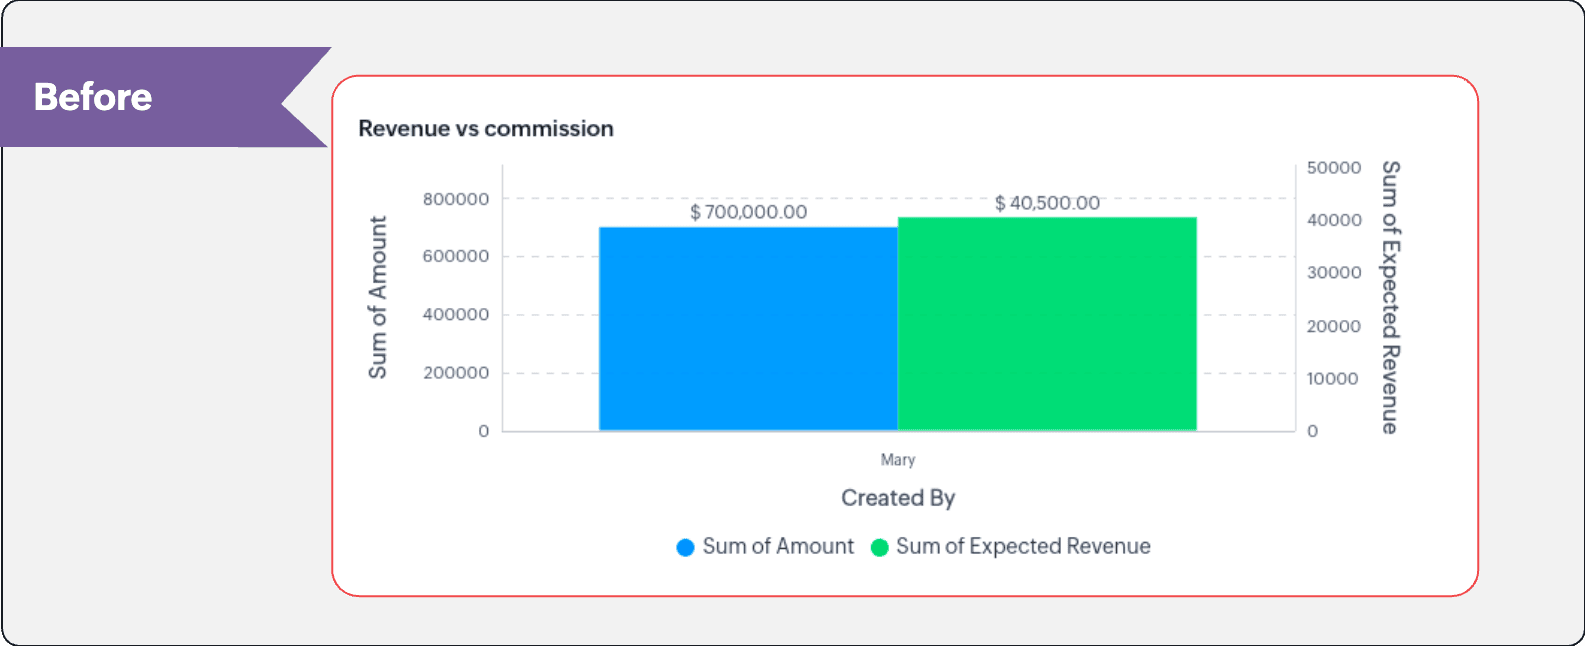
In this enhancement, we're allowing neighboring values of measures to merge so that the interpretation can be more visually accurate.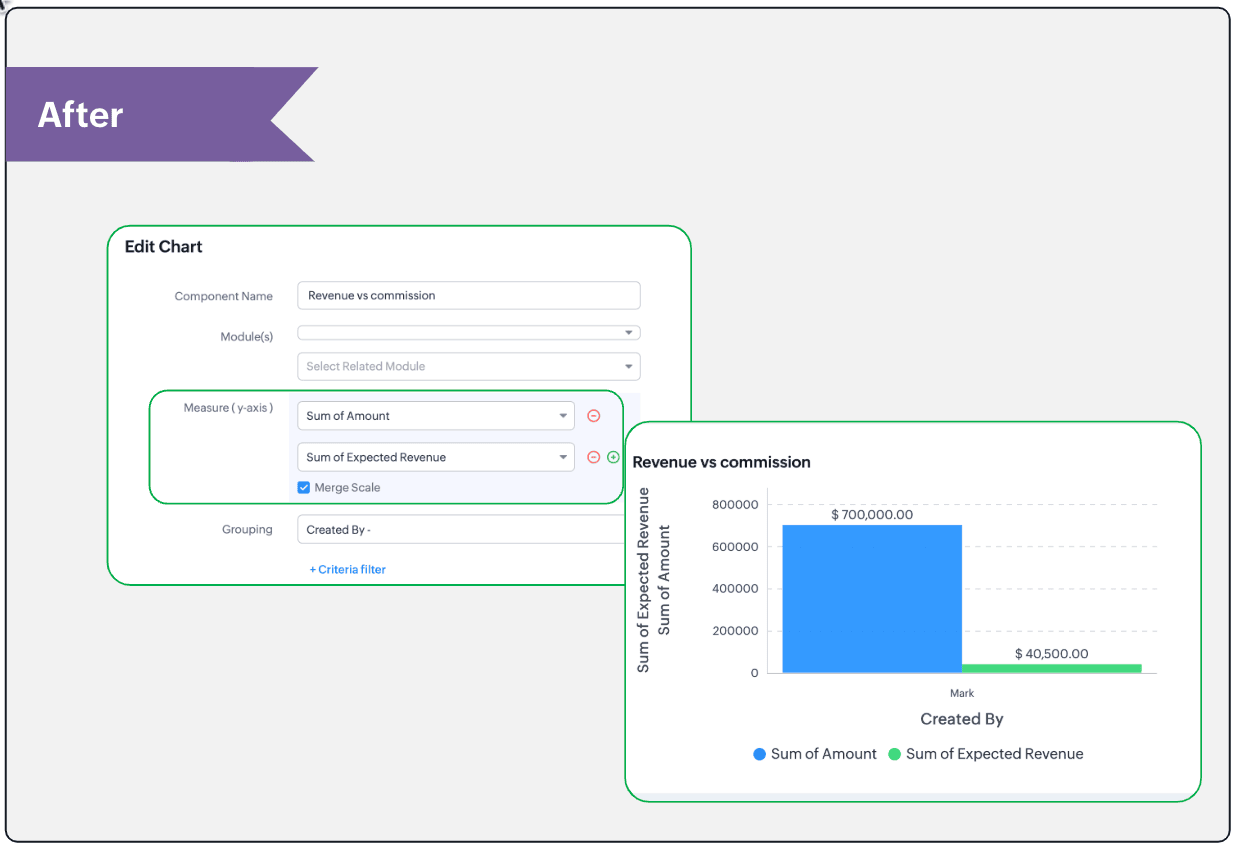
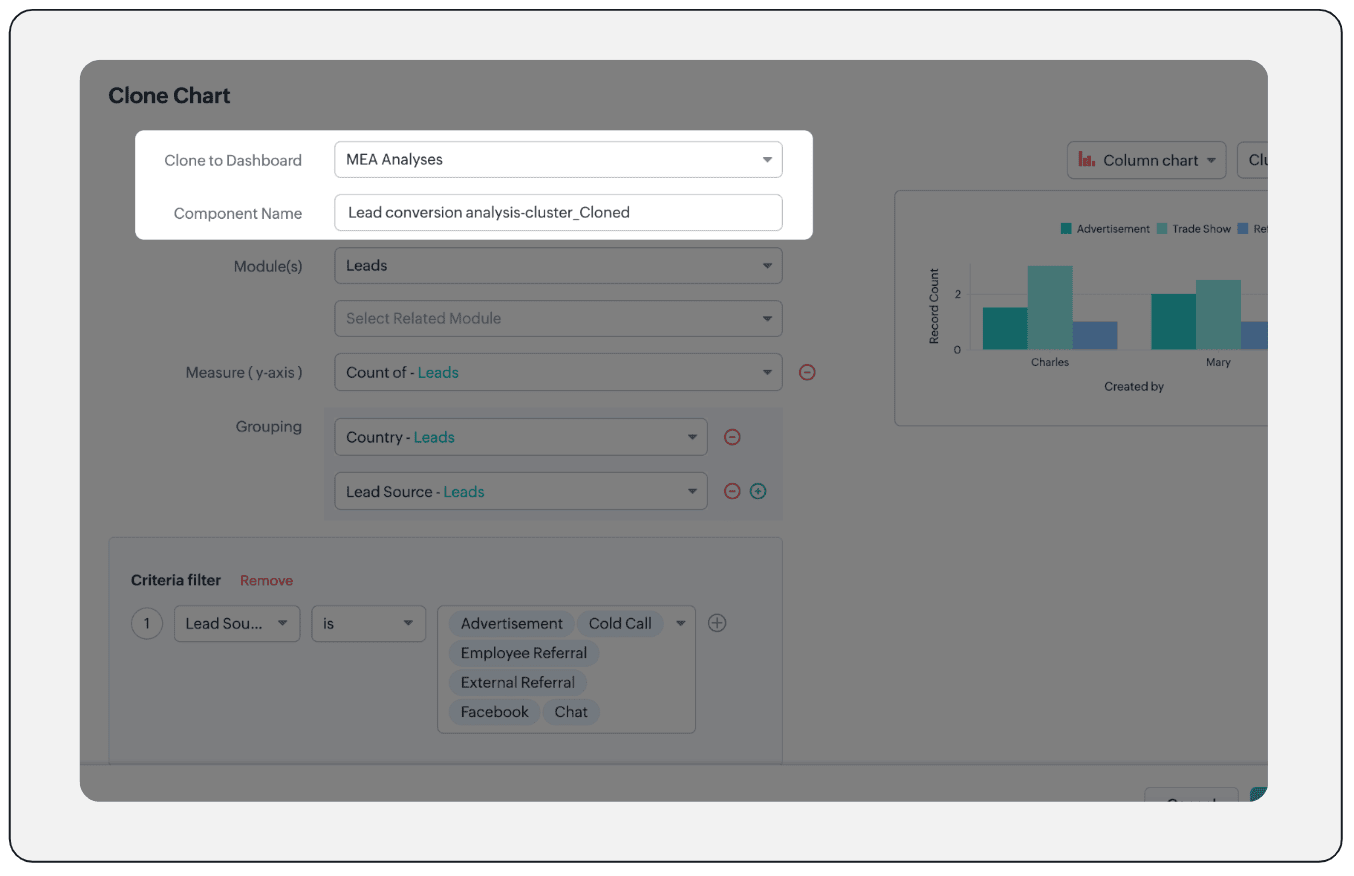
- Clone components to a different dashboard: Dashboards in Analytics serve in unique ways for various audiences—there can be separate dashboards for the sales team, marketing team, engineering team, and so on, and the chances of using the same measure for reference is common. Thus, when you clone a chart, you can now determine the target dashboard in which the cloned chart can be placed.
Resource: Help document
Thanks and have a good one!
Kind regards,
Saranya Balasubramanian
Saranya Balasubramanian
Topic Participants
Saranya Balasubramanian
Sticky Posts
Nimble enhancements to WhatsApp for Business integration in Zoho CRM: Enjoy context and clarity in business messaging
Dear Customers, We hope you're well! WhatsApp for business is a renowned business messaging platform that takes your business closer to your customers; it gives your business the power of personalized outreach. Using the WhatsApp for Business integrationGood news! Calendar in Zoho CRM gets a face lift
Dear Customers, We are delighted to unveil the revamped calendar UI in Zoho CRM. With a complete visual overhaul aligned with CRM for Everyone, the calendar now offers a more intuitive and flexible scheduling experience. What’s new? Distinguish activitiesConsumers are talking about your business. Are you listening?👂
A loyal customer might be praising your product in a forum. A frustrated user could be posting a harsh review on a public site. An excited partner may have left a comment on your campaign. A domain expert might be deconstructing your product. A prospectEnhancements to the formula field in Zoho CRM: Auto-refresh formulas with the "Now" function, stop formula executions based on criteria, and include formulas within formulas
Dear Customers, We hope you're well! By their nature, modern businesses rely every day on computations, whether it's to calculate the price of a product, assess ROI, evaluate the lifetime value of a customer, or even determine the age of a record. WithElevate your CX delivery using CommandCenter 2.0: Simplified builder; seamless orchestration
Most businesses want to create memorable customer experiences—but they often find it hard to keep them smooth, especially as they grow. To achieve a state of flow across their processes, teams often stitch together a series of automations using Workflow
Recent Topics
Introducing Lead Capture: Empower exhibitors to capture leads effortlessly
Events provide a great opportunity for exhibitors to generate awareness and engage with potential customers. Efficiently distributing attendee information to exhibitors through a seamless and secure way is of paramount importance. Introducing Lead Capturedealing with post dated cheques
Hi, can you help me please the best way to deal with this We sell an item of three months duration that is paid for with post dated cheques in monthly stages example - item is sold £3000 Cheque 1 is for £1000 due at time of sale (say Sept) cheque 2 is dated 25th of next month (Oct) cheque 3 is dated 25th of next month +1 (Nov) Now, with invoice number one it's simple - i send a standard invoice as usual But with the other two here's what i want zoho to do next month i want it to send an invoice onUsing Contains as a filter
We are using Zoho Reports, ServiceDesk Plus analytics. I do not see how to create a report filter using Contains comparison of a string values, is one string contained in another. For example, Task Title contains the word Monitor. Is this possible in Zoho Reports? This reporting feature is available in SDP reporting. Thanks in advance, Craig RiceMass import of documents into Zoho Writer
I'm using Google's word processor at the moment but feel that Zoho does a better job (on the online apps market). Iwant to move my documents (about 50-70) to Zoho but it seems to me that I have to import them seperately. Is it already possible to upload several documents at a time or is this a forthcoming feature? Cheers Rolli :?:Set off Unearned Revenue
Hi, I would like to get a clarification on the below. I have an opening balance of BD.725/- in my Unearned Revenue A/c which includes the overpayments of 6 clients. No One of my clients settled his invoices by paying the value of the invoice less theHow Zoho Desk contributes to the art of savings
Remember the first time your grandmother gave you cash for a birthday or New Year's gift, Christmas gift, or any special day? You probably tucked that money safely into a piggy bank, waiting for the day you could buy something precious or something youZoho Connect Module in Zoho Trident
Hi I really like where Zoho Trident is going. Having Mail and Cliq in one place is especially powerful. However, Zoho Connect really needs to be included to make this a true communication and collaboration hub. I would like to request that Zoho ConnectAdd Webhook Response Module to Zoho Flow
Hi Zoho Flow Team, We’d like to request a Webhook Response capability for Zoho Flow that can return a dynamic, computed reply to the original webhook caller after / during the flow runs. What exists today Zoho Flow’s webhook trigger can send custom acknowledgementsZoho Inventory - Managing Items With Multiple Suppliers
Hi community, I'm working on a project at the moment for a car parts wholesale business. Each Item (part) has its own original manufacturer part number (sometimes more than one part number for the same item). When purchasing parts from 3rd party suppliers,Installing EMAIL Setup in New Domain
Respected Support team, I'm facing an issue with cloudflare in Pakistan, I want to setup Zoho Mail Setup but I Don't know how to enable Zoho mail setup without cloudflare. My Website https://stumbleguyzzapk.com/, https://fakservices.com/ is using CF,Fill Colors
Hello, Just curious, is it possible to manage the Used and standard colors in the fill drop down menu ? I would like to change/edit them is possible to colors I frequently use. Thanks for you reply, BruceWhen moments in customer support get "spooky"
It’s Halloween again! Halloween is celebrated with spooky symbols and meanings based on history and traditions, with each region adding its own special touch. While we were kids, we would dress up in costumes along with friends, attend parties, and enjoyHow can I delete duplicate transactions?
I want to delete the duplicates not simply exclude them. I have duplicates, because I had automatic bank feeds turned on (had to make sure this critical functionality was working before migrating to Zoho). Now when I import my csv's exported from Wave,Python - code studio
Hi, I see the code studio is "coming soon". We have some files that will require some more complex transformation, is this feature far off? It appears to have been released in Zoho Analytics alreadyMultiple email addresses
Multiple email addresses: I understand there is the ability to add an additional email field to a contact, but the functionality here needs to be drastically revised. Currently, this second email address does not log under the contact email history, nor is it available as a send address when using the Send Mail button within CRM. We recently migrated from GoldMine. I hate GoldMine, but there is one thing they did well: Email. I suggest copying them. Change the email field to an editable picklist,Move orders scan ISBN
Hi We have ISBN setup to be searched in items zoho but move orders dissent recognize the ISBN is there q missing configuration? regards, JSViewID and Zoho Desk API
I'm looking at the documentation for Listing contacts and it looks like you can filter by ViewID. I assume this is views created in a department or all departments. Is this correct? And if so, how do I find the ViewID for that view? EDIT: I see the viewAbility to Link Reported Issues from Zoho Desk to Specific Tasks or Subtasks in Zoho Projects
Hi Zoho Desk Team, Hope you're doing well. When reporting a bug from Zoho Desk to Zoho Projects, we’ve noticed that it’s currently not possible to select an existing task or subtask to associate the issue with. However, when working directly inside ZohoPrint Tickets
We have field engineers who visit customers. We would like the option to print a job sheet with full details of the job and account/contact details.Zoho Desk integration with Power BI
Hi, I want to be able to create a Power BI report which has live updates of ticket data from zoho desk, is this possile at all? Thanks JackAbility to Attach Images When Reporting Issues to Zoho Projects from Zoho Desk
Hi Zoho Desk Team, Hope you’re doing well. We’re using the Zoho Desk–Zoho Projects integration to report bugs directly from support tickets into the Zoho Projects issue tracker. This integration is extremely useful and helps us maintain smooth coordinationAbility to Choose Task List and Add Subtasks When Creating Tasks from Zoho Desk
Hi Zoho Desk Team, Hope you’re doing well. We’re using the Zoho Desk–Zoho Projects integration to seamlessly connect customer tickets with project tasks. While the integration works great overall, we noticed two important limitations that affect our workflowSync Task Status from Zoho Projects to Zoho Desk
Hi Zoho Desk Team, Hope you’re doing well. We’re actively using the Zoho Desk–Zoho Projects integration, which helps our support and project teams stay aligned. However, we noticed that when we change a task’s status in Zoho Projects, the change is notDefault/Private Departments in Zoho Desk
1) How does one configure a department to be private? 2) Also, how does one change the default department? 1) On the list of my company's Zoho Departments, I see that we have a default department, but I am unable to choose which department should be default. 2) From the Zoho documentation I see that in order to create a private department, one should uncheck "Display in customer portal" on the Add Department screen. However, is there a way to change this setting after the department has been created?Zoho CRM IP Addresses to Whitelist
We were told to whitelist IP addresses from Zoho CRM. (CRM, not Zoho Mail.) What is the current list of IP Addresses to whitelist for outbound mail? Is there a website where these IP addresses are published and updated? Everything I could find is overColor of Text Box Changes
Sometimes I find the color of text boxes changed to a different color. This seems to happen when I reopen the same slide deck later. In the image that I am attaching, you see that the colors of the whole "virus," the "irology" part of "virology," andThe difference between Zoho Marketing Automation and Zoho Campaigns
Greetings Marketers! This post aims to differentiate between Zoho Marketing Automation and Zoho Campaigns. By the time you get to the end of the post, you will be able to choose a product that objectively suits you. What is Zoho Marketing Automation?How to use Rollup Summary in a Formula Field?
I created a Rollup Summary (Decimal) field in my module, and it shows values correctly. When I try to reference it in a Formula Field (e.g. ${Deals.Partners_Requested} - ${Deals.Partners_Paid}), I get the error that the field can’t be found. Is it possibleZoho Mail Android app update - View emails shared via Permalink on the app.
Hello everyone! In the latest version(v2.8.2) of the Zoho Mail Android app update, we have brought in support to access the emails shared via permalink within the app. Earlier, when you click the permalink of an email, you'll be redirected to a mobileLet us view and export the full price books data from CRM
I quote out of CRM, some of my clients have specialised pricing for specific products - therefore we use Price Books to manage these special prices. I can only see the breakdown of the products listed in the price book and the specialised pricing forWeekly Tips: Manage External Images in Zoho Mail
When you receive emails every day, whether from clients, newsletters, or services, many of them contain external images that automatically load when you open the message. While this can make emails look more engaging, it can also impact your privacy andHow to display Motivator components in Zoho CRM home page ?
Hello, I created KPI's, games and so but I want to be able to see my KPI's and my tasks at the same time. Is this possible to display Motivator components in Zoho CRM home page ? Has someone any idea ? Thanks for your help.Introducing Record Summary: smarter insights at your fingertips
Hello everyone, We’re excited to introduce the Record Summary feature. This powerful addition makes use of Zia to simplify how you interact with your CRM data, providing a seamless, consolidated view of critical record information. Scrolling through theAccount in Quick View Filter
I have a report that I often run against a specific Account. Every time, I have to go into the edit menu and change the Advanced Filter. I would prefer to use the Quick View Filter, but it does not allow me to use the one and only field that makes anyUnable to confirm Super Admin assignment — confirmation button not working
I’m trying to change the roles within my organization. I am currently a super admin and would like to add another user as a super admin. When I attempt to confirm the action, a screen appears asking for my password to verify my identity. However, whenDelegates should be able to delete expenses
I understand the data integrity of this request. It would be nice if there was a toggle switch in the Policy setting that would allow a delegate to delete expenses from their managers account. Some managers here never touch their expense reports, andFunction #9: Copy attachments of Sales Order to Purchase Order on conversion
This week, we have written a custom function that automatically copies the attachments uploaded for a sales order to the corresponding purchase order after you convert it. Here's how to configure it in your Zoho Books organization. Custom Function: HitKaizen #8 - Handling Recurrence and Participants in the Events Module via API
Hello everyone! We are back this week with an exciting post—Handling recurrence and participants in the Events module through API. First things first—What is the Events module? "Events" is a part of the Activities module in Zoho CRM. An event is an activity that happens at a given place and time. You can find Events on the user's Zoho CRM's home page, Activities home page, Calendar, and in other related records. What are the types of Events? Events are of two types—Recurring and non-recurring events.Marketer’s Space - Get Holiday-Ready with Zoho Campaigns
Hello marketers, Welcome back to another post in Marketer’s Space! Q4 is packed with opportunities to connect with your audience - from Halloween, Black Friday, and Cyber Monday, to Thanksgiving, Christmas, and New Year. In this post, we’ll look at howPersonalized demo
can I know more about the personalized demo we are construction company andNext Page