Visualize your data with a new set of charts: Treemap, Butterfly, Sankey, and Cluster charts in Zoho CRM
Dear customers,
When it comes to analytics, it's not just about the numbers; it's about understanding the story behind them.
With that philosophy in mind, we’re excited to introduce a line of representations to the existing array of chart types in Zoho CRM: Treemap, butterfly, sankey and cluster charts. Let's go!
Treemaps
Treemap charts are used to visually represent hierarchical datasets in a rectangular layout. It aligns its parent categories as larger tiles with their sub-categories nested within them. The size of each tile is proportional to its corresponding value, making it easy to compare different segments within the hierarchy.
This is how a treemap chart looks:

These structured data representations help you understand overall performance and contributions, as well as compare participating entities at a glance.
Unlike traditional bar charts or pie charts, treemaps can be used if your datasets are large and exhibit parent-child relationships.
Here are some examples to better understand their usage:
Comparing revenue distribution between functions
A company's revenue is distributed among its functions before it gets further disbursed to its employees. Treemap charts can be used to depict this distribution and compare it between functions. As you can see below, the hierarchy can be represented as a treemap to compare it directly with other functions:

The hierarchy at the top shows just the numbers and levels, but the treemap chart represents the numbers proportionally, allowing leaders to visualize the difference in distribution.
Interpretation: As you can easily see in the treemap, sales and marketing receive the same amount of revenue, while engineering is given significantly more than the other two.
Likewise, with treemap charts, you can:
- Compare popular lead sources with lead counts is the measure and lead source being the participating entity—a classic single-grouping configuration.
- View cost savings achieved across departments. With the departments as the grouping parameters and the cost saved as the measured amount, the chart lays out all the departments as tiles in proportion, based on money saved.
- Compare ad spends across channels, where channels are the parent grouping and ad spend is the measured unit.
Butterfly
Butterfly charts are used to compare two related datasets side-by-side, resulting in a representation that looks like a butterfly or tornado.
Now, how does it differ from bar charts?
The standard bar chart can compare two entities for a given measure. Say, you are comparing the performance of Mary and Charles. The two users' data is represented using bars, and the length will denote their performances. But, when it comes to comparing their performances over a period or their contribution across different stages, a bar chart is not sufficient.


With butterfly charts, you can:
- Compare revenue between two of your branches each month. With branches being compared for sum of sales revenue, grouped by closing date.
- Compare the performance of two reps in a given quarter. Compared between two users for average of amount of deals, grouped by closing date until today.
In addition to the user-based comparison above, butterfly charts are well-suited to visualizing other types of data comparisons, like:
- Picklist-based comparisons
- Duration-based comparisons
- Aggregate-based comparisons
Business scenario
Comparing the number of deals closed for each lead sources: Duration-based comparison
You can identify the productive lead source by comparing the number of deal closures for every lead source in your organization based on their closing week.

Analyzing effective sales methodology, inbound vs. outbound: Picklist-based comparison
Businesses use both inbound and outbound lead generation strategies, and each of these methods can reap different results based on the season and occasion. By comparing inbound versus outbound each month, you can identify which works best at what time.

Analyze the amount versus the expected revenue between accounts: Aggregate-based comparison
Expected revenue is a result of a deal's progression in the sales pipeline. Comparing the amount versus their expected revenue will not only help visualize the expected revenue of participating accounts but also indicate the accounts' stage in the sales pipeline.

Sankey
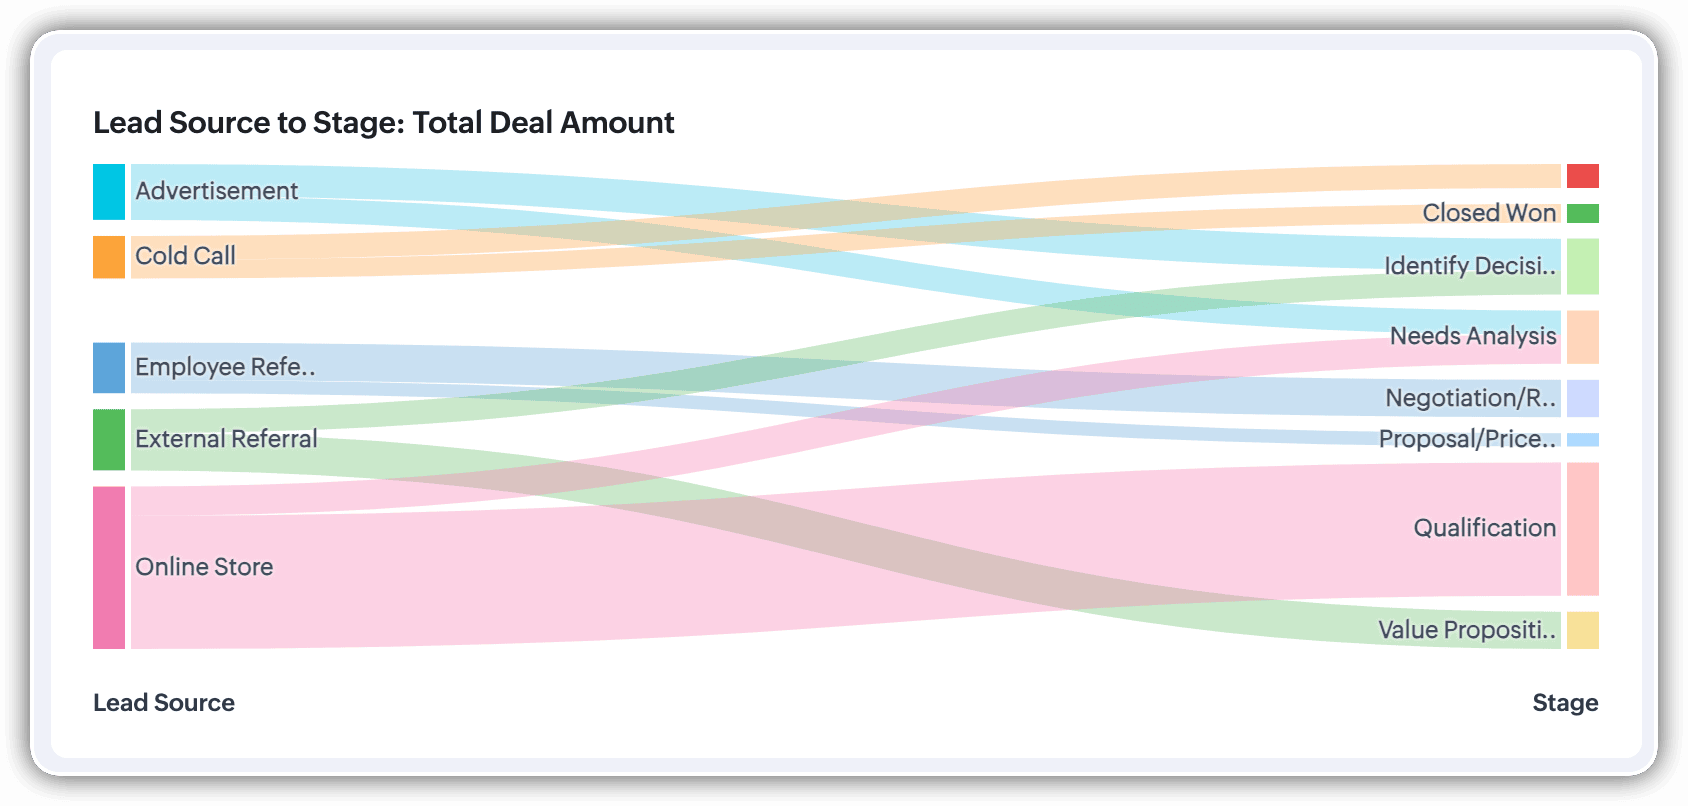
A Sankey Chart is designed to visualize the movement of data across different data groups. Unlike traditional charts—such as bar, column, pie, or donut—that mainly provide a static distribution of values, the Sankey Chart focuses on illustrating the flow between multiple segments or grouping fields. This makes it an ideal choice when you want to track how values (like lead counts, revenue, or deal statuses) move from one category to the next.

Key features
- Flow visualization: With the Sankey Chart, you can observe the movement of data between different groups.
- Multiple grouping fields: This chart works best when you have at least two grouping fields. You can go even further and add a third grouping to see an even more detailed mapping of your data flow.
- Simple configuration: The configuration for the Sankey Chart is as simple as any other chart type in Analytics.
Business scenarios:
Imagine you’re a sales manager trying to get a better handle on your team’s performance and your company’s pipeline. You want to understand not just how many deals are coming in, but also which sources are contributing the most value—and how those deals are progressing through different sales stages.
Let’s say you want to understand which lead sources are driving the most deal activity and how those deals progress through the pipeline. You can create a Sankey chart that maps the count of deals from Lead Source to Stage.

After analyzing the chart, you might notice that Online Store brings in a high volume of early-stage deals, while sources like External Referral contribute fewer deals that are more likely to reach advanced stages like Proposal or Negotiation.
This insight helps you prioritize nurturing the most profitable channels.
Sankey charts can also be helpful in other operational scenarios where understanding transitions across stages or teams is essential:
- Regional revenue distribution: Visualize how revenue flows across different regions, product categories, and their corresponding annual revenue. This helps you compare which regions contribute the most to each product line and where your high-value segments lie.
- Ticket handling flow: Visualize the flow of support tickets from their origin channel to internal departments and finally to resolution statuses. This can reveal workload imbalances or common points of delay in your support process.
Cluster
A cluster chart is similar to stacked column charts, but instead of stacking horizontally, the data is represented as vertical bars. As you create a column chart with multiple groupings, you can change the type of column chart to a cluster chart to achieve this representation.

In the above image, you can see the stacked column chart compares the number of lead conversions based on popular sources between countries. The stacks appearing on top of existing stacks ask you to calibrate the record count (y-axis) based on the previous stacks, which can lead to inaccurate interpretations. In this case, a cluster representation will paint a clearer picture of the analyses.
Other minor enhancements:
In addition to the three charts we mentioned above, we've also made the following minor changes:
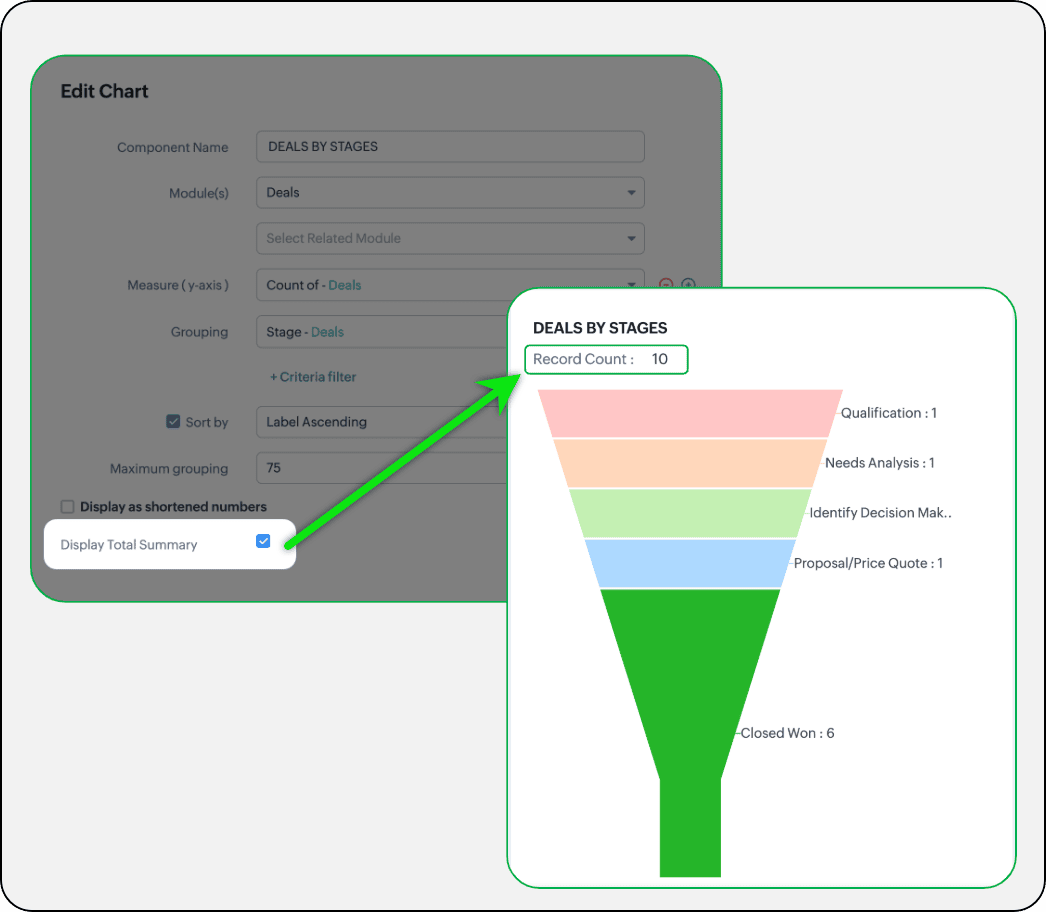
- Display total summary: Thus far, for all charts, each participating measure included labels. Now, to better understand overall contributions, a check box to display the total summary is provided under More options on the Chart Configuration page. Based on the configuration, the total revenue or the rolled-up quantities will be prominently displayed.
- Merge Y-axis: For charts that use two y-axis measurements, the intention is to view the progression of one entity against these two measures. Despite the scale, if the y-axis on the left is disproportionate to the values of the y-axis on the right, the plotted graph will result in a graphically and logically incorrect representation.
As you can see in the image below, the plot area of the sum of amount bar and the sum of expected revenue aligns close together, while, the difference between $700,000 and $40,500 is drastic, creating inaccurate interpretations.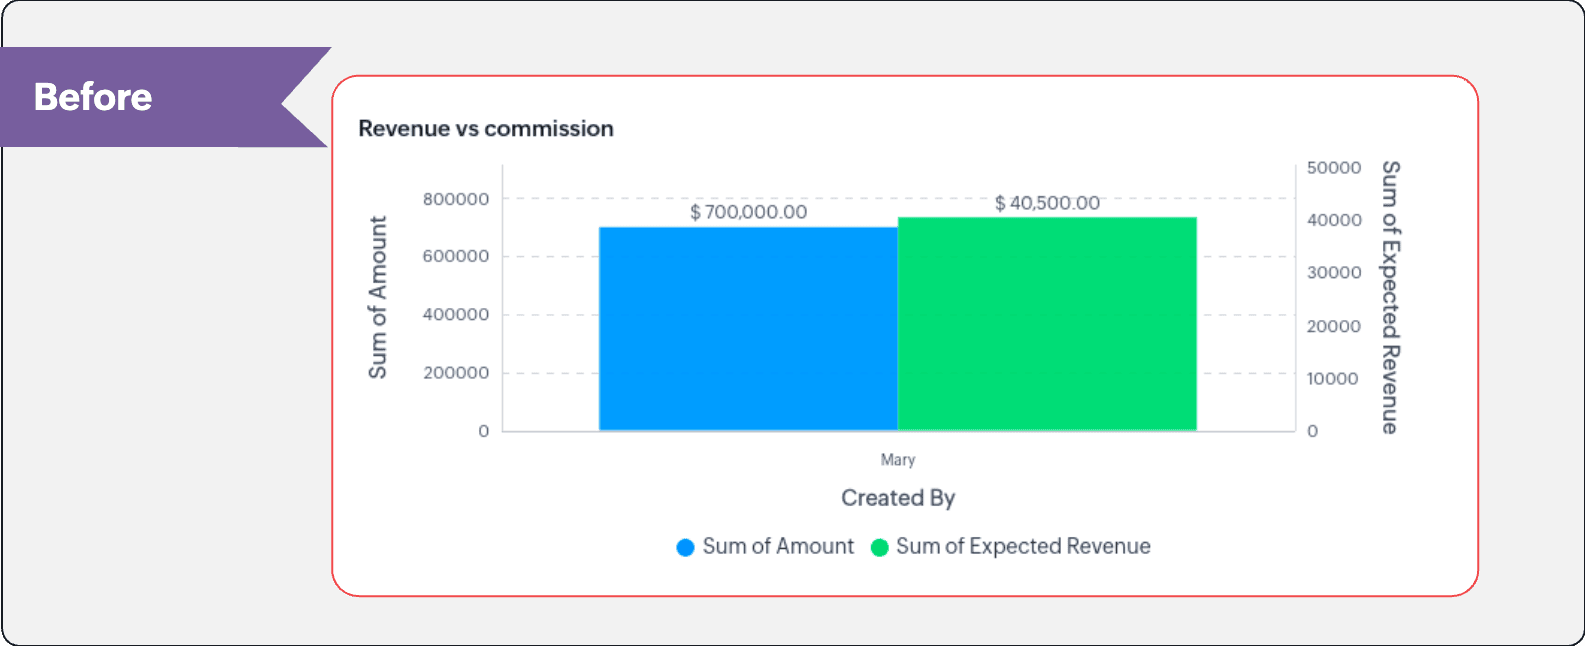
In this enhancement, we're allowing neighboring values of measures to merge so that the interpretation can be more visually accurate.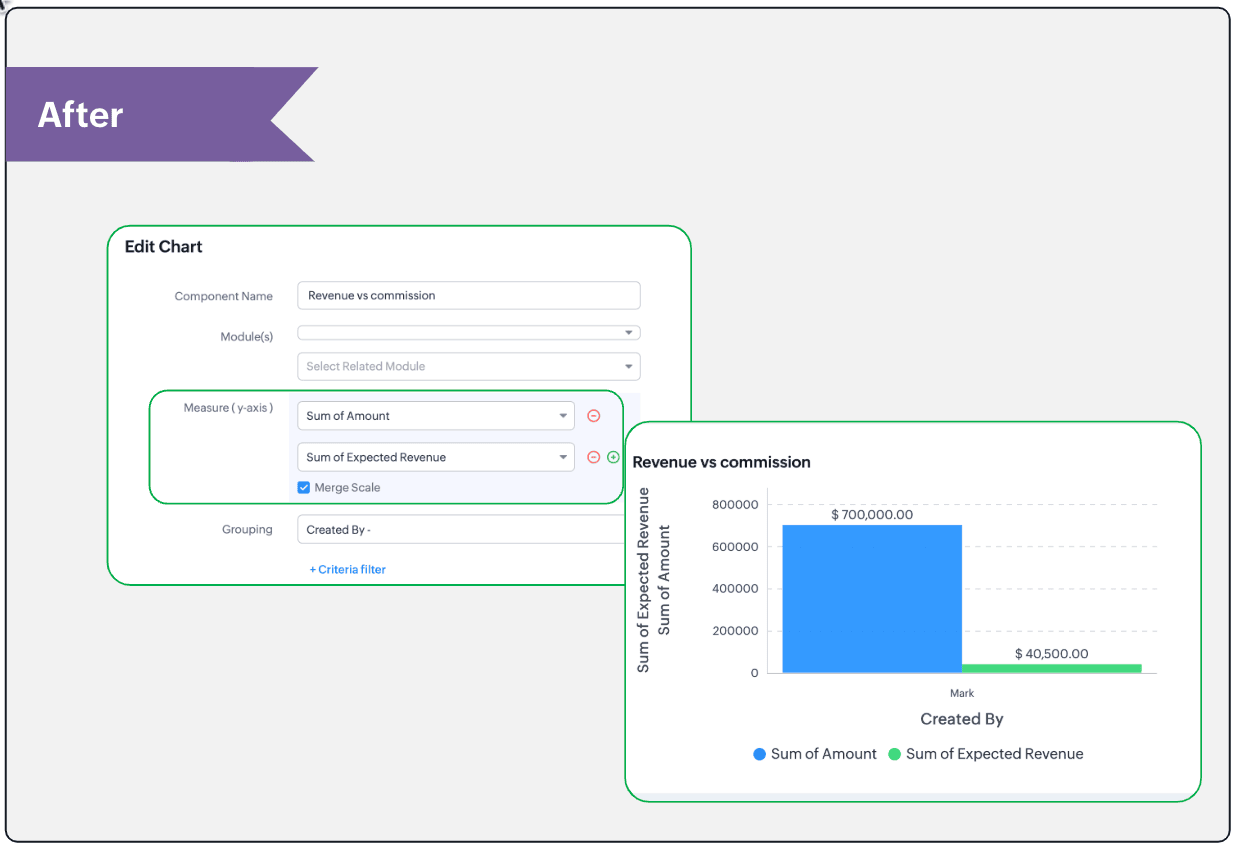
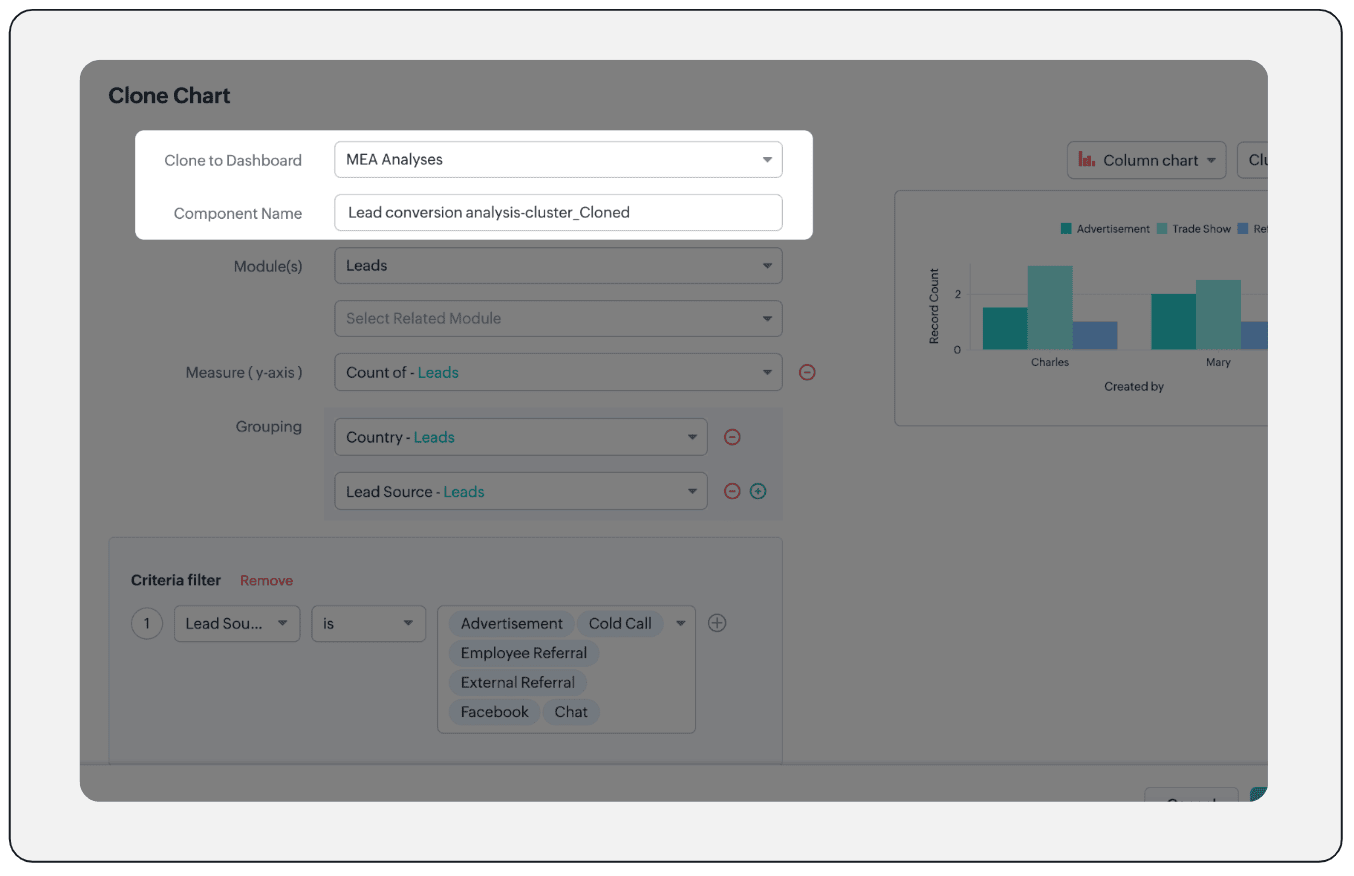
- Clone components to a different dashboard: Dashboards in Analytics serve in unique ways for various audiences—there can be separate dashboards for the sales team, marketing team, engineering team, and so on, and the chances of using the same measure for reference is common. Thus, when you clone a chart, you can now determine the target dashboard in which the cloned chart can be placed.
Resource: Help document
Thanks and have a good one!
Kind regards,
Saranya Balasubramanian
Saranya Balasubramanian
Topic Participants
Saranya Balasubramanian
Sticky Posts
Good news! Calendar in Zoho CRM gets a face lift
Dear Customers, We are delighted to unveil the revamped calendar UI in Zoho CRM. With a complete visual overhaul aligned with CRM for Everyone, the calendar now offers a more intuitive and flexible scheduling experience. What’s new? Distinguish activitiesConsumers are talking about your business. Are you listening?👂
A loyal customer might be praising your product in a forum. A frustrated user could be posting a harsh review on a public site. An excited partner may have left a comment on your campaign. A domain expert might be deconstructing your product. A prospectEnhancements to the formula field in Zoho CRM: Auto-refresh formulas with the "Now" function, stop formula executions based on criteria, and include formulas within formulas
Dear Customers, We hope you're well! By their nature, modern businesses rely every day on computations, whether it's to calculate the price of a product, assess ROI, evaluate the lifetime value of a customer, or even determine the age of a record. WithElevate your CX delivery using CommandCenter 2.0: Simplified builder; seamless orchestration
Most businesses want to create memorable customer experiences—but they often find it hard to keep them smooth, especially as they grow. To achieve a state of flow across their processes, teams often stitch together a series of automations using WorkflowPresenting ABM for Zoho CRM: Expand and retain your customers with precision
Picture this scenario: You're a growing SaaS company ready to launch a powerful business suite, and are looking to gain traction and momentum. But as a business with a tight budget, you know acquiring new customers is slow, expensive, and often delivers
Recent Topics
Need more details on API Usage Dashboard
Hi Team, We have implemented Zoho Expense for a client and has done some integrations with well known third party ERP via api. Recently we have noticed a huge spike in the API consumption. But we couldn't get the root cause for the same. I accept thereEdit item custom fields
Getting this error : Transactions have been created with the custom field. Hence it cannot be deleted. Not trying to delete it, just trying to change which modules to show in or to not show at all in transactions !Rendering PDF to view on page
My company upload lots of PDF files onto Zoho. But every time we open it, it downloads the file instead of viewing it on the web page. Does Zoho allow uploaded PDF files to be rendered to view on web page yet? I've been trying to use <embed> or <object> but it cannot be loaded. (similar thread: https://help.zoho.com/portal/community/topic/how-to-open-a-pdf-file-of-a-view-in-preview-mode)Dynamically Fetching Lookup Field Display Value
I have an audit trail form, Audit_Changes, that tracks old vs new values across different forms. For lookup fields, the old/new value is the ID, but I also need the display value. What's a best practice for dynamically fetching the display value of theWorkdrive and ChatGPT Team Synced Connectors
Hi, we want to be able to integrate Zoho Workdrive with OpenAI’s ChatGPT Team plan. Google Drive and OneDrive both offer this, zoho please catch up asap. We dont want to have to put our company files in google drive, we want to allow chatgpt Team editionSubform Disabled Fields Should Remain Disabled on Edit/View
Currently, when we disable a subform field using on user input or on add new row, it works perfectly during the initial data entry. However, when the record is saved and reopened for viewing or editing, these disabled fields become editable again. ThisAbility to Create New Items When Zoho Trident is Minimized via tray or taskbar icon
Allow users to create new items (emails, calendar events, tasks, etc.) directly from the system tray icon or by right clicking the task bar icon, even when the window is minimized or not actively running in the foreground. This enables quick access toBug Report and Suggestions for Improvement in Zoho Applications
Hi Zoho Team, I’d like to report a few bugs and improvement suggestions I’ve noticed while using Zoho products: Zoho Cliq Video Call: The camera sometimes turns off automatically during video calls. This seems to be a bug — please check and fix it. ZohoI can not see Undeliverable emails from my Mass Email Leads activity in CRM
I am sending email templates and I can not see the Undeliverables? I only receive the "Out of Office" replies and any manual replies from the lead. Can you please let me know where the Undeliverable emails are sent so I can use the information to clean up the database?Select Zoho Contacts as Meeting Participants in Zoho Cliq
Hello Zoho Cliq Team, We hope you're doing well. We would like to request an enhancement to the meeting scheduling functionality in Zoho Cliq. Current Limitation: When scheduling a meeting in Zoho Cliq, participants can only be selected from: OrganizationAbility to Select External Users from Participants List When Scheduling Meetings
Hello Zoho Cliq Team, We hope you're doing well. We would like to request an enhancement to the meeting scheduling experience in Zoho Cliq. Current Limitation when scheduling a meeting in Zoho Cliq: External users can be selected from the list only underKaizen #212 - Map Dependency Fields in Zoho CRM using APIs
Hi Everyone!! Welcome back to another week of Kaizen series! Over the past few weeks, we have been addressing your questions and feedback shared through our Kaizen 200th feedback form. Thank you for your continued engagement and thoughtful queries. WeOutdated state in mexico
Hello Zoho team, the drop down to add the state for customers, when they introduce their state in mexico has a city named “Distrito Federal” that name changed many years ago to “ciudad de mexico”. could you please update this so my clients can find theIs anyone using Zoho Flow with airtable?
I need to build a flow that collects data from airtable and uses some of that data to create folders and files in google drive. I have fully function version of this in zapier and want to migrate to zoho. I am trying to perform a very basic fetch fromSOME FEATURES ARE NOT IN THE ZOHO SHEET IN COMPARISION TO ZOHO SHEET
TO ZOHO sir/maam with due to respect i want to say that i am using ZOHO tool which is spreadsheet i want to say that some features are not there in zoho sheet as comparison to MS EXCEL like advance filter and other Features which should be there in ZOHOAI in Zoho Workplace: A Sneak Peek into What’s Coming!
Hello everyone, We’re super excited to share something we’ve been working on and we want you to be part of it! You may have seen our announcement blog post introducing a major evolution in how AI works within Zoho Workplace. Want to be among the firstDisplay Client Name in Zoho Creator Client Portal Dashboard
Hello Zoho Creator Team, We hope you are doing well. Zoho Creator recently introduced the option to set a client’s display name in the Client Portal settings, which is very helpful for providing a personalized portal experience. However, there is currentlyMeet Canvas' Grid component: Your easiest way to build responsive record templates
Visual design can be exciting—until you're knee-deep in the details. Whether it's aligning text boxes to prevent overlaps, fixing negative space, or simply making sure the right data stands out, just ironing out inconsistencies takes a lot of moving parts.Best way to share/download presentation files in Zoho without losing formatting?
Hello Zoho Community, I often work with PPT/PDF files in Zoho Docs and share them with colleagues. While PDFs usually give a direct download option, I’ve noticed that PPT/PPTX files sometimes only open in the viewer without a clear download link. Is thereWorkflow Failure - Notifications
Good afternoon, I have just experienced an error whereby a Workflow failed, for a reason currently unknown. The problem is that one of my users had to flag this manually (thankfully he's very thorough) and this otherwise would have flown under the radar.Introducing Bin Locations In Zoho Inventory
Hello users, We are excited to let you know that your wait for the Bin Locations feature has now come to an end! Yes, you heard us right! We are here to introduce the much-awaited Bin Locations now in Zoho Inventory. But before we dive into the featureError "Invalid client task found corresponding properties" only when triggered from workflow ?
Hi All, I am facing an error message I never encountered previously: Error in executing On Add - On Load script Error in executing thisapp.get_all_projects_api_call function. Line:(2) Error in executing thisapp.getAccessTokenFromRefreshToken function.How to interpret Campaign report statistics - definitions/explanation
I am trying to make sure I understand the Campaign report correctly Do you have a list of definitions for: Delivered - it has reached the recipient's inbox Campaign reach - is this the number that have opened the campaign email? Unique Opens Clicks/OpenMulti-Page Forms in Zoho Creator!
Let’s make long applications easier to handle by dividing them into pages, adding a progress bar, and guiding users step by step through complex data entry. This would be a total game-changer for the user experience and could significantly boost completionSubforms in Stateless Forms
Stateless Forms are very useful, but we can't build complex data entry pages without Subforms. Can this be implemented? This would make Stateless Forms truly powerful.Feature request - pin or flag note
Hi, It would be great if you could either pin or flag one or more notes so that they remain visible when there are a bunch of notes and some get hidden in the list. Sometimes you are looking for a particular name that gets lost in a bunch of less importantSchedule a Call by Date and Time when a specific lead status is selected
Hi Wanting to create a workflow where a call can be scheduled by date & time when a specific lead status is selected. Can only currently set the date by Due Date - Trigger Date - Plus 'x' day(s) ThanksZoho CRM's Copy Customization functionality now works across DCs, for customized accounts, and more
Availability This feature is available in Standard, Professional, Enterprise, and Ultimate editions. These changes have been rolled out to all users in all DCs. For more information, please refer to these help documents: Overview | Instructions HelloHow can I bold text on Zoho Forms submit buttons?
In the old theme builder, I could bold the text on a form's submit button. With the new theme builder, I can only change the text of the header or fields in the form, and not the button itself.5名限定 課題解決型ワークショップイベント Zoho ワークアウト開催のお知らせ (10/31)
ユーザーの皆さま、こんにちは。Zoho ユーザーコミュニティチームの中野です。 10月開催のZoho ワークアウトについてお知らせします。 今回はZoomにて、オンライン開催します。 参加登録はこちら(無料):https://us02web.zoom.us/meeting/register/BGYTysOnSqa9LA9eY2IKww ━━━━━━━━━━━━━━━━━━━━━━━━ Zoho ワークアウトとは? Zoho ユーザー同士で交流しながら、サービスに関する疑問や不明点の解消を目的としたHiding Pre-defined Views
You can enhance Zoho with custom views - but you cannot hide the pre-defined views. Most users focus on 4 or 5 views. Right now for EVERY user EVERY time they want to move to one of their 4 or 5 views - they have to scroll down past a long list of pre-defined views - we don't use ANY of the pre-defined views. Adding the feature to allow a predefined view to be hidden completely or only visible to certain users would be a big improvement in usability for Zoho CRM. This feature is already availableRich-text fields in Zoho CRM
Hello everyone, We're thrilled to announce an important enhancement that will significantly enhance the readability and formatting capabilities of your information: rich text options for multi-line fields. With this update, you can now enjoy a more versatile[Integration Edition] Deluge Learning Series – Third-Party Integrations with Deluge | October 2025
We’re excited to continue this three-month edition of the Deluge Learning Series: Session 1 – Integrating Zoho Apps with Deluge Using Built-In Integration Tasks Session 2 – Integrating Zoho Apps with Deluge Using invokeURL and invokeAPI Session 3 – Third-PartyFeature Request: Tag, Search, and Report on Individual Private Comments
Zoho Desk Team, First, I want to say that we are extensive users of Zoho Desk and it is a core part of our support operations. We rely heavily on the private comments feature for internal communication, knowledge sharing, and maintaining a clear historyZoho CRM Community Digest - August 2025 | Part 2
Hello Everyone! Here's a quick round-up of handy tips, clever workarounds, and product updates from late August. Product Updates: Meeting Enhancements in Zoho CRM! Track whether a meeting is online, in-office, or at the client’s location using the newAssistance Needed: Ticket Status Not Updating and Sorting by Last Customer Reply in Zoho Desk
Hello, I’m facing two issues in Zoho Desk that I’d like your guidance on: Ticket Status Not Updating: When a customer replies to a ticket, the status does not change to Reopened. Instead, it remains in Waiting on Customer, even after the customer’s responseRound robin
Hi, I'm trying to set up a round robin to automatically distribute tickets between agents in my team but only those tickets that are not otherwise distributed by other workflows or direct assignments. Is that possible and if so which criteria should ITime Entry Notifications
Hi All - I have support staff who place notes of their work in the time entry section of Zoho Desk. Is there a specific workflow or setting I need to enable to have the ticket holder updated via email when an entry is saved?Change text in help desk
Hi, Please let me know how can i change the this text, see screenshot.Customer happiness customisation
Hi, I was wondering if it's possible to somehow customise to whom and when customer happiness request is sent? Can you enable it only for selected tickets for example based on workflow or any other criteria (customer name, tag or anything else)? AlsoNext Page