Zoho DataPrep's Home page
Dashboard
Getting started
The getting started section in the home page is shown to trial users, this shows you the various aspects to get started with Zoho DataPrep. You can take a Product tour to get a walkthrough and understand the end-to-end ETL process in DataPrep including how it helps with data movement and data integration.
You can directly get started by creating a new pipeline. You can also explore our sample templates and use them to create a pipeline. Pipelines are fundamental entities that allows users to create ETL data flows in DataPrep, with multiple data stages and using various flow level transforms. Click here to know more about a pipeline.
For a detailed procedure on how to get started and create a pipeline and more, you can look into the Help articles under the Help center widget. You can also watch our How-to-videos covering various transforms available in DataPrep.
If you'd like to get a guided tour of our product from our experts and find how Zoho DataPrep simplifies ETL, data integration and data preparation, click the Get personalized demo option and schedule a demo.
Overview
Once you start creating pipelines, the Dashboard will give you a brief overview of all the events and entities in your organization, such as the number of workspaces, pipelines, scheduled pipelines, successful and failed jobs, etc. Click here to know more about jobs.
Key features
Pipeline/Job stats
The dashboard acts as a central monitoring console for all the pipeline stats. This can help you identify the pipelines with issues and start debugging.
Successful jobs
This chart shows the number of successful jobs executed in a day along with the time frame. You can also choose the following filters to get the specific stats: Today, Yesterday, This week, This month, and Last month.
Failed jobs
This chart shows the number of failed jobs executed in a day along with the time frame. You can also choose the following filters to get the specific stats: Today, Yesterday, This week, This month, and Last month.
All job status
The donut chart shows the overall status of all the successful and failed jobs. You can choose the required filters: Today, Yesterday, This week, Last week, This month, Last month. You can also choose the following job types and view specific stats.
- All job status: This default option shows the total number of all the successful and failed jobs.
- Schedule job status: This shows the total number of successful and failed schedule jobs.
- Manual job status: This option gives you the total number of successful and failed manual jobs.
- Backfill job status: This shows the total number of successful and failed backfill jobs.
Other widgets
Recent pipelines- This shows the list of the top 10 recently modified pipelines. You can quickly click open and start working on them. You can also view all the pipelines using the View all Pipelines option.
Jobs- This shows the list of jobs executed along with the Job ID, the associated pipeline and workspace, run time, and status. The successful and failed jobs are displayed under the respective tabs. You can also click the required job to view the Job summary. You can also choose the required time period filters-Today, Yesterday, This week, Last week, This month, Last month, and generate required data.
Recent workspaces- This widget shows the list of top 10 recently modified workspaces. You can quickly click open and start working on them. You can also view all the workspaces using the View all workspaces option.
Scheduled pipelines- This section shows you the list of all the scheduled pipelines along with the associated workspace, schedule status, and run time. You can quickly click open the pipelines and start working on them. You can also view all the scheduled pipelines using the View all scheduled pipelines option.
Topbar options
Pipeline
Pipelines are fundamental entities that allow users to create ETL data flows in DataPrep, with multiple data stages and using various flow-level transforms that support seamless data movement and data integration. This page shows the list of all the pipelines in your organization. Click here to know more about pipelines.
Workspace
Workspaces are entities that hold the various pipelines created in DataPrep. This page shows all the workspaces you own. Click here to know more about workspaces.
Jobs
A pipeline execution is called a job, a job tracks the progress of imports, transformations and exports in a pipeline among other stats. The Jobs tab shows the list of all the jobs executed across all the workspaces in your organization along with the Job ID, the associated pipeline, start and run time, status, run by, storage used, and rows processed. Click here to know more about jobs.
Switch to old UI
You can use this option to switch UI to the old DataPrep version (1.0).
Global Search
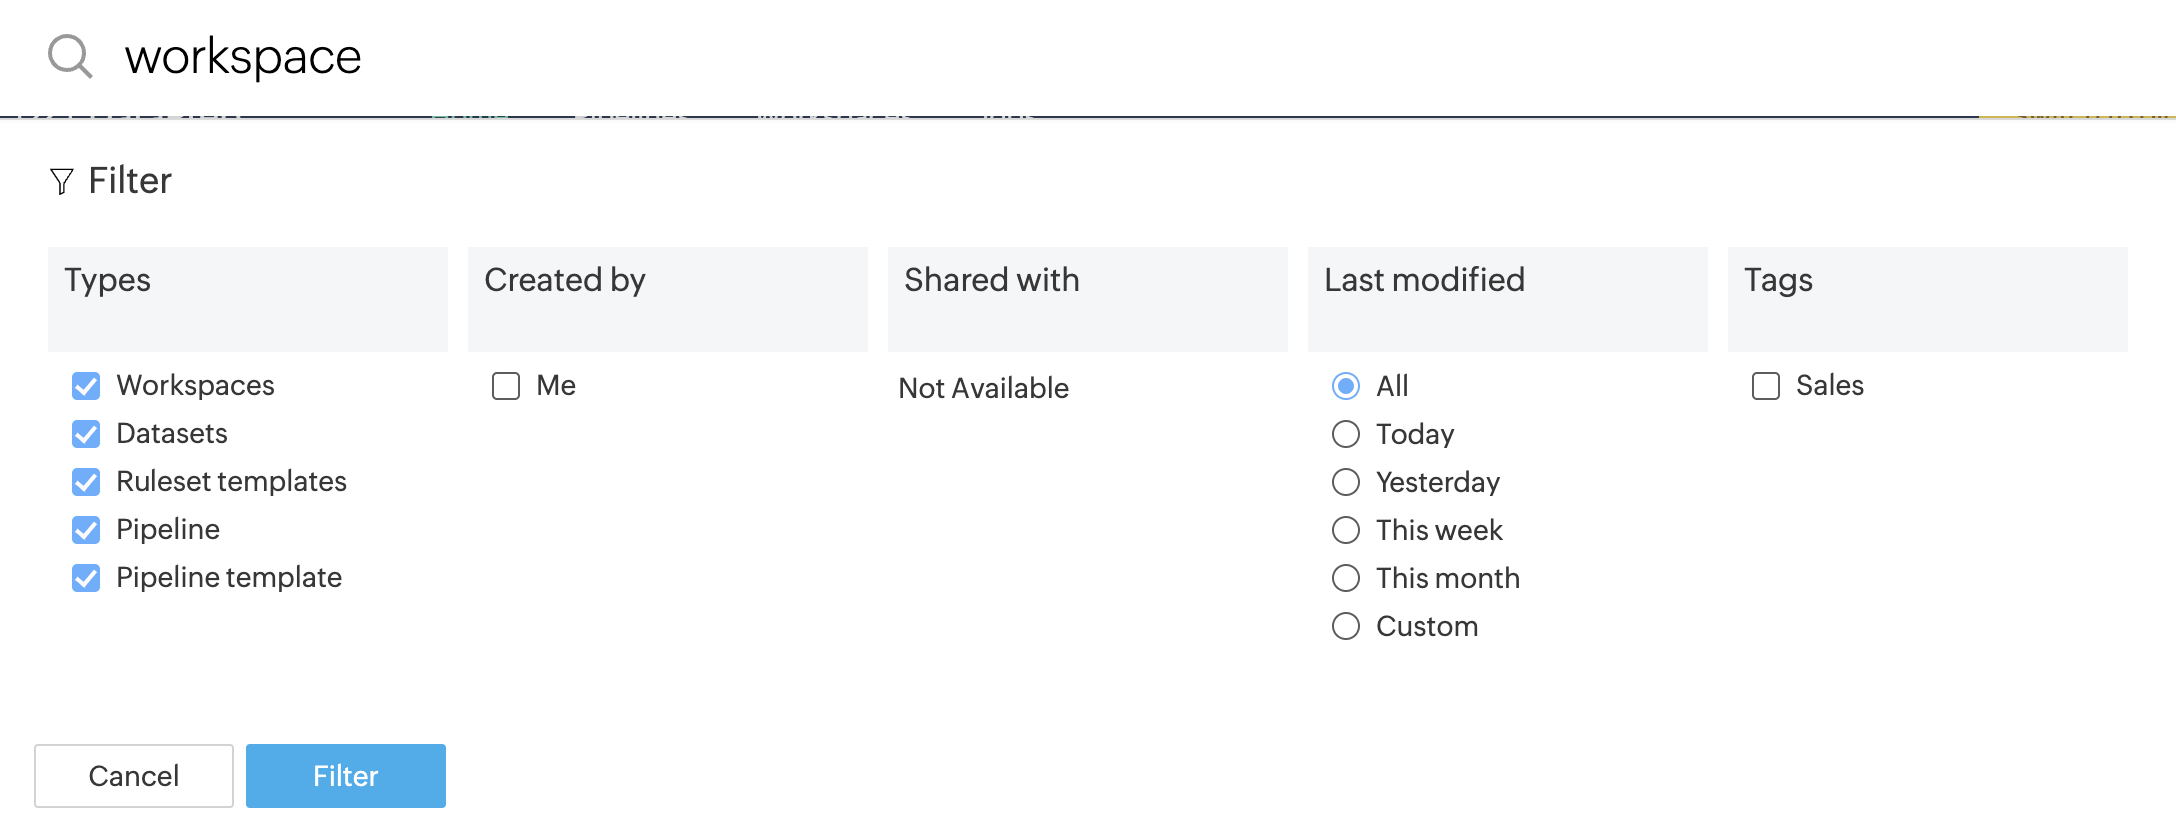
Click the  search icon at the top-right of the home page to search for any entities in your organization. You will also get filter options to refine the search results, such as entity types, created by, shared with, last modified, and workspace tags.
Notifications
Click the  icon to view the notifications, announcements, and alerts. You can also select one of the following options from the Notifications drop-down and view the corresponding notifications:
All - Using this option, you can view the notifications from all the categories.
Share - Using this option, you can view the notifications of the shared entities.
Alerts - This option helps you view alerts for events for scheduled pipelines.
Group - Using this option, you can view the notifications that are from the groups you created and from the groups where you have shared any entity.
Account - You can view the notifications related to your DataPrep account with this option(available only to the Account and Organization admins)
You can also switch to another organization to view the corresponding notifications if there's any entity shared with you.
Settings
In the Settings page, you can manage your organization using the Organization settings and Organization admins tabs if you are an Account admin or an Organization admin.
In the settings page, you can also manage your subscription, users and groups in your organization, privacy settings, feature control, notifications, connections, and more. Click here to know more about settings.
Help
Click the  icon and choose any of the following help resources from the menu.
User guide - This option will take you to the help documentation portal of Zoho DataPrep.
What's new - This option will take you to the What's new page of our website. You can check out all the recent updates of DataPrep.
Blogs - This option will take you to the DataPrep blogs page that covers various aspects of data preparation and data cleaning. You can give them a quick read.
Contact support - Using this option, you can submit your queries and get help from our support team. You can also book a personalized demo from the option in the footer.
Profile
You can click the profile icon to view your profile details: User Id, name, and the email address associated with the DataPrep account.
You can also click the My Account link to navigate to the Zoho Accounts page if you want to review and modify your account details such as name, email address, password, etc. Click the Activity link to view details such as the activity history, details of active sign-ins, etc.
You switch to another organization where you are a part of when you click the required option in the Organization drop-down. The user roles and owner names are displayed near the corresponding organization names. To learn more about user roles and privileges, click here. The number of unread notifications is also displayed near the organization names if any. You can also sort and search for the organization names.
Create New
Pipelines are fundamental entities that allow users to create ETL pipelines / data flows in DataPrep, with multiple data stages and using various flow‑level transforms. Click on the Create New button. A pipeline gets created in a new workspace. You can click on the Create New drop down icon and choose New Pipeline, From Templates Library, or Import Pipeline.
Browse template
Template library is a place which contains pre-defined templates and all the saved pipeline templates. You can create a new pipeline from scratch using the pre-defined template or saved templates from the template library.
SEE ALSO