How to Conduct Market Basket Analysis in Zoho Analytics
Delivering a personalized purchase experience is the key differentiator for businesses to increase sales and brand loyalty. Market basket analysis, also called affinity or association analysis, is a data mining technique that helps discover significant patterns and relationships exhibited by individuals while making a purchase.
By identifying the items that occur together,
having adequate stock levels.
Data Requirements
To conduct a market basket analysis, you'll need a transactional dataset that includes the item name, bill number (or order ID), quantity, and date and time of the transaction.
We are using a sample e-commerce store data saved as Orders for illustration. Each row in the Orders data table denotes a transaction.
Preparing the data for analysis
To conduct the market basket analysis, we need to extract the following data from the base table (Orders) using SQL queries.
- A query table that contains all possible pairs of combinations that could occur together.
- A query table to get the number of transactions for combinations that have appeared together or combinations that has been purchased.
- As a final step, merge the all possible combinations query table and the number of transactions query table.
Generating all Possible Pairs of Combinations
The first step in the data preparation process is to generate all distinct pairs of items that could appear on the transaction. To get that,
- Perform a self-join operation on the Items Name column of the base table, Orders. The self-join operation compares each row (transaction) with every other row (transaction).
-
Use the condition Greater than (>) to ensure that each pair of items is considered only once and avoid duplicates where the same pair appears in reverse order, like (Lavender Candle, British Rose) or (British Rose, Lavender Candle) or (Lavender Candle, Lavender Candle)SELECT"Orders" . "Item Name" "Item","Orders copy". "Item Name" "Item Copy"FROM ( SELECT `orders` .`Item Name` "Item Name"FROM "Orders"GROUP BY 1) AS "Orders"JOIN(SELECT `orders`.`Item Name` "Item Name"FROM "Orders"GROUP BY 1) AS "Orders copy" ON "Orders" . "Item Name" > "Orders copy" . "Item Name"
Finally, save the query table with a suitable name. We are saving it as All Items Combinations.
Distinct Count for Existing Combination
The second step in the data preparation process is to get the distinct count for the pairs of items that appear together in transactions.
- Perform a self-join operation on the Items Name column of the base table, Bill Items. The self-join operation compares each row (transaction) with every other row (transaction).
- Use the count_distinct function on the Bill Number column to get the total number of times a combination has occurred together.
|
SELECT
"Orders" . "Item Name" "Item",
"Orders Copy" . "Items Name" "Item Combo",
count_distinct ("Orders Copy" . "Bill Number") "Number of Transactions"
FROM "Orders"
JOIN( SELECT
`Orders`.`Item Name` "Items name",
`Orders`.`Bill Number` "BillNo"
FROM "Orders"
) AS "Orders Copy" ON "Orders" . "Bill Number" = "Orders Copy". "Bill Number"
AND "Orders" . "Item Name" > "Orders Copy" ." Items Name"
GROUP BY 1,
2
|
Finally, save the query table with a suitable name. We are saving it as Count for Existing Combinations.
Merge Tables using Left Join
The final step in the data preparation process is to join the All Combinations table and the Count for Existing Combinations table. Use the Left Join operation on the All Items Combination table, and use the if_null function for combinations that have not occurred or been bought together.
|
SELECT
"All Items Combination" . "Item" "Item",
"All Items Combination" . "Item Copy" "Item Copy",
if_null("Count for Existing Transactions" . "Number of Transactions", 0) as "Number of Transactions"
FROM "All Items Combination"
LEFT JOIN "Count for Existing Transactions" ON "All Items Combination" . "Item" = "Count for Existing Transactions". "Item"
AND "All Items Combination" . "Item Copy" = "Count for Existing Transactions" . "Item Combo"
|
By doing this, we will have a query table showing the count of pairs of items that occur together, with 0 assigned to combinations that do not occur together.
Data Visualization - Creating a Heat map
- Access the Total Transactions for all Combinations query table, click the Create icon on the side navigation panel.
- Choose New Chart view from the drop-down menu.
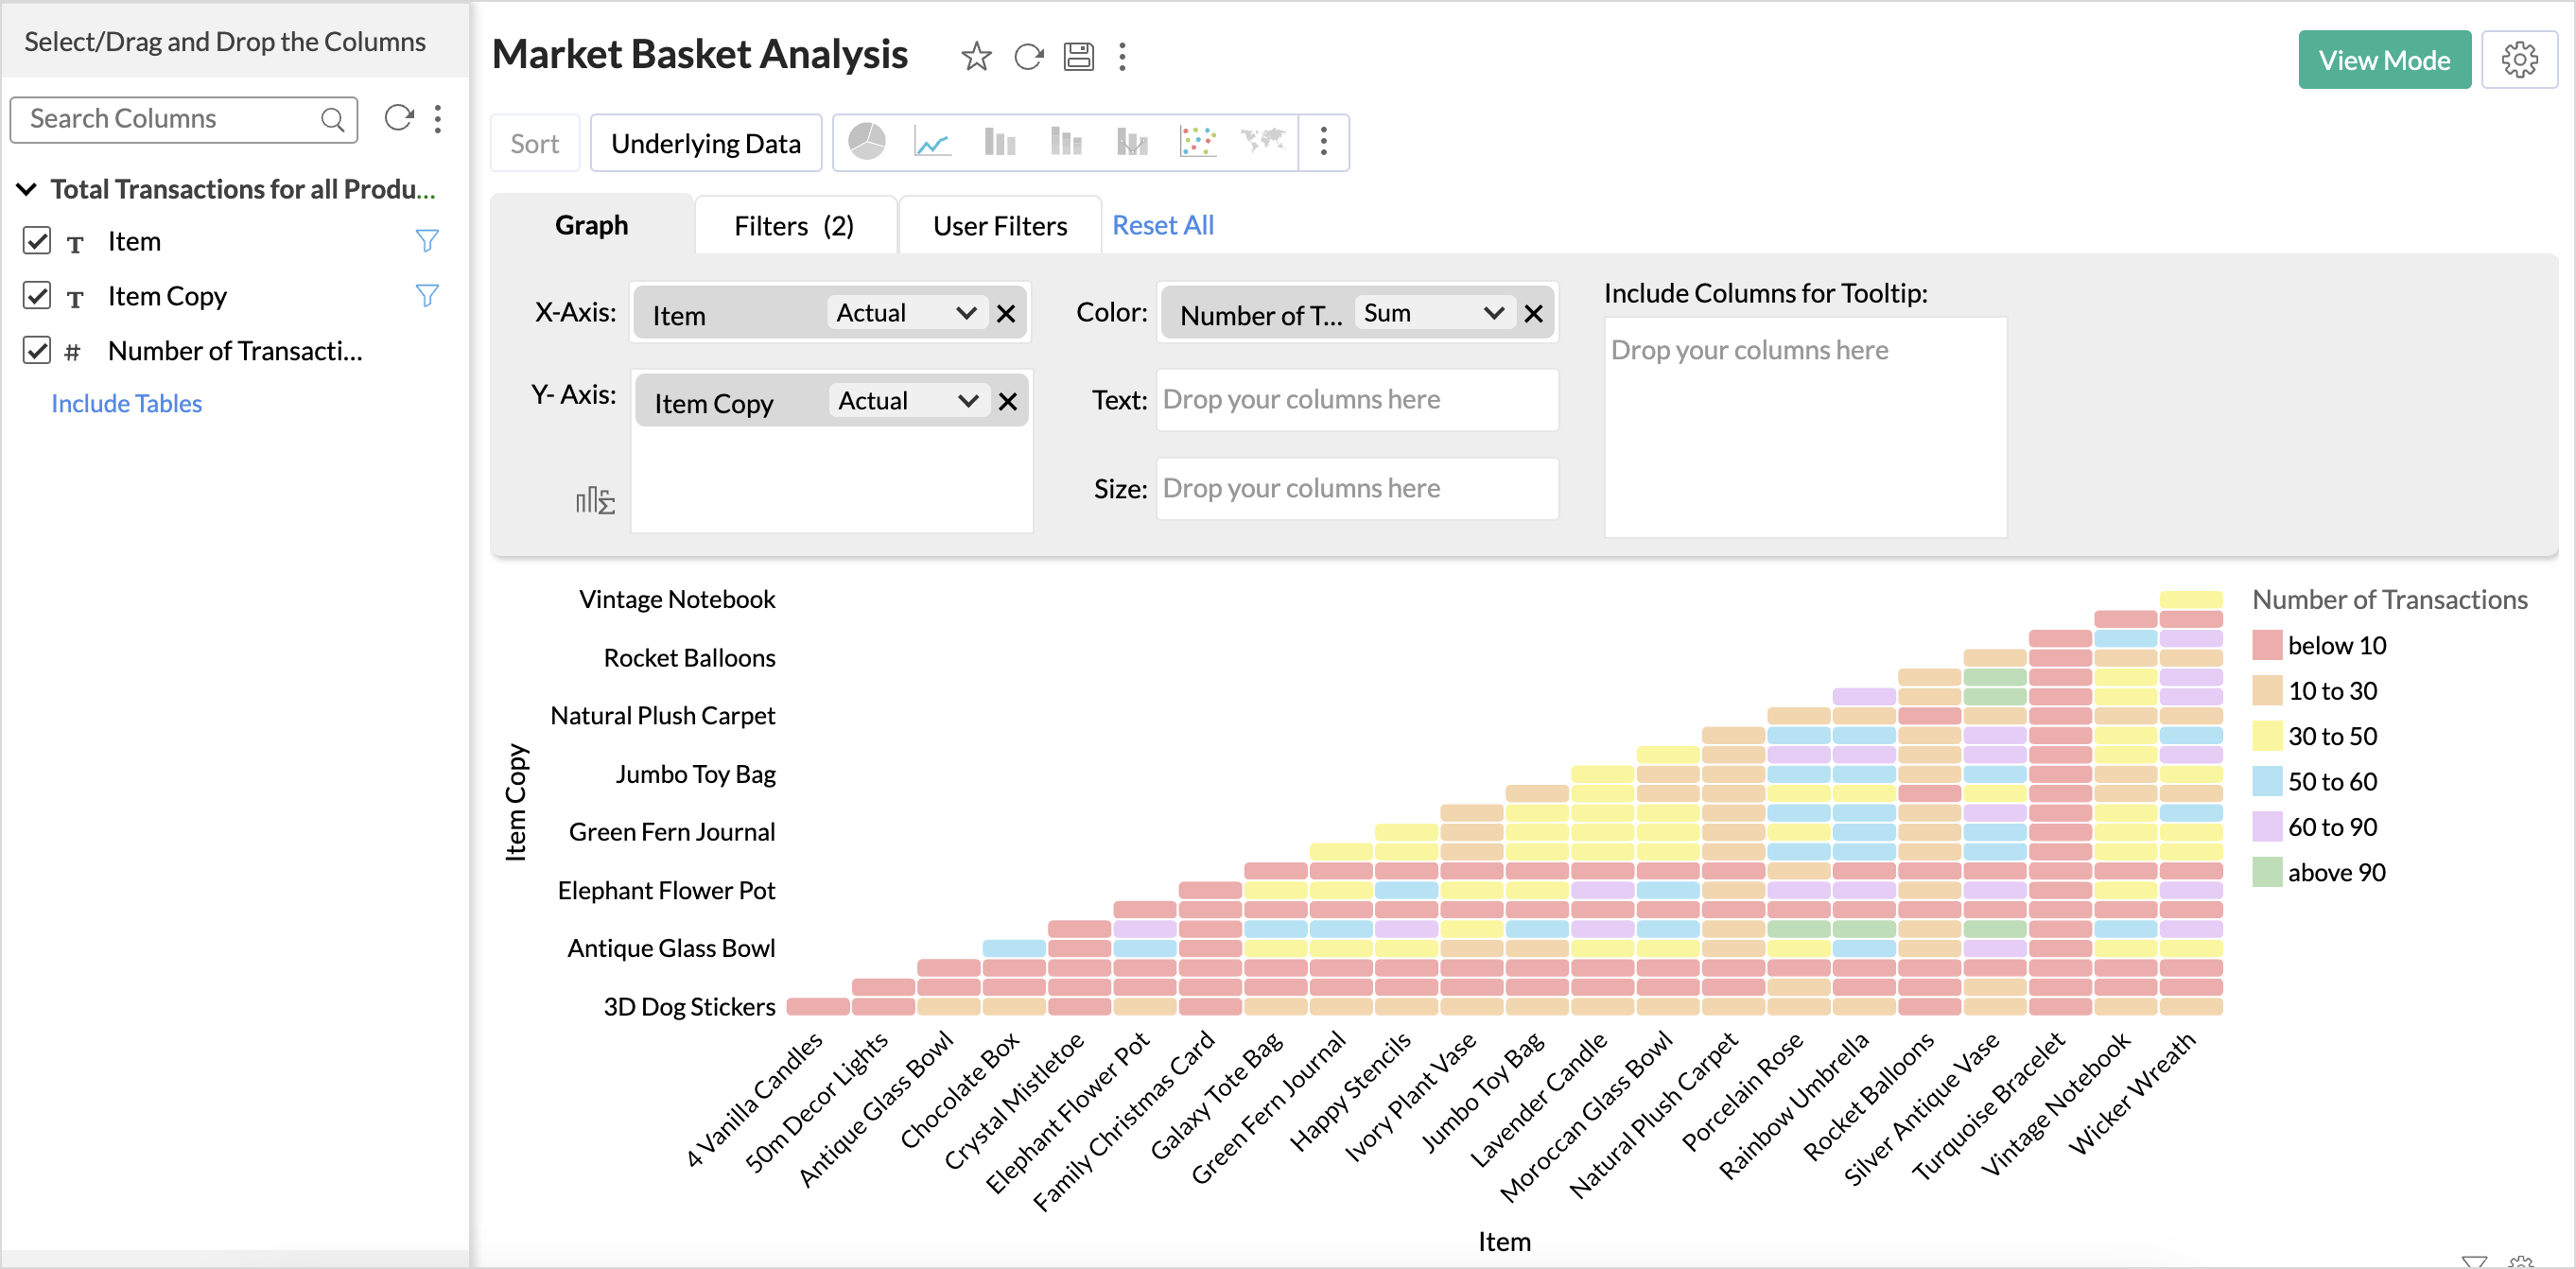
- Drag and drop the column as shown below
- X - axis: Item
- Y - axis - Item Copy
- Color - Number of transactions

- Click Generate Graph.
- The heat map for pairs of combinations will be ready!
Inference
From the above graph, we infer that combinations like {Silver Antique Vase, Chocolate Box} and {Silver Antique Vase, Rainbow Umbrella} {Rainbow Umbrella, Chocolate box} {Silver Antique Vase, Porcelain Rose} have a higher purchase frequency.
Items with a higher purchase frequency can be displayed on the home page of the e-commerce site as Best Sellers. They can also be shown as recommendations to cross-sell products if the cart has any one of the related items that is frequently bought.
Market Basket Analysis for 3 - item Combination
You can create a query table similar to the above query table to find the three items that occur together in transactions and create a pivot table for visualization. Refer to the sample workspace for queries.