What's New - January 2026
Hello Users!
We are starting the year with a strong lineup of updates, marking the beginning of many improvements planned to enhance your analytics experience. Explore the latest improvements built to boost performance, simplify analysis, and help you extract more value from your data.

Archive Data
No more querying all records while generating reports! Analyze data faster and optimize workspace performance with Archive Data. Move older or less-frequently used records out of active tables, and store them securely.
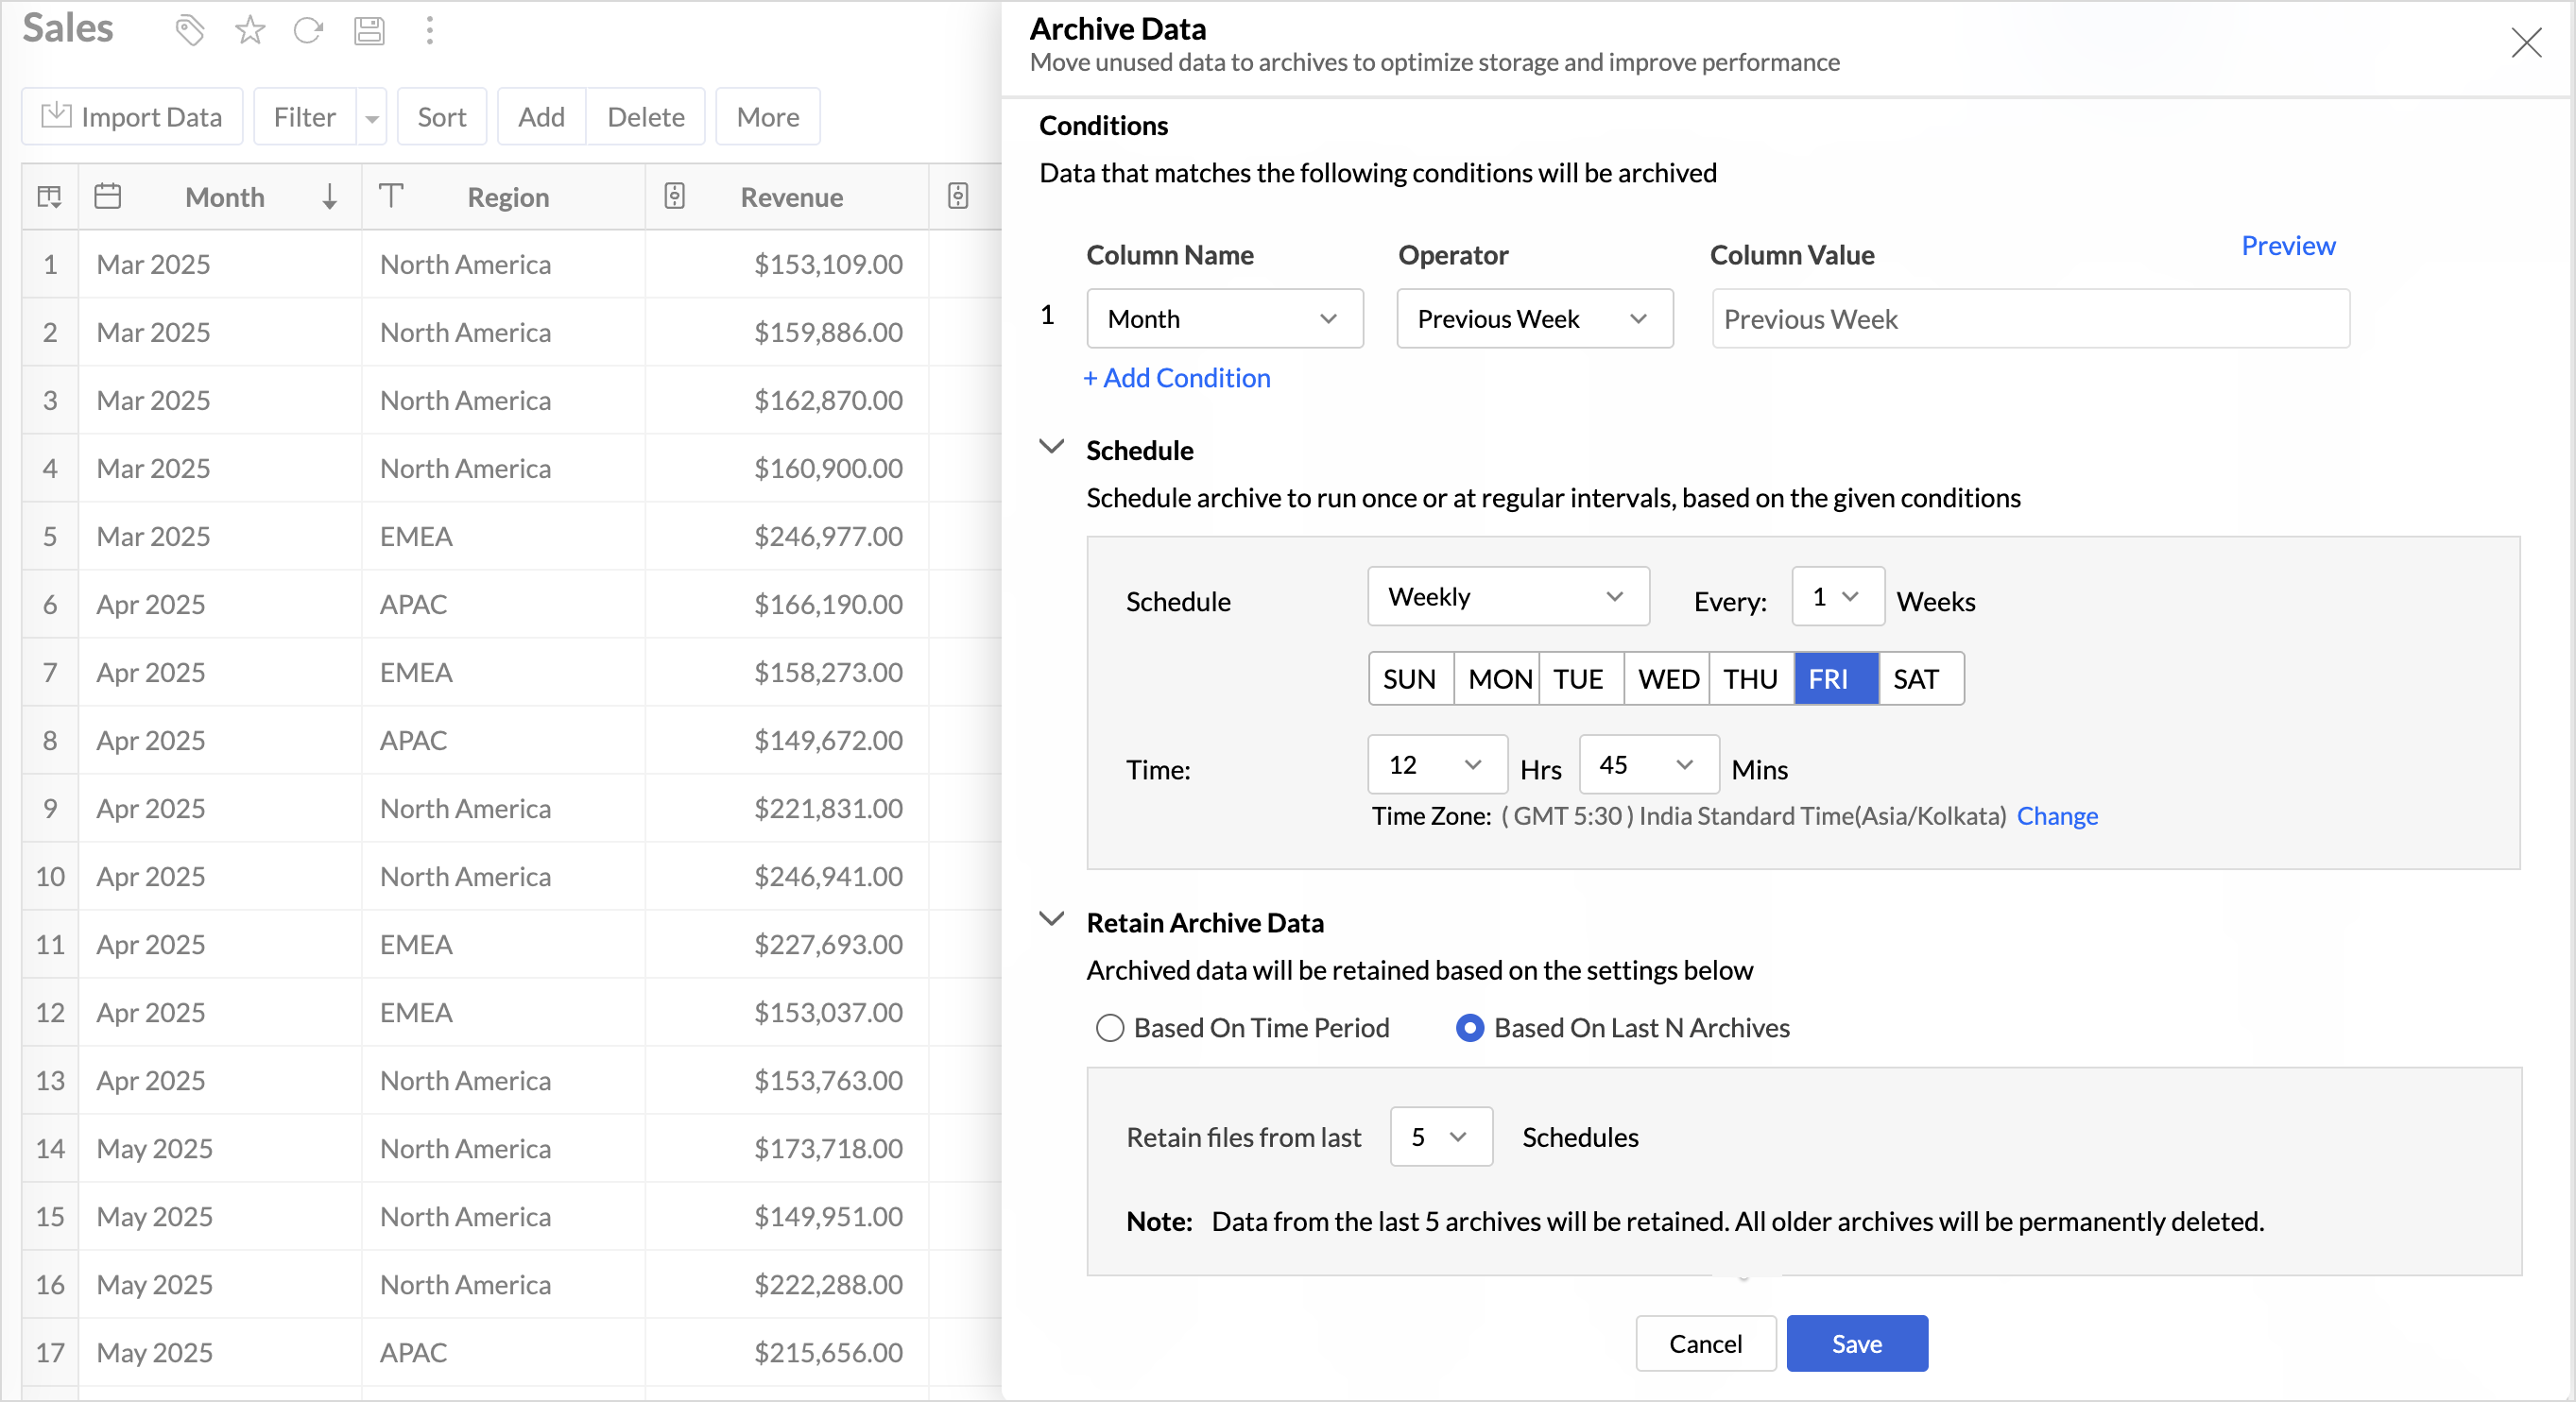
Key Benefits
- Pay only for what you analyze: Active data is reserved for analysis, while historical data is retained without impacting usage limits.
- Improved Querying and Faster Analysis: By limiting queries to relevant data, report generation and dashboard loading times are significantly reduced, resulting in faster insights and a more responsive analytics experience.
- Optimized Storage Usage: Archiving older data helps control table size, preventing unnecessary growth, and better management of row limits.
Organize Views with Tags
Group related views, and manage reports and dashboards effortlessly. Use tags to organize views by teams, departments, projects, or specific use cases, making it easy for users to navigate large workspaces.
Quickly filter and find the right reports and dashboards, reduce clutter, and ensure teams always have access to the views that matter most to them.
Global Custom Sort
Custom sort was limited to individual reports previously. With recent enhancements, you can now define the sort order for text data types at the workspace level.
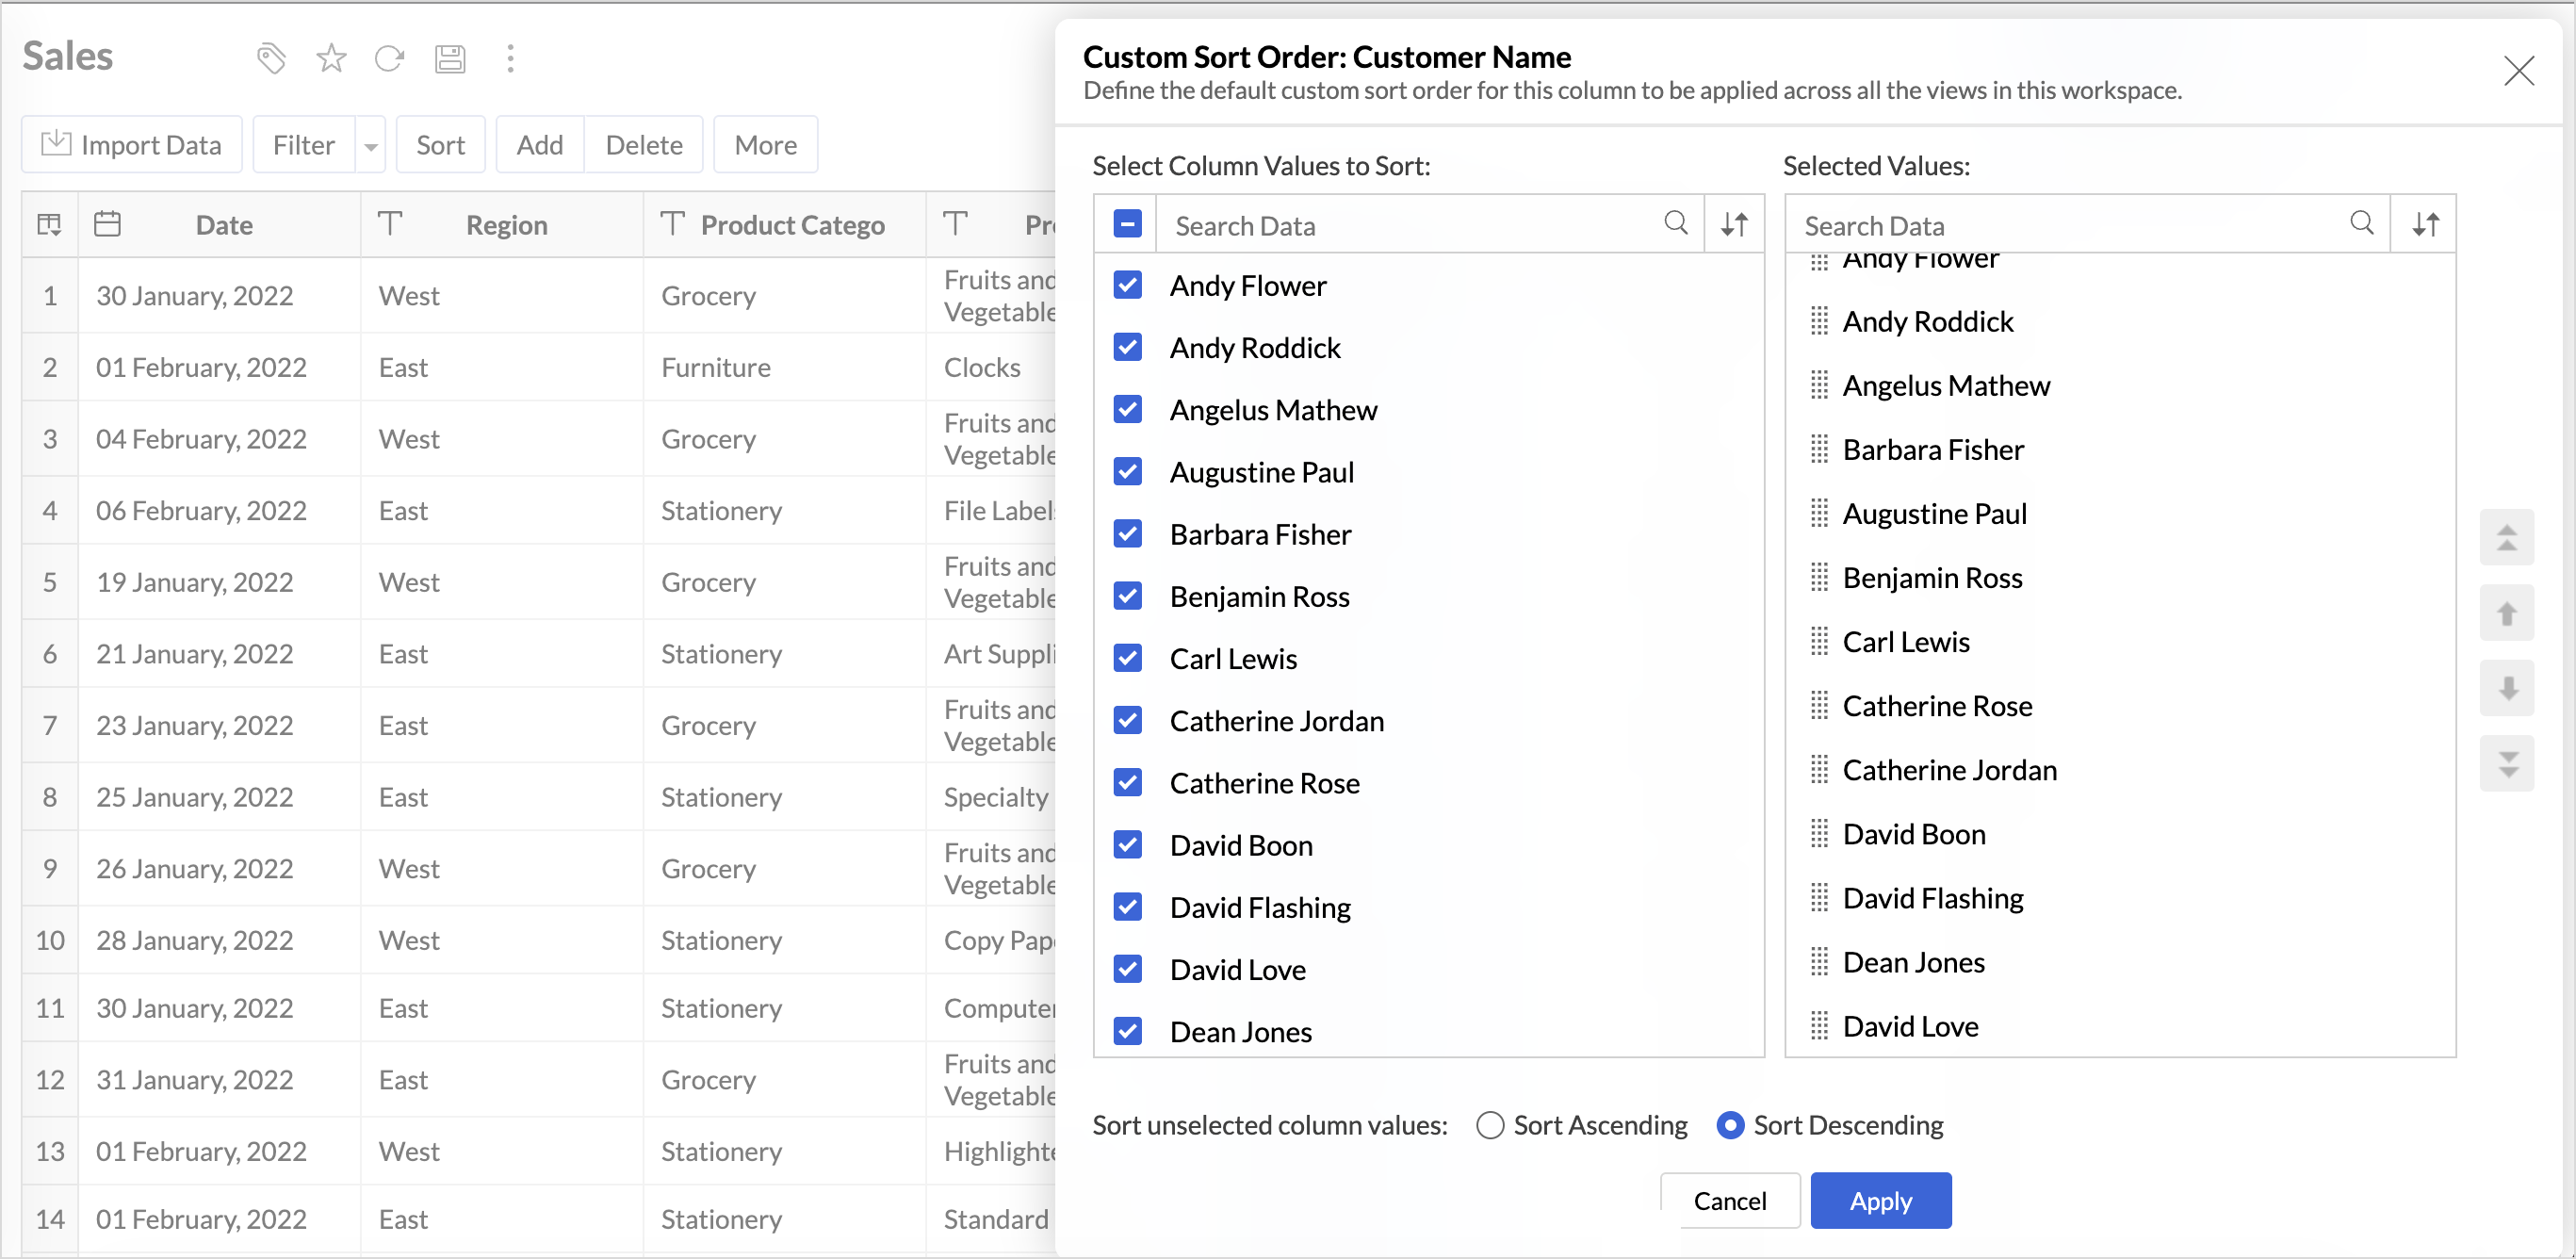
This improvement helps you maintain a consistent sorting across all reports, reduces repetitive setup, and saves time. It also ensures a standardized view of your data throughout the workspace.
Timeframe Selection for Overview Charts
Overview charts now offer flexible timeframe selection, allowing you to focus on relevant periods for deeper trend analysis.
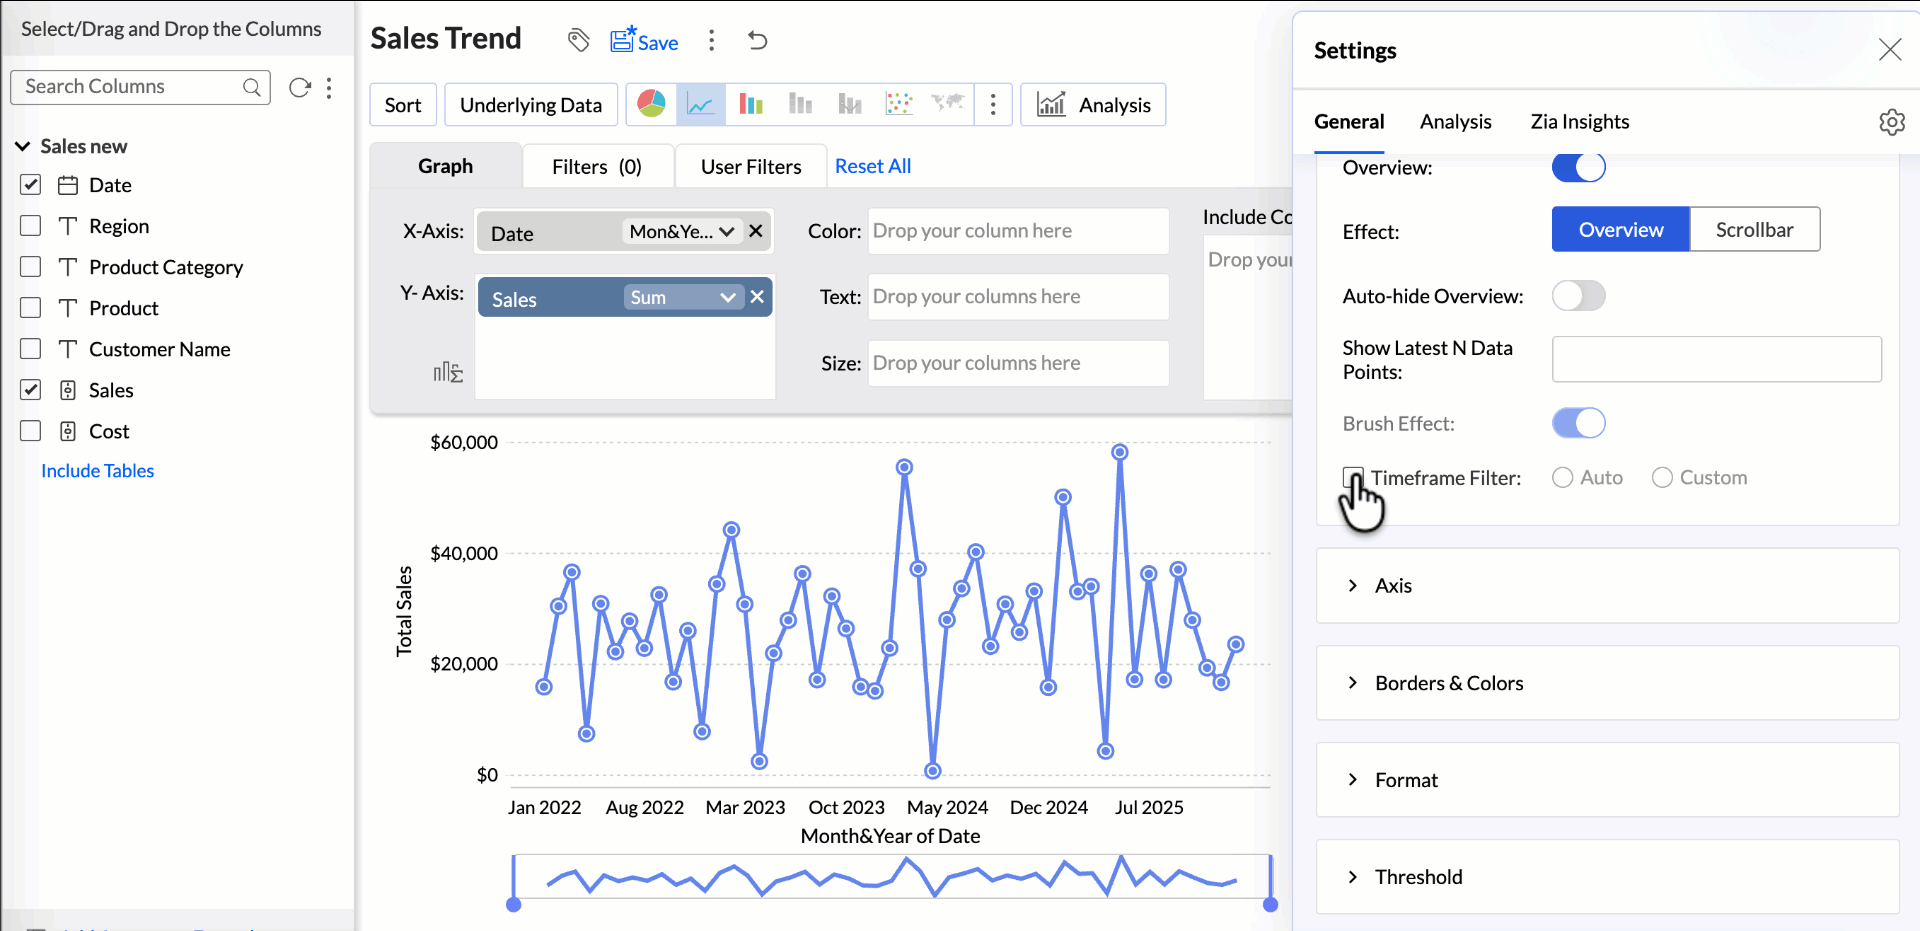
By narrowing the time range, you can better compare performance, identify patterns, and gain clearer insights without distraction from older data.
Customize Zia Insights placement in Dashboards
Choose where and how the insights are displayed, so that they complement your analysis without disrupting your dashboard layout. This gives you greater flexibility to present insights in the way that best suits your audience and reporting style.
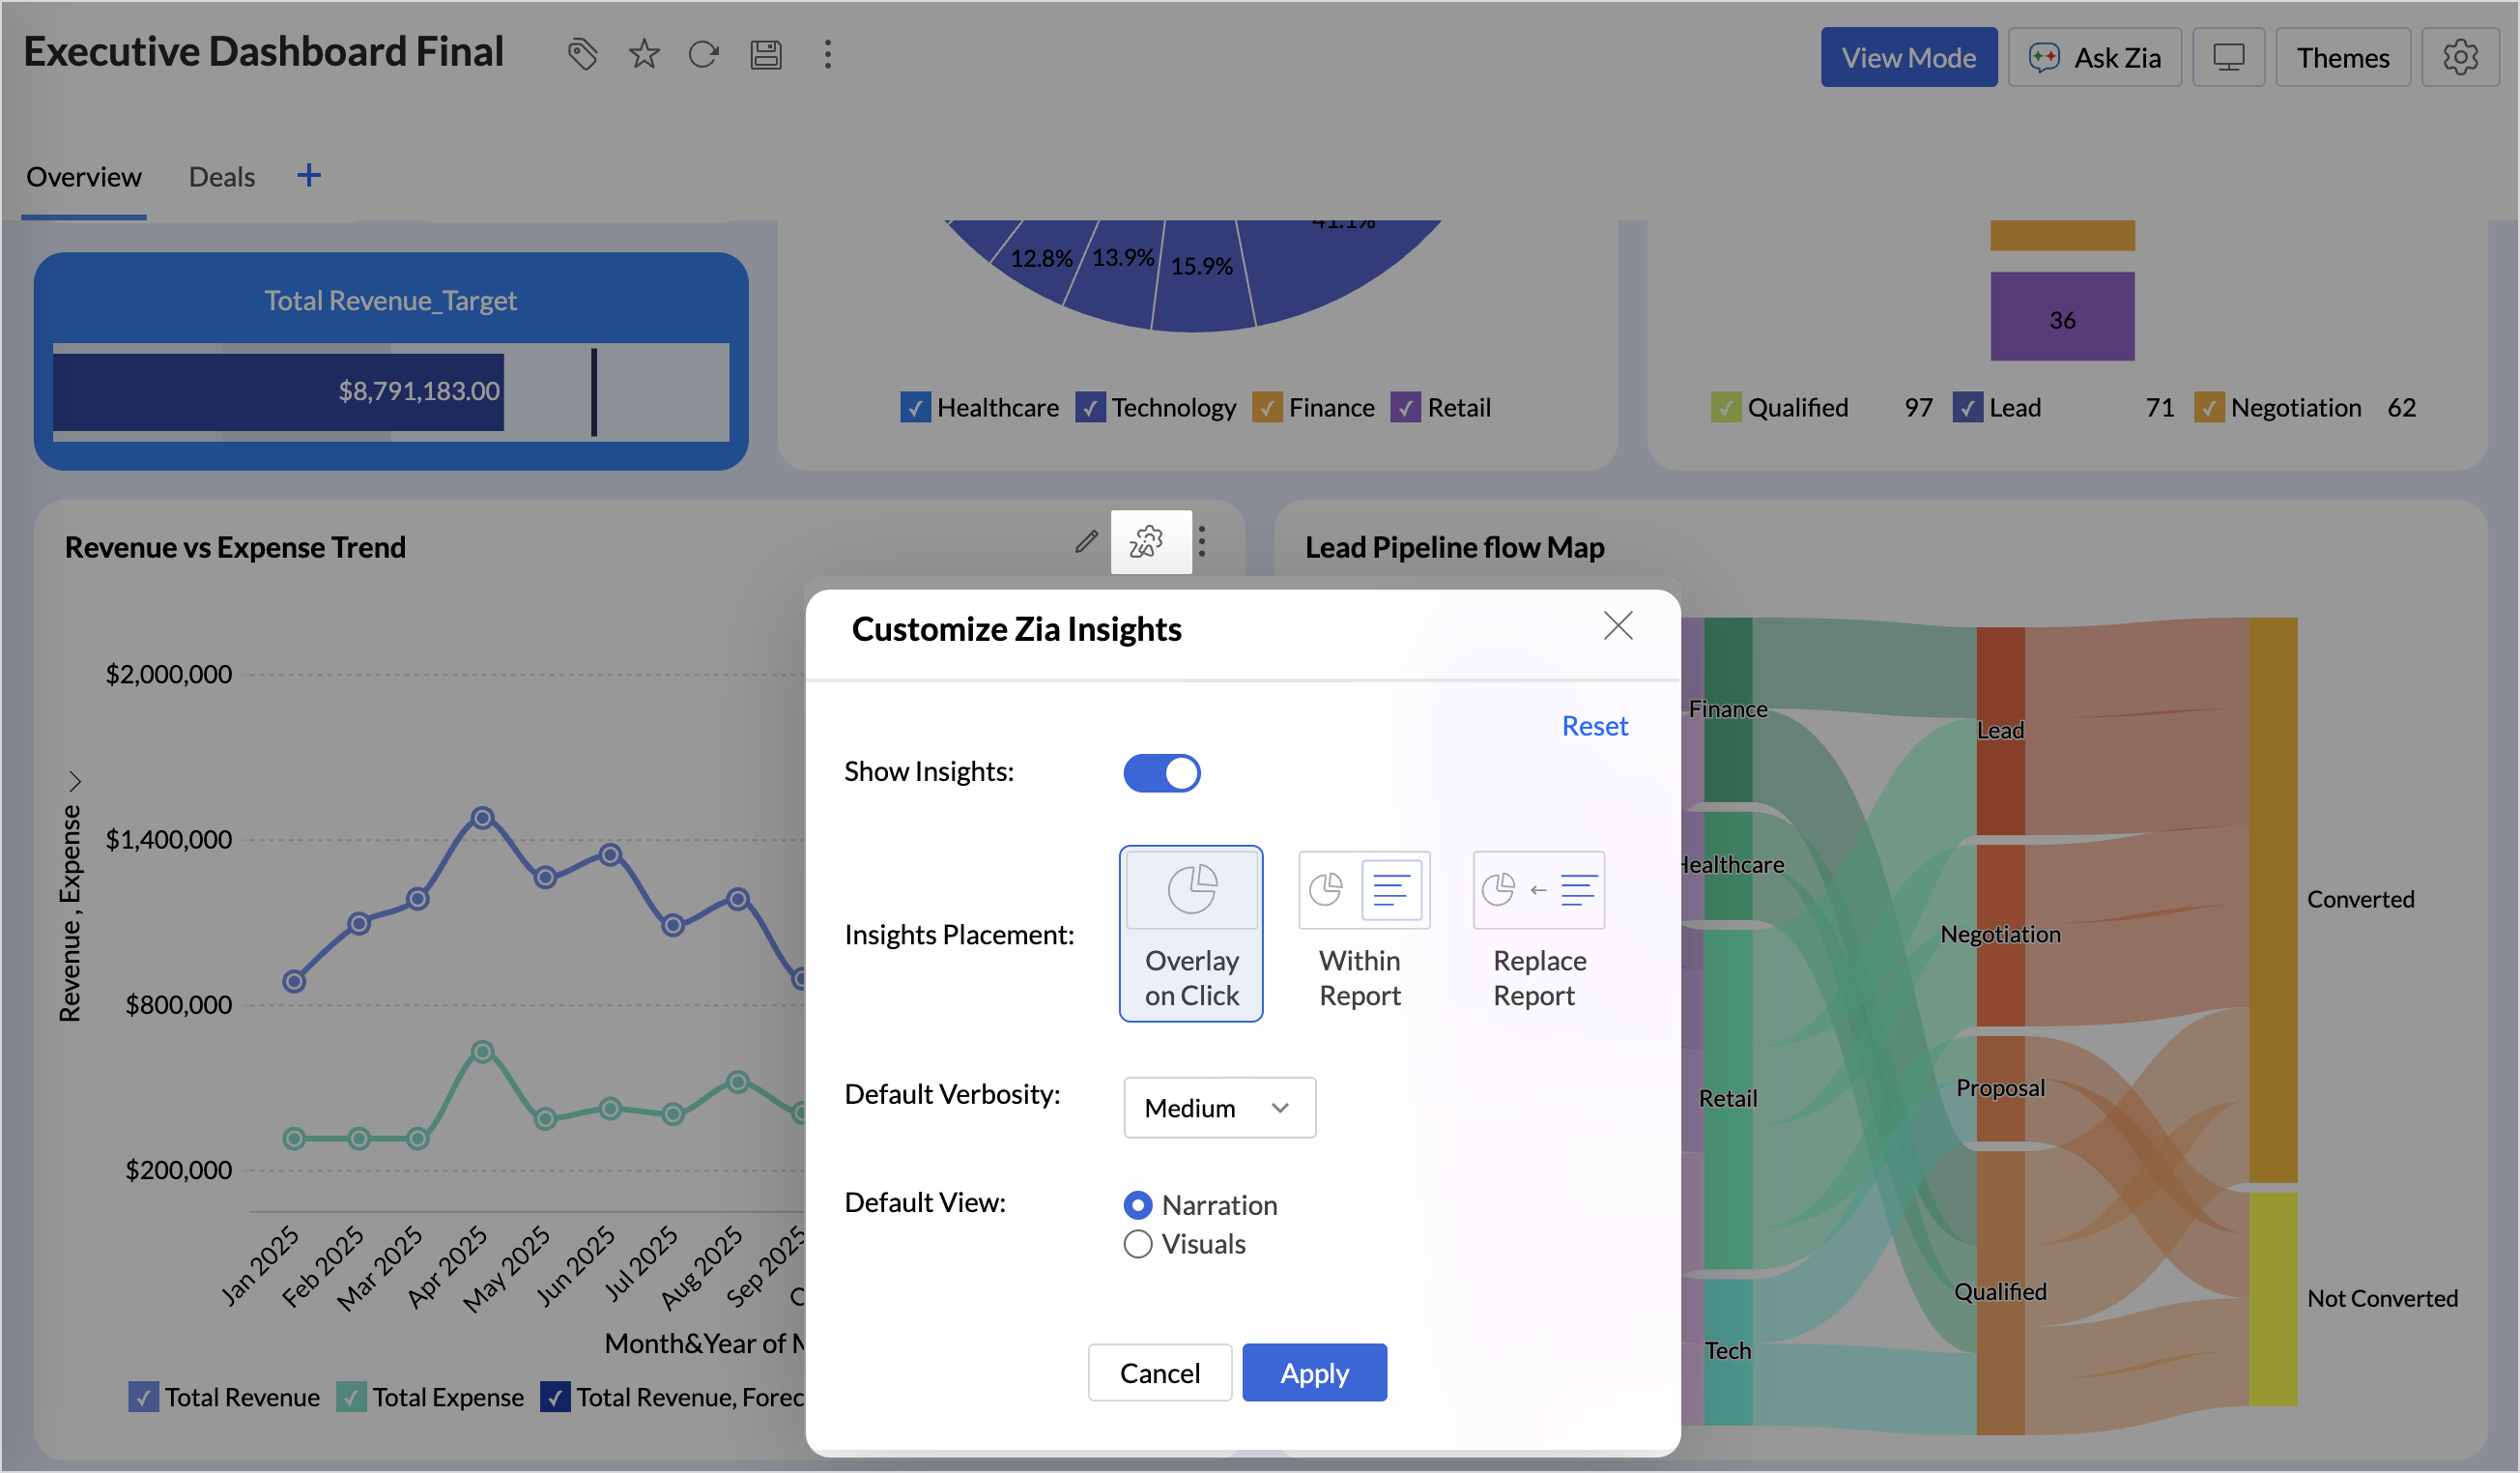
- Overlay: Displays insights in a floating panel that opens on demand, allowing users to review insights without leaving or altering the report view.
- Within Report: Embeds insights directly within the report, enabling users to view data and insights together in a single, continuous view.
- Replace Report: Displays insights as the primary view by replacing the report entirely, offering an insight-first experience focused on conclusions, rather than raw data.
Customize Image Size in Dashboards
Dashboards now support image size settings that let you control how images are displayed.

Choose from options like Original, Fit to width, Contain, or Stretch to ensure images align well with your dashboard layout, and thus improve visual clarity.
Tabular View Enhancements
- With this enhancement, all tables linked via lookup columns are now available in the Filter Criteria tab. This makes it easier to share views with users using associated filters, ensuring the specified criteria are automatically applied to the shared report.
- You can now customize lookup columns and the join paths used within Tabular View. This enhancement gives you control over how related tables are connected, helps avoid incorrect or ambiguous joins, and ensures more accurate and reliable data representation in your tabular reports.
New Business App Connectors
We have now introduced integration with two new business connectors Zoho FSM and Magento.
Zoho FSM
Connect your Zoho FSM Data with Zoho Analytics to analyze your field service operations in depth. Identify bottlenecks, optimize resource allocation with interactive reports and dashboards. Analyze revenue, service costs, and customer trends to improve profitability and service quality.
Adobe Commerce (Magento)
Analyze sales, orders, customers, and product performance with ready-made reports and dashboards. Track key metrics like revenue trends, average order value, and top-selling products. Gain insights into customer behavior and regional sales patterns. Make faster, data-driven decisions to optimize store performance and growth.
Topic Participants
Nisha Angel J
Sticky Posts
What's New in Zoho Analytics - January 2026
Hello Users! We are starting the year with a strong lineup of updates, marking the beginning of many improvements planned to enhance your analytics experience. Explore the latest improvements built to boost performance, simplify analysis, and help youWhat's New in Zoho Analytics - November 2025
We're thrilled to announce a significant update focused on expanding your data connectivity, enhancing visualization capabilities, and delivering a more powerful, intuitive, and performant analytics experience. Here’s a look at what’s new. Explore What'sWhat's New in Zoho Analytics - October 2025
Hello Users! We're are back with a fresh set of updates and enhancements to make data analysis faster and more insightful. Take a quick look at what’s new and see how these updates can power up your reports and dashboards. Explore What's New! ExtremeWhat’s New in Zoho Analytics – September 2025
Hello Users!! In this month’s update, we’re raising the bar across multiple touchpoints, from how you bring in data, plan and track projects to how you design and brand your dashboards. We’ve added the all-new Gantt chart for project visualization, expandedAnnouncing Agentic AI - Ask Zia!
We are delighted to roll out the new agentic AI capabilities in Ask Zia, where every stage of the BI workflow is assisted by AI. With a human-in-the-loop approach, Ask Zia ensures that you’re in command of the decision, while AI handles the complexity.
Recent Topics
Issue with Booking Confirmation Page Not Displaying, Leading to Customer Anxiety and Unnecessary Support Calls
I am writing to express my growing concern regarding the confirmation process in Zoho Bookings, particularly the inconsistent display of the confirmation page after a successful payment. As a mobile service provider, I rely on Zoho Bookings platform forIs it possible to turn off all capabilities for a customer to schedule, reschedule or cancel an appointment?
Is it possible to turn off all capabilities for a customer to schedule, reschedule or cancel an appointment? I would like to set it up so only staff can schedule appointments. Is this possible?Is there a way to generate a virtual meeting for a group service in Zoho Bookings?
Are virtual meetings not supported for group services/meetings? I have integrated Zoom with one-on-one services, but I need a way to create an online group meeting. ThanksWhere we can change the icon in social preview
Hi, we changed our logo, and the image that appear in preview (ex : when we post a appointment link somewhere) is still our old logo. I did change our logo in the org setting. https://bookings.zoho.com/app/#/home/dashboard/settings/basic-info?clview=falseZoho Bookings changes Lead Source
Hi. i would like to know if there's a way for Zoho Bookings to not change the lead source when booking a lead for an appointment as the lead source will be used in a report. Scenario: Lead source: Website after booking an appointment Lead source: Zoho Bookings Thanks. DanNeed to set workflow or journey wait time (time delay) in minutes, not hours
Minimum wait time for both Campaigns workflows and Marketing Automation journeys is one hour. I need one or the other to be set to several minutes (fraction of the hour). I tried to solve this by entering a fraction but the wait time data type is an integerSuggestion: Associating Assets with Company in Zoho FSM
Hello Team, I would like to share an idea based on practical experience. Currently, all assets in the Zoho FSM Asset module are linked to a specific contact person. I would like to know if it is possible to associate assets with a company instead. ThisZoho Inventory / Finance Suite - Extend Visibility of File Names on Attachment Fields
Hi Inventory / Finance Suite team, I noticed recently that when you add an attachment field to a module in Inventory, only the first 8 characters of the file name are visible on the details view. 8 characters is not a useful amount and there is plentyMany Notes Becoming Unusable
Hello. The Notebook app is becoming unusable. I'm getting odd-looking results from my searches. Some of the notes, after clicking on them, show an update button that does absolutely nothing. Not sure what has happened, but it would be nice to get thisKaizen #218: Actions APIs - Field Updates
Hello all!! Welcome back to a fresh Kaizen week. In the previous weeks, we covered Workflow Rules APIs, Actions APIs - Email Notification APIs, and Tasks Update APIs. This week, we will continue with another Actions API - the Field Update API in ZohoHow Contract Types and Templates Form the Backbone of Zoho Contracts
Every contract in Zoho Contracts starts with two essential elements: Contract Type and Template. These are not just administrative steps. They define how every contract in your organization is created, governed, and managed over time. Let us look at theZoho Books Finance Modules Not Accessible in Zoho CRM Mobile App
We have integrated Zoho CRM with Zoho Books using the Zoho Finance Suite integration. In the CRM web version, we can see the Finance modules (Estimates/Quotes, Invoices, Sales Orders, Items, Payments) and are able to create invoices and quotes directlyCRM Related list table in Zoho analytics
In Zoho Analytics, where can I view the tables created from zoho crm related lists? For example, in my Zoho CRM setup, I have added the Product module as a related list in the Lead module, and also the Lead module as a related list in the Product module.Zoho learn Custom portal - networkurl & CustomPortalId
I want to get my individual account’s networkurl and customportalId to use in this API: https://learn.zoho.com/learn/api/v1/portal/<networkurl>/customportal/<customportalId>/manual How can I retrieve the networkurl and customportalId using the API? IConnecting zoho creator to zoho writer to send prefilled documents
i will paste the worflow below // Get user's submitted data from the form userSalary = input.Current_Salary; userCIBIL = input.CIBIL_Score; userEmail = input.Email; userName = input.Name; // You need to get the Document ID from the URL of your Zoho WriterZoho Creator to Zoho Writer for prefilled documents...
In response to the question about connecting Zoho Creator to Zoho Writer for prefilled documents, I wanted to share a working implementation that demonstrates how to use the record_id parameter with the Zoho Writer Merge API. This allows Writer to automaticallyIntroducing our latest privacy enhancement - Hiding email IDs in Zoho Cliq Networks
Hello everyone, Zoho Cliq Networks offers a powerful collaboration platform that allows businesses to create dedicated digital workspaces for external vendors, partners, or individuals you want to communicate with professionally without adding them tozoho performance
OVERALL CONFIGURATION OF ZOHO PERFORMANCE Quarterly performance review Self rating and scoring Manager rating and scoringWhen will it be possible to edit Subform records via either views or tabular reports?
Hey there, data maintenance often requires mass update of quite a lot of records. While this is a piece of cake via either List view or Zoho sheet view, the same cannot be carried out for subform records yet. When one of the two options will be made available?Onboarding
Hello Team, Im yuktha working as HR at Ossisto Technologies. We are currently utilizing zoho for onboarding candidate. right now facing issue with onboarding Attaching the screenshots for your referenceHow do I change a form's name? Why isn't this more intuitive?
Can someone please let me know how to change a form's name?Control Over Zia Generative AI Reply Assistance Behavior
Hello, I would like to request an enhancement to the Zia Generative AI feature, specifically concerning the Reply Assistance within Zoho Desk. Current Issue: When replying to a ticket, the Ticket Properties section is automatically replaced by the ZiaZia now integrated with Open AI in Zoho Desk
The powerful integration of Zia with OpenAI, has empowered Zoho Desk reach a new level of efficiency and performance. With contextual self-service capabilities, Zia enables agents to boost their productivity and delivers superior customer experiences.Zoho Desk Partners with Microsoft's M365 Copilot for seamless customer service experiences
Hello Zoho Desk users, We are happy to announce that Zoho Desk has partnered with Microsoft's M365 to empower customer service teams with enhanced capabilities and seamless experiences for agents. Microsoft announced their partnership during their keynoteEmployee self-service portal: Onboarding and continuous learning platform for support reps
Hello everyone, In any organization, employees must go through multiple courses to learn about the product, their organization's standards, and how to respond to customer queries using the knowledge base articles available. This typically requires completing2024 Email Authentication Standards: Elevating Security with Google and Yahoo
In contemporary email communication, email authentication plays a pivotal role in mitigating email fraud, spam, and phishing attacks. Brace yourself for a new level of security. Starting February 2024, Gmail and Yahoo will be implementing robust emailContact custom field in layout
Good day, all, I have an "Extension" custom field in contacts, and would like to display the contact extension in the ticket layout, but I don't seem to be able to. What am I missing? Thanks RudyExact match in name when searching workdrive
Hello, I am wondering how to search workdrive files/folders with an exact match in the name. For example, when I search across folder with the url param search[name]=someName, I get multiple results such as "someName", "someNameAndMore", or "someNameaccount in a diferent bas currency
Is it possible to have an account in currency diferente from base currency?, lets say, the bas currency in japase yen but asset accut called cash dollars in dollars?Meeting impossible to use when sharing screen
he Meeting tool in Brazil is practically unusable when sharing anything, whether it’s a presentation or simple navigation. When accessed via Cliq, the situation gets even worse: even basic calls fail to work properly, constantly freezing. And as you areChanging the Default Search Criteria for Finding Duplicates
Hey everyone, is it possible to adjust the default search criteria for finding and merging duplicate records? Right now, CRM uses some (in my opinion nonsensical) fields as search criteria for duplicate records which do nothing except dilute the results.Is there a way to create a desktop shortcut for a website course portal?
Hello everyone, I recently got a laptop and bought an online course from a website, Skillwint.com, which I visit regularly. I open that site many times a day and want to create a desktop shortcut so I can open it directly instead of searching in the browserSalesIQ Tip for Admins: Your Safety Net for Data Recovery
Ever clicked 'Delete' in your SalesIQ and then realized it was the wrong item? Maybe it was a prospect's chat that held important context you needed to refer to later on. Or, maybe you deleted an elaborate Zobot that you were still testing or planningDepreciated mergeAndStore Function Help!
Hello, I have a function designed to create a PDF containing information from the fields in a Deals record. There is a Writer Mail Merge template in WorkDrive that is populated via Deluge code, and a copy of the resulting PDF is then attached to the record.Can I execute two 'functions' when completing a mail merge from CRM?
Hi, I have set up a mail merge from CRM Deals to a template. I want a copy of this to be saved in Workdrive, and then a copy also saved back into the deal record from which the merge occurred. I can do both independent of each other, and managed to getExternal Share > Edit: Cannot Create Zoho Files
Hi Zoho, When we create an external share link with Edit permission, our external users are unable to create a Zoho file (Zoho Writer, Zoho Sheet and Zoho Show). They can only upload files. They can edit the Zoho files if we create them internally andZoho Mail iOS app update - RTL languages support and access emails using permalink and universal link, image upload resolution
Hello everyone! In the most recent version of the Zoho Mail iOS app update, we have brought in support for RTL languages(Arabic and Urudu), providing a seamless reading experience with proper text alignment and layout throughout the app. We have alsoWhy are emails sending with @viazohocrm.com ?
I just sent out mass emails from CRM. They are sending from the email below and people cannot reply, and they are getting this message: Address not found Your message wasn't delivered to sales.XXXXXXXX.com.au@viazohocrm.com because the address couldn'tDuplicating and referencing datasets
I am moving from PowerBI to Zoho Analytics and while I find Zoho easier to use in many ways, there is one function that I use in PowerBI that I have not been able to find in Zoho. I have several data sets that I need to modify in different ways to getZoho Inventory Now Supports VeriFactu for Businesses in Spain
Starting from January 1, 2026, Spain requires real-time invoice reporting for all B2B transactions. From July 2026, this requirement will extend to B2C transactions as well. All reporting must be carried out through the VeriFactu to AEAT (Agencia EstatalNext Page