Working with Alarms
The different views of Alarms allow users to examine alarms in detail, providing insights into their nature, severity, and history. The application also includes features to view related alarms, helping users identify connections between different incidents, and a timeline view that tracks actions performed over the alarm facilitating efficient alarm management.

Refer to the Understanding Alarms document before proceeding with this document to understand the flow and terminologies.

All Alarm operations require necessary permissions. Refer to Users and Profiles document for more details.
Viewing Alarms
The generated alarms can be viewed in the Alarms list view by clicking on the Alarms > Alarms in the left navigation bar in the End Application.
List View
By default, all alarms in the application are displayed in the list view. The list view contains all the generated alarms and selective details about each, in a tabulated view as displayed below.The list view offers the following customization options:
Option Description Column Customization You can include or remove columns in the list view, and to arrange the columns in the desired order. Sorting Records You can sort records in a column in descending or ascending order. Filtering Records You can filter and view subset of alarms.
Filtered View
The 'Source' column in the filter option can be used to filter and view alarms that originated from a particular source. You can filter using two options: either the source is 'Located At' a specific location, or 'Under' that location and its hierarchy.
For example, consider a location North Plaza Main, where two DGs, DG1 and DG2, are located. To view the alarms that originated from these two sources (DG1 and DG2) present at North Plaza Main, you can filter using:
Source → Located At → North Plaza Main.Now, assume there are two other locations under North Plaza Main: West Wing, where DG3 is located, and East Wing, where DG4 is located. To view alarms that originated from the DGs present at North Plaza Main, West Wing, and East Wing, you can filter using:
Source → Under this Location → North Plaza Main.
Live Alarms
In the Alarms list view, you can enable the Live View using the Live toggle button. When enabled, the latest alarms are instantly added to the top of the list.

When Live View is enabled, sorting options are disabled, and new alarms are always displayed at the top of the list.
Actions from the list view
The actions that can be performed from the list view are highlighted with separate screenshots for each action below.Viewing Alarm History
- Click on the View History button to view the history related to the alarm.
Info: All alarms generated for a managed entity are recorded under Alarms History. The latest or current alarm is considered the active Alarm. In other words, all alarms that preceded the current Alarm form the Alarms History.
Note: Alarm history for a managed entity can also be viewed from the respective managed entities list view i.e. devices, assets, or locations list views by selecting the managed entity and clicking on the View Alarm History button on top of the list view.
Assign User
- Click on the Assign User button to assign the alarm to an user.
Info: Alarms can be manually assigned to users to send them notifications, prompting them to take the necessary actions. This immediate notification ensures that the user is aware of the problem and can quickly respond to mitigate any potential impact.
Clear Alarm
- Click on the Clear Alarm button to clear the alarm manually.
Info: Typically, the system automatically clears an alarm when the fault is resolved and the same will be reflected in the application. In rare cases, when the fault has been rectified but the alarm remains uncleared, you can manually clear the alarm using the Clear Alarm option.
Delete Alarm
- Click the Delete Alarm button to delete any invalid alarm.
Alarm Details View
Complete details of an alarm can be viewed by clicking on any alarm name in the list view. The details about the alarms are displayed under the tabs: Summary, Alarm Details, Alarm History, Related Alarms, and Timeline.
The actions that can be viewed from the Alarm Details view are highlighted with a separate screenshots for each action below.
Tab Description Summary Alarm Details History Related Alarms Timeline
Alarms Summary View
Acknowledge/Unacknowledge Alarms
Acknowledging the alarm indicates that a user or system operator has recognized the alarm and is taking steps to address the issue, ensuring it is being attended to. It can be reverted to the unacknowledge state if the alarm was acknowledged by mistake or it needs re-alert.
- Click on the Actions > Acknowledge button to acknowledge the alarm.
- Click on the Actions > Unacknowledge button to revert.
Note: The acknowledged/unacknowledged status is used in trigger conditions in escalation and resolution actions in notification profiles. Escalation actions can be triggered for unacknowledged alarms, while resolution actions can be tied to acknowledged alarms.
- The acknowledgement details can be viewed from the Details tab next to the Summary tab.
Note: Acknowledging an alarm allows users to pause repeated alerts and associated actions for the same state. This can done using the Noise Reduction and Suppress updates for acknowledged alarms option when configuring alarm rule state.
Details View
The Details View provides all alarm details.
History
Related Alarms
Timeline
Managed Entity Alarms View
Alarms generated for a particular managed entity (ME) in the application such as device, asset, and location can be viewed from the details page of the particular entity. The Alarms tab in the information page of the ME contains all the alarm information. The Source and Related Alarms can be viewed using the toggle button.
| Alarm Type | Description |
Source Alarm | In managed entity's details page, the alarms that have source same as the managed entity is termed as source alarm. |
Related Alarm | In managed entity's details page, the related alarms are listed based on the relationship of this managed entity with other managed entity. |
More alarms can be configured for an ME from this view using the Alarm Rule Configuration option.
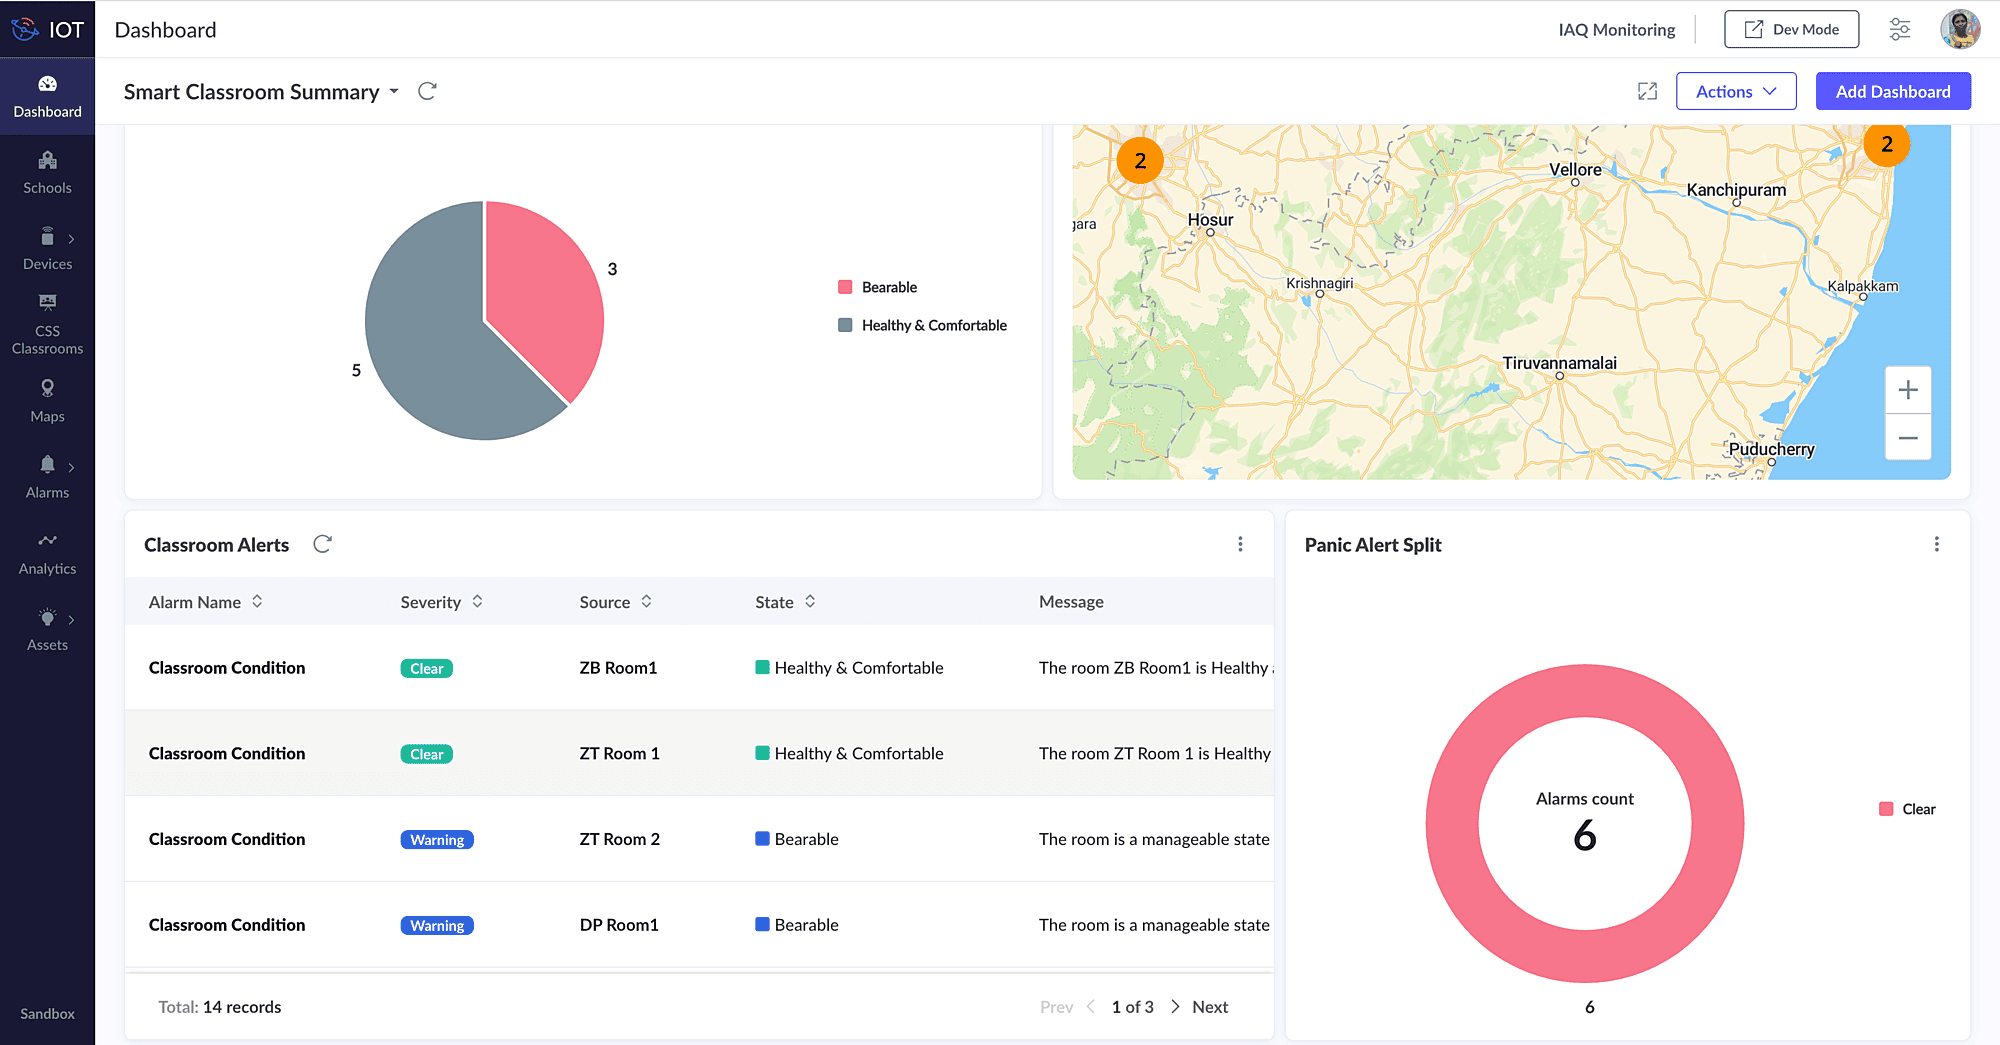
Dashboard View
Alarms can be viewed from the global dashboard in Zoho IOT by configuring appropriate widgets. The various widget types: Card, Dial, Image and Table can be used to display alarms and their relevant information.
See Also