Geo-Powered Retail Intelligence with Zoho Analytics
In today’s highly competitive retail landscape, data-driven decisions are no longer optional — they’re essential. While businesses collect vast volumes of data across regions, stores, and customer segments, the real value lies in how effectively this data is visualized and interpreted.
Geo Maps in Zoho Analytics bring location intelligence to the forefront of decision-making. With powerful spatial analytics capabilities, retail businesses can now visualize store performance, identify untapped opportunities, and track customer behavior trends with a simple glance at a map.

This solution demonstrates how Zoho Analytics' Geo Maps can be leveraged to solve real retail business problems, using a step-by-step approach grounded in a practical, ready-to-use dataset.
- Business scenario
- Dataset Overview
- Problem Description
- Why Geo Maps Become a Game-Changer
- Solution Implementation – Report Creation
- Store Performance Analysis (Map – Bubble)
- Revenue-to-Traffic Ratio with Ghost Zone Detection (Map - Filled + Scatter)
- Competitor Pressure Zones (Map – Scatter)
- Customer Gender Distribution (Map - Pie)
- Summary
Business scenario
Imagine you're a retail chain operating hundreds of stores across the United States. Each store generates data—sales, visitor footfall, customer satisfaction, marketing spend—but these numbers alone don’t explain why some stores succeed while others under-perform.
Key challenges include:
- Identifying stores that are struggling before sales drop significantly.
- Understanding whether poor performance is due to location, low visibility, or intense competition.
- Evaluating which regions offer true expansion potential—and which are over-saturated.
With no visual correlation between location and business KPIs, many decisions remain reactive instead of proactive. This is where Geo Maps make all the difference—by transforming isolated data into contextual geographic insights.
Dataset Overview
To power this solution, we’ve created a comprehensive and realistic retail dataset that mirrors how actual store data behaves across geographies.
The dataset includes:
- Store-level performance data: revenue, average purchase value, and satisfaction.
- Customer insights: foot traffic, age, gender distribution.
- Market context: competitor presence and market share, population density, and economic growth rate.
- Geospatial data: zip code, city, state, latitude, and longitude of each store location.
Problem Description
Retail chains often operate on thin margins, and even minor under-performance at store level can have significant impacts across the organization. While dashboards provide revenue and performance trends, they often miss one critical dimension—geography.
Without geographic context, businesses face several recurring challenges:
- Underperforming stores go unnoticed until major losses occur.
- Ghost zones—areas with low store presence but high potential—remain unexplored.
- Marketing budgets get wasted in regions where returns are consistently low.
- Competitor pressure is misjudged due to lack of visibility on regional saturation.
- Store closures become reactive decisions, made after performance has already declined.
In short, data without location awareness leaves decision-makers blind to spatial trends and risks. Businesses need a smarter, more intuitive way to analyze store performance with geographical clarity—before it’s too late.
Why Geo Maps Become a Game-Changer
Geo Maps in Zoho Analytics address this gap by unlocking a visual layer of intelligence that traditional charts can’t offer.

Here’s what makes them a game-changer:
- Location-first insights: Instantly identify how store performance varies across the map - by city, state, or neighborhood.
- Visual correlation of multiple KPIs: Compare revenue, satisfaction, and foot traffic geographically to detect hidden patterns.
- Clutter-free, customizable visuals: Choose the right map type - bubble, filled, pie, or scatter - to match the data you want to analyze.
Unlike static dashboards, Geo Maps enable you to see the problem, context, and opportunity—all in one frame. Whether it's spotting trends, reallocating marketing spend, or planning expansion, this spatial layer puts decision-makers back in control.
Solution Implementation – Report Creation
This section walks through the step-by-step creation of four key Geo Map reports that reveal business insights from store-level data.
1. Store Performance Analysis (Map – Bubble)
To identify how stores are performing across different regions in terms of revenue and customer satisfaction, using a clean, visual-first map representation.
This helps uncover:
- High-performing stores in key zones
- Underperforming regions needing intervention
- Patterns related to location-based store success
Why Map - Bubble?
The Map - Bubble chart is ideal for visualizing store-level metrics using geolocation.
- Size indicates magnitude (e.g., Monthly Revenue)
- Color indicates health or quality (e.g., Customer Satisfaction)
- Each store appears as a distinct bubble based on its lat/long.
Procedure
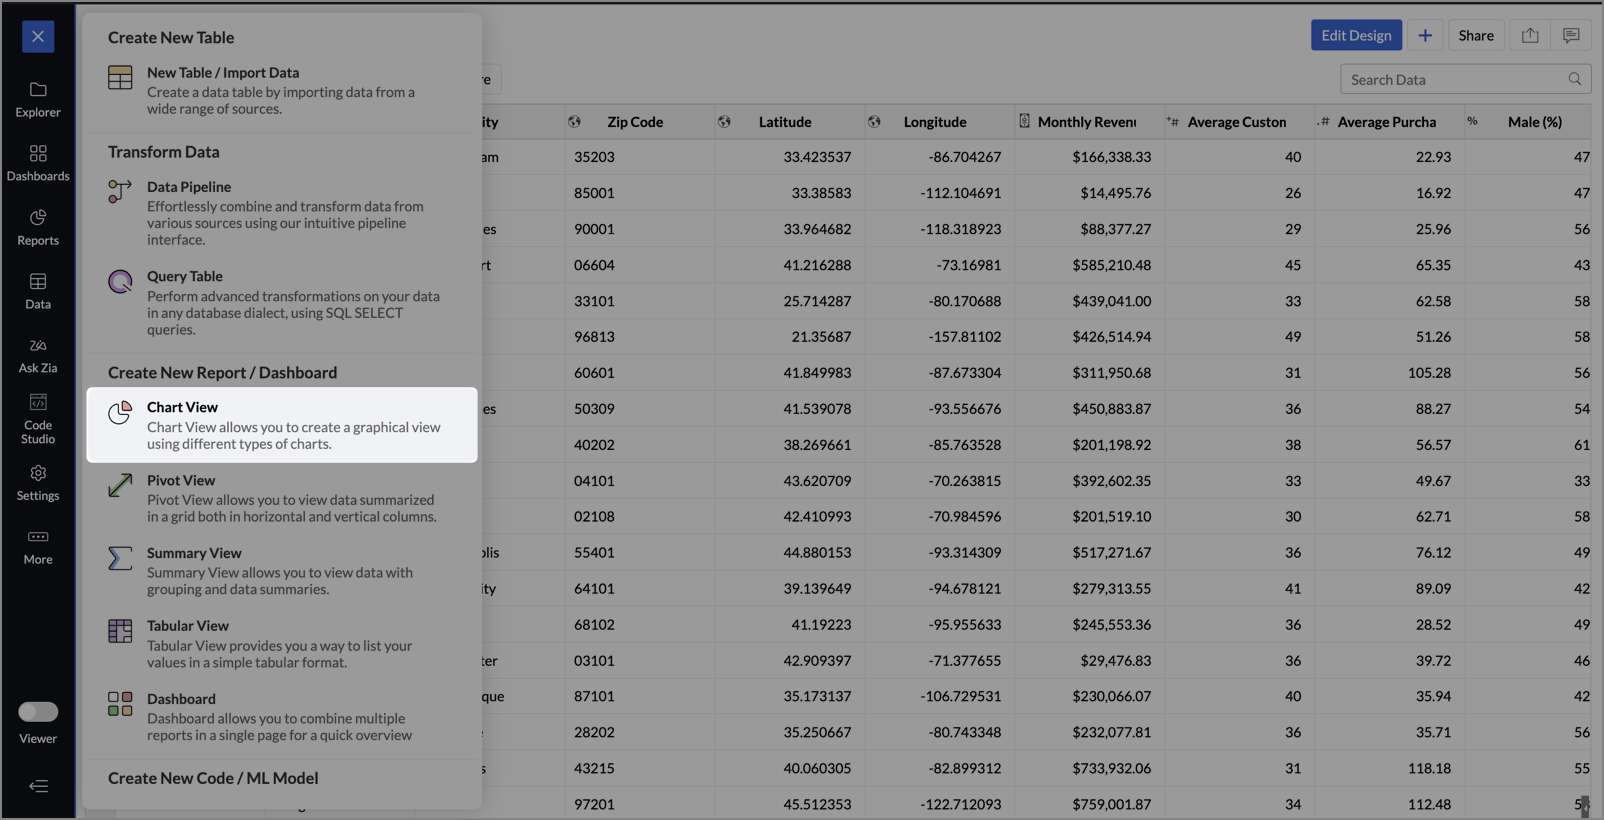
- From the dataset, click the Create icon and select Chart View.
- On the designer page, drag and drop the following columns into their respective shelves:
- Latitude → X-Axis
- Longitude → Y-Axis
- Customer Satisfaction (out of 10) → Color
- Monthly Revenue (USD) → Size
- Store ID, Store Type, City → Tooltip
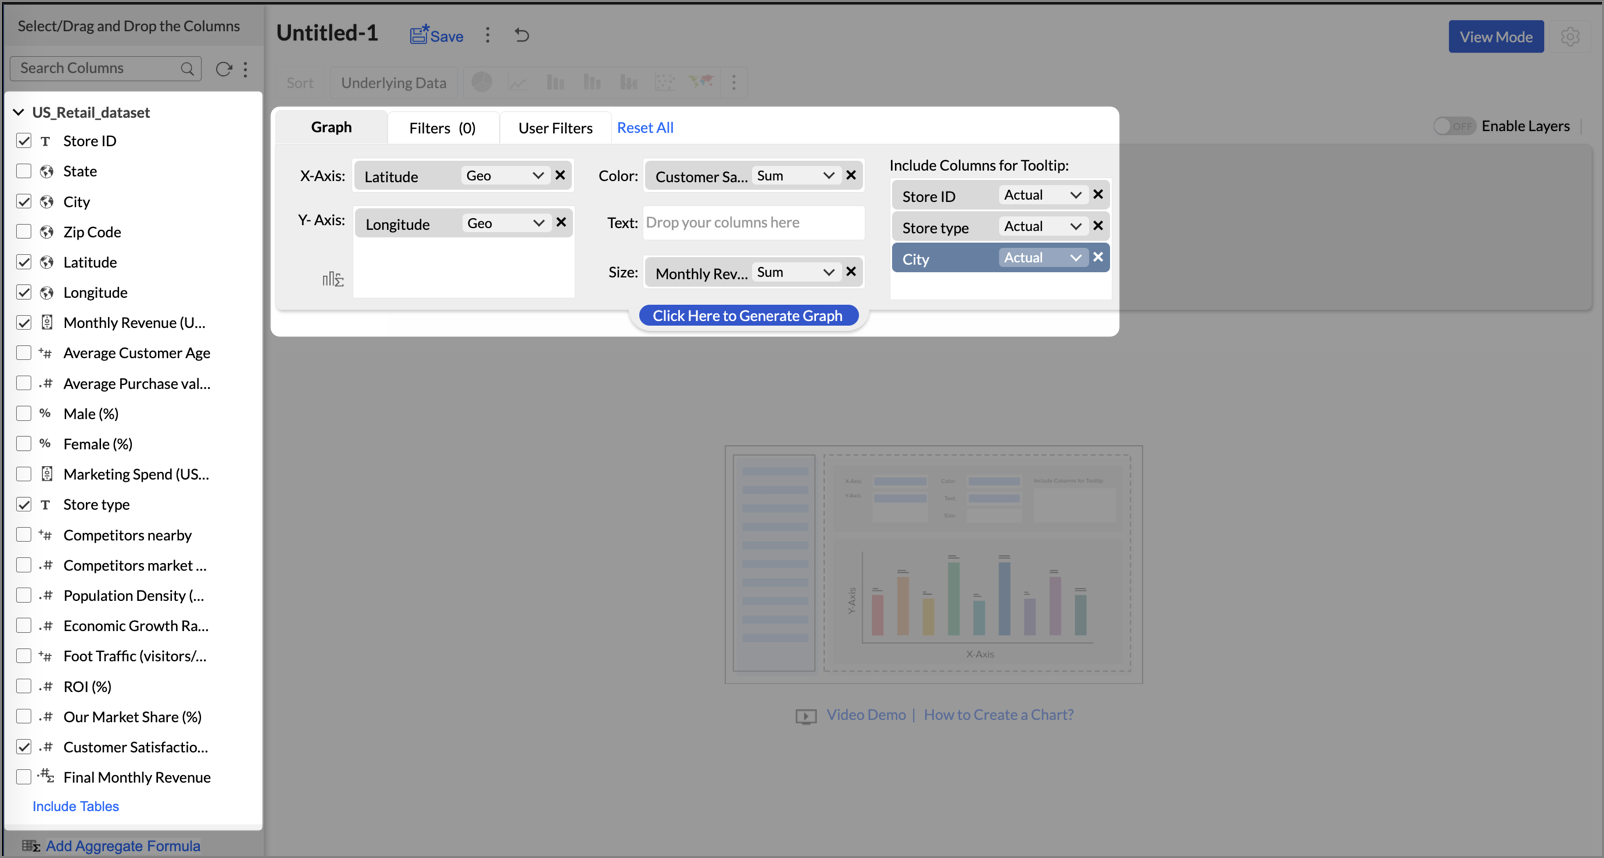
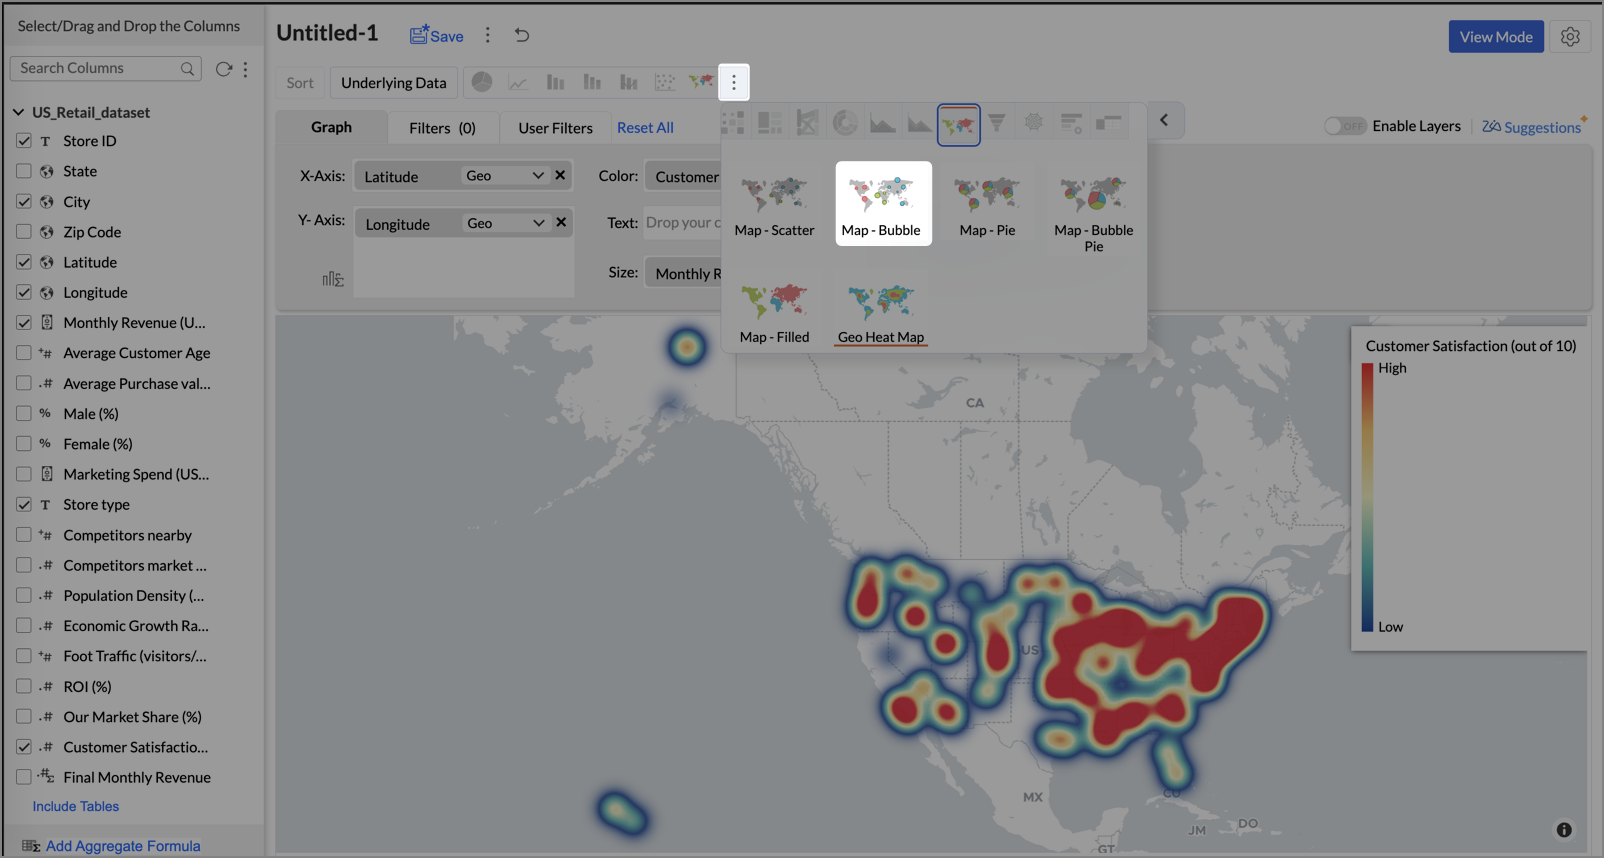
- Click Generate Graph.
- Click on the ellipsis icon and select the chart type as Map - Bubble.
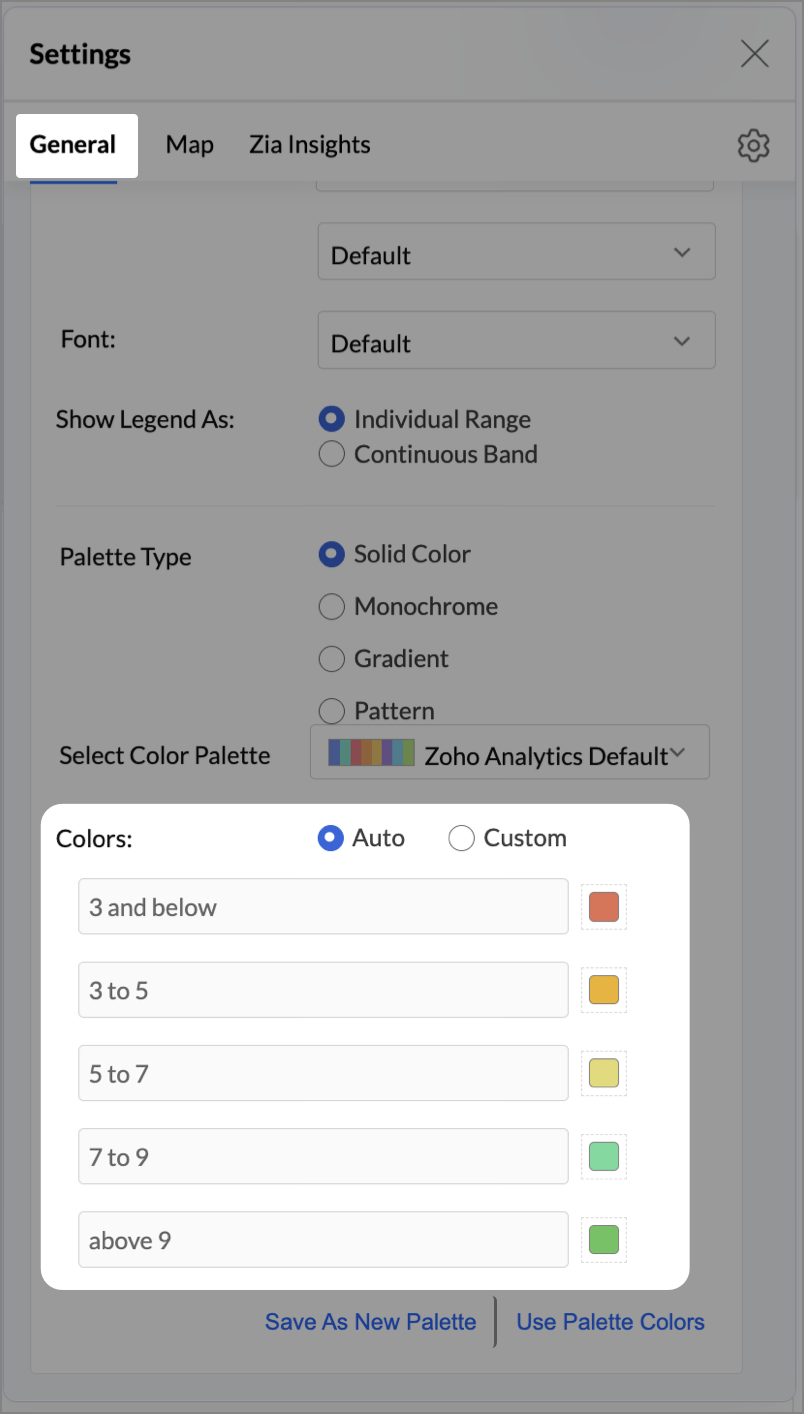
- Click the Settings icon, and under the General tab, click Legend.
- In the Colors section, customize the color scale from red to green to represent satisfaction ranges.
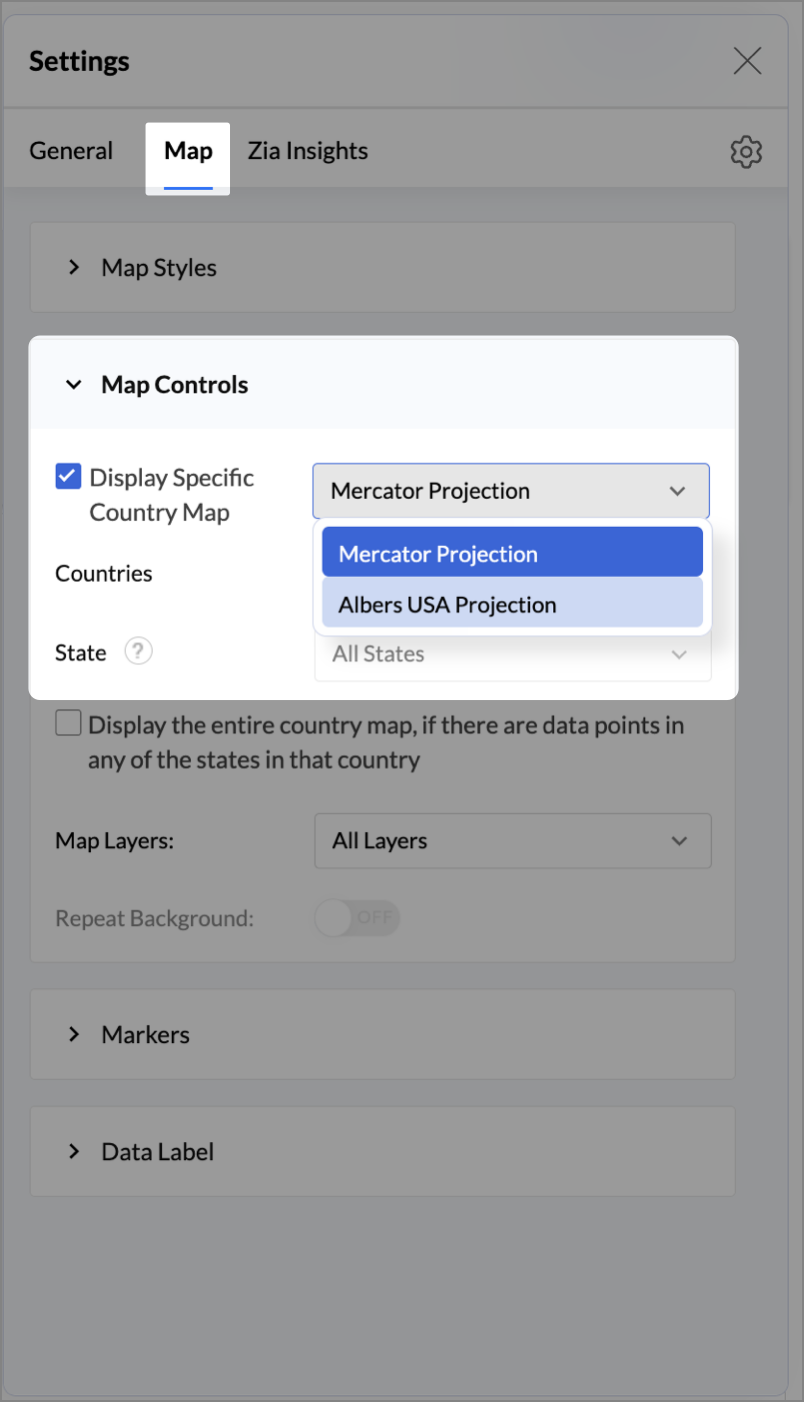
- Under the Map tab, click Map control and enable Display Specific Country Map.
- From the drop-down, select Albers USA Projection. This displays the USA map by placing Alaska and Hawaii below the mainland USA on a single map.
- Rename the report as Store Performance and click Save.
Tip:
Add a User filter such as Store type or State to analyze performance by segment.
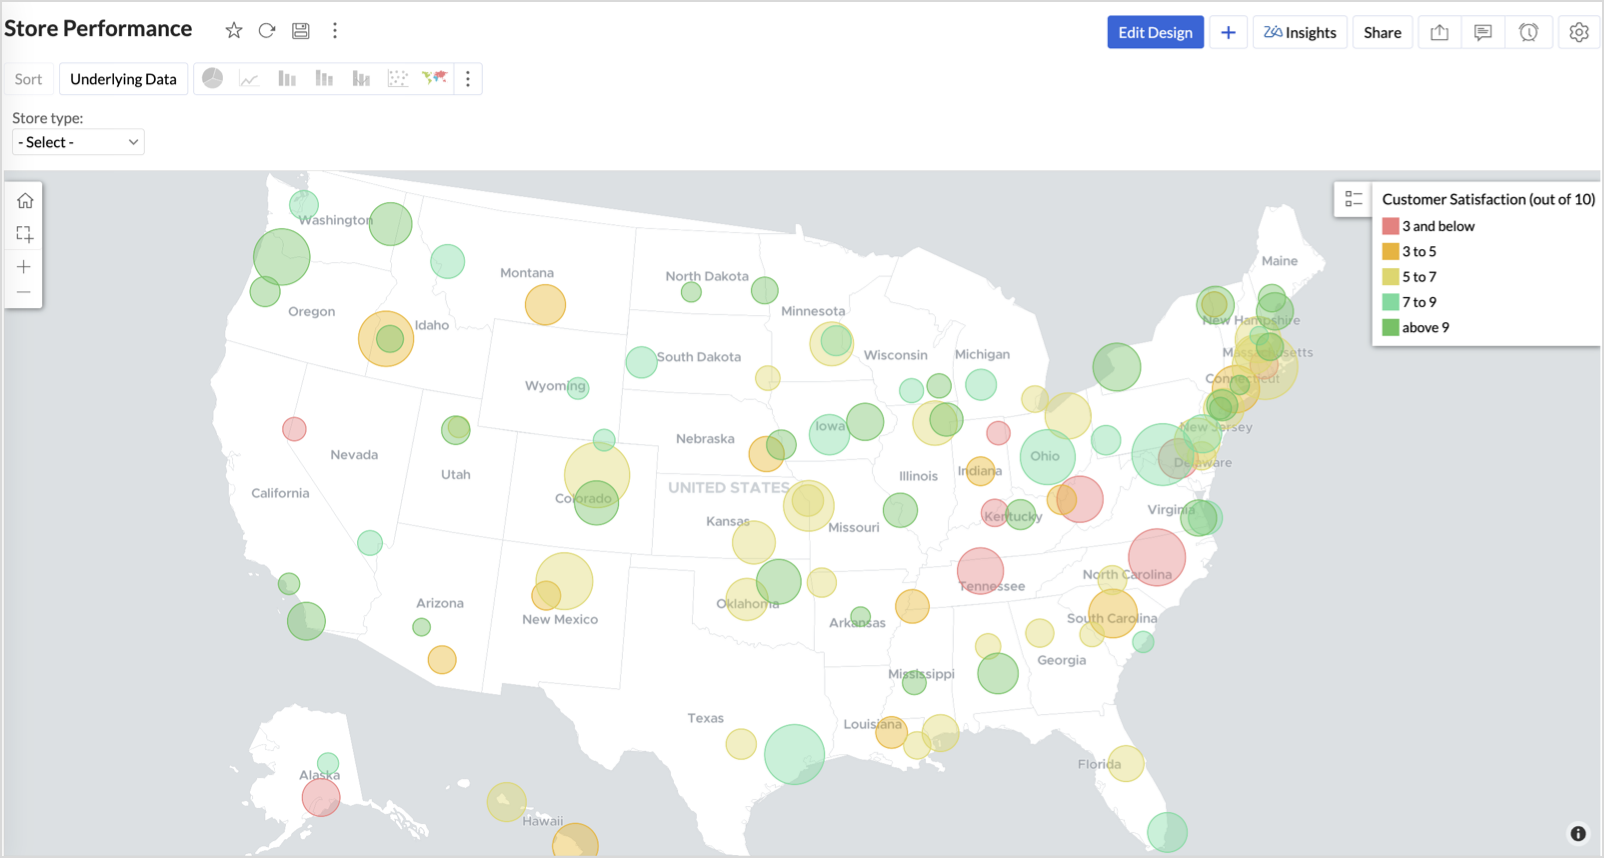
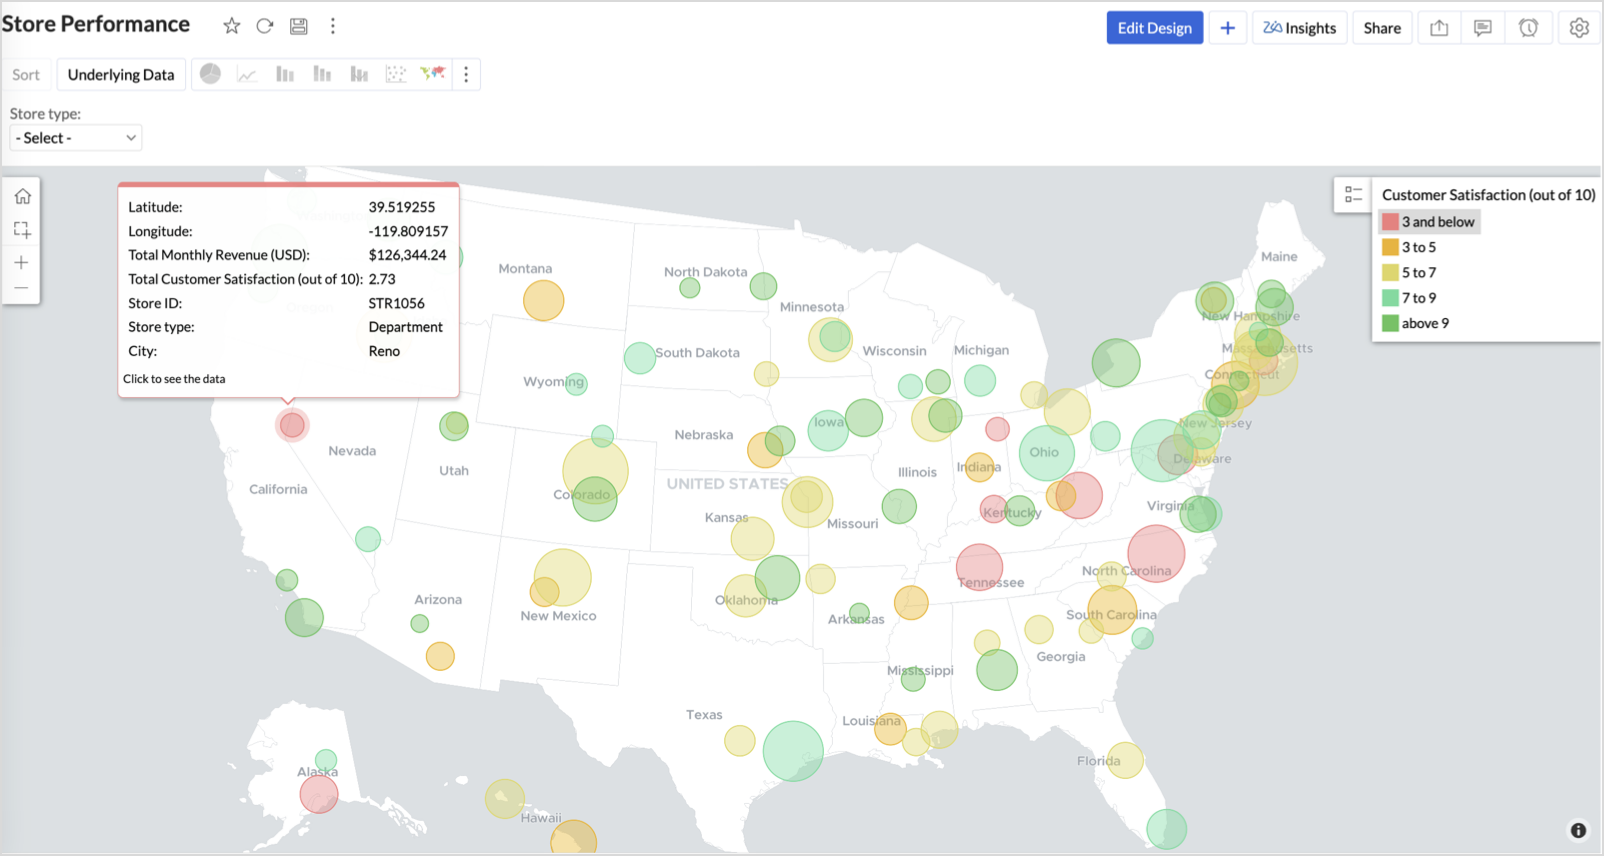
This configuration creates a bubble for every store, sized by its revenue and colored by customer satisfaction — instantly showing how happy customers are in high- or low-revenue zones.

Key Insights
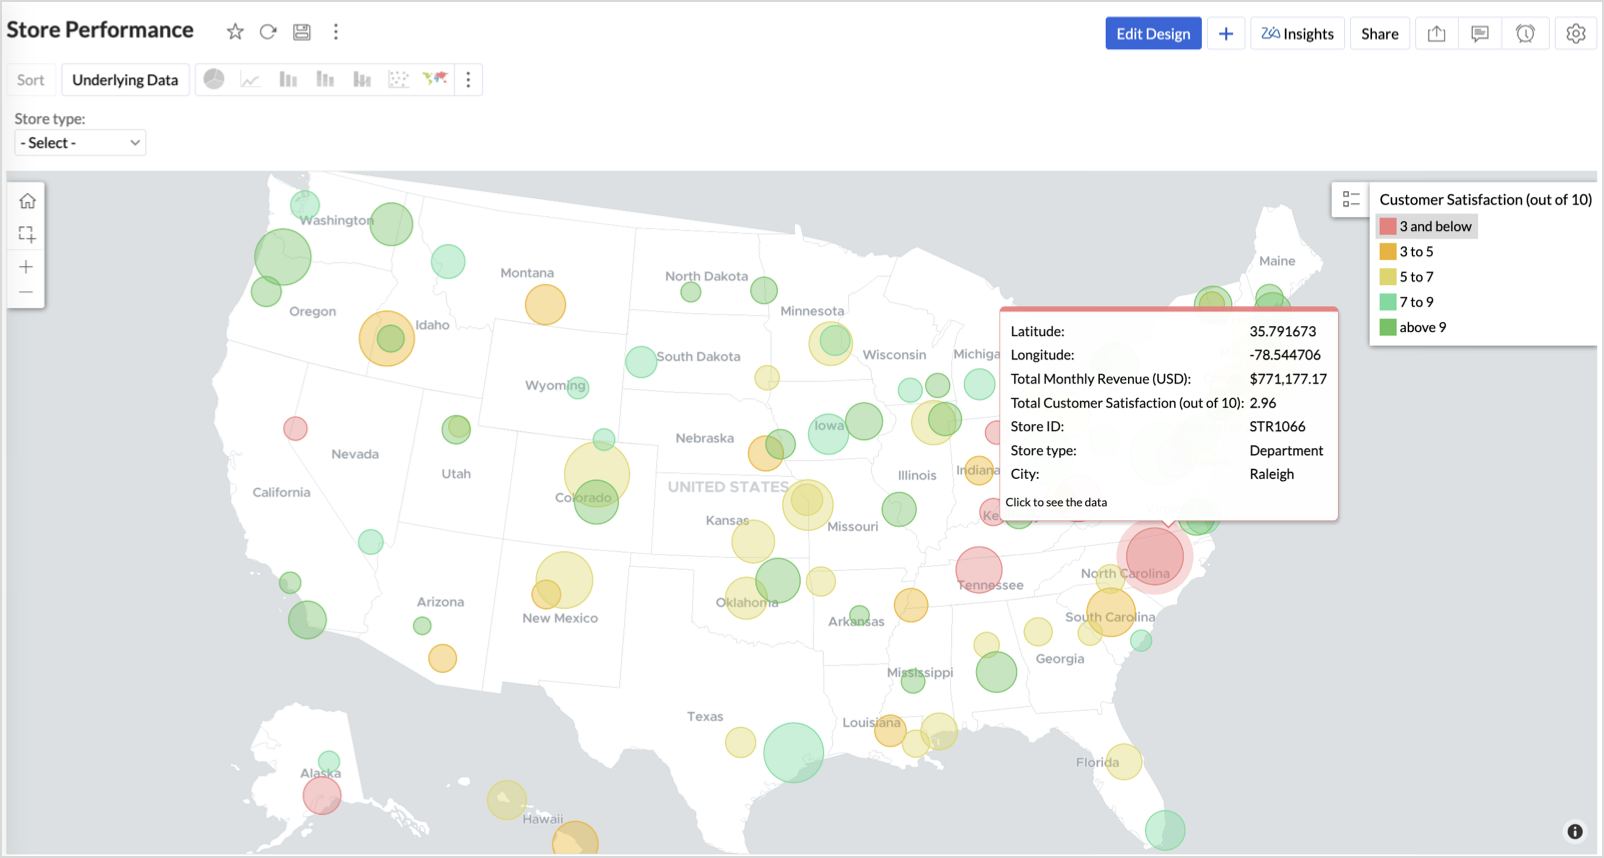
Large bubble + Red color - High revenue but poor satisfaction — risk of churn!

Small bubble + Green color - Low revenue but high satisfaction — possibly underserved
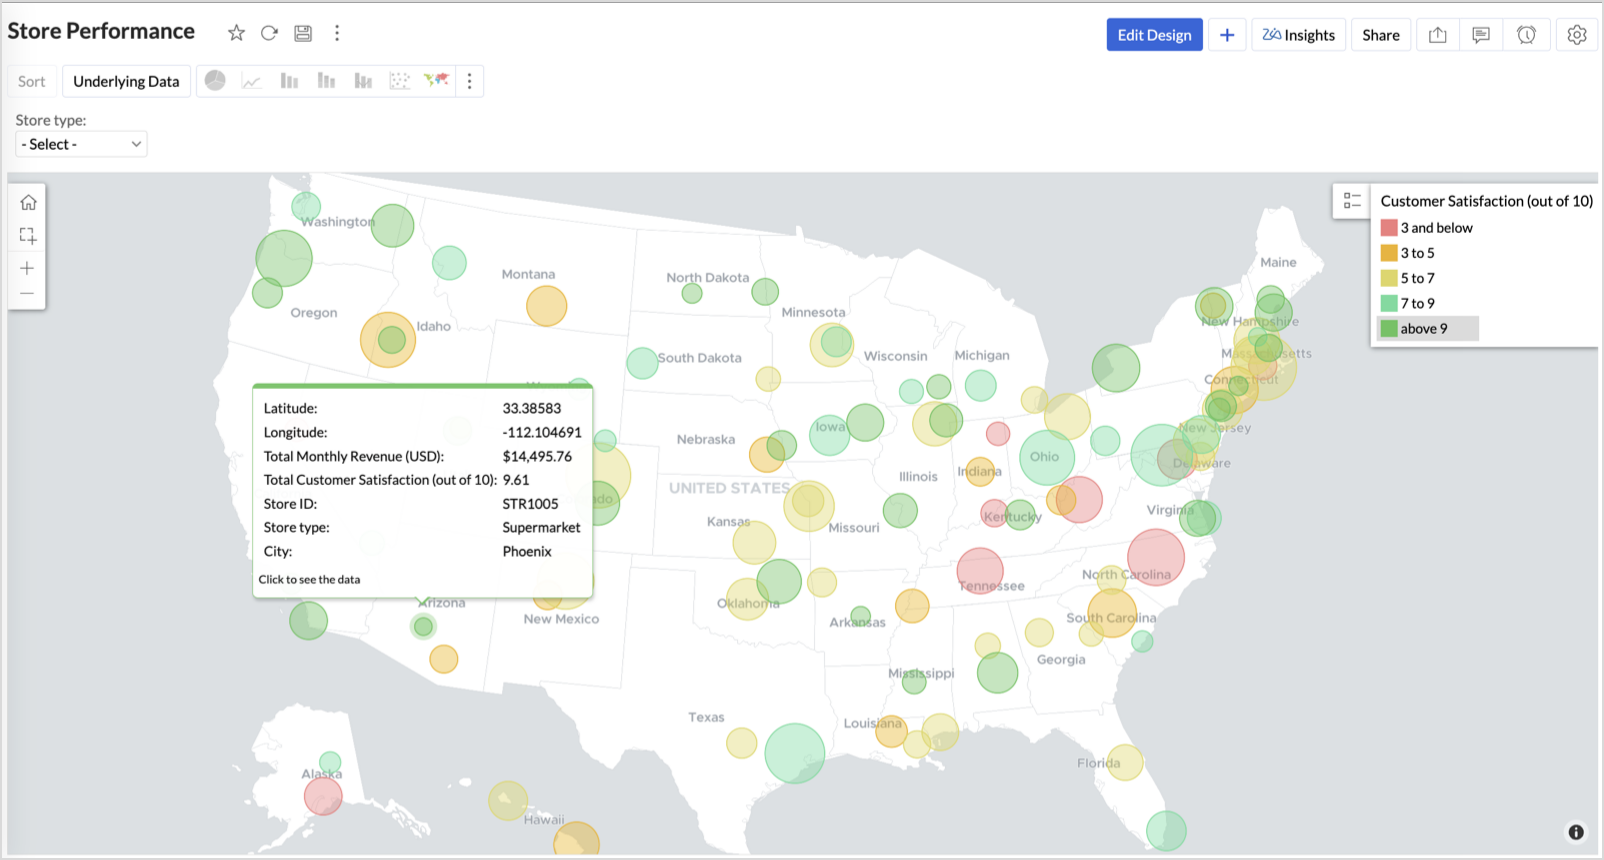
Large bubble + Green color - Healthy performers — consider replicating success
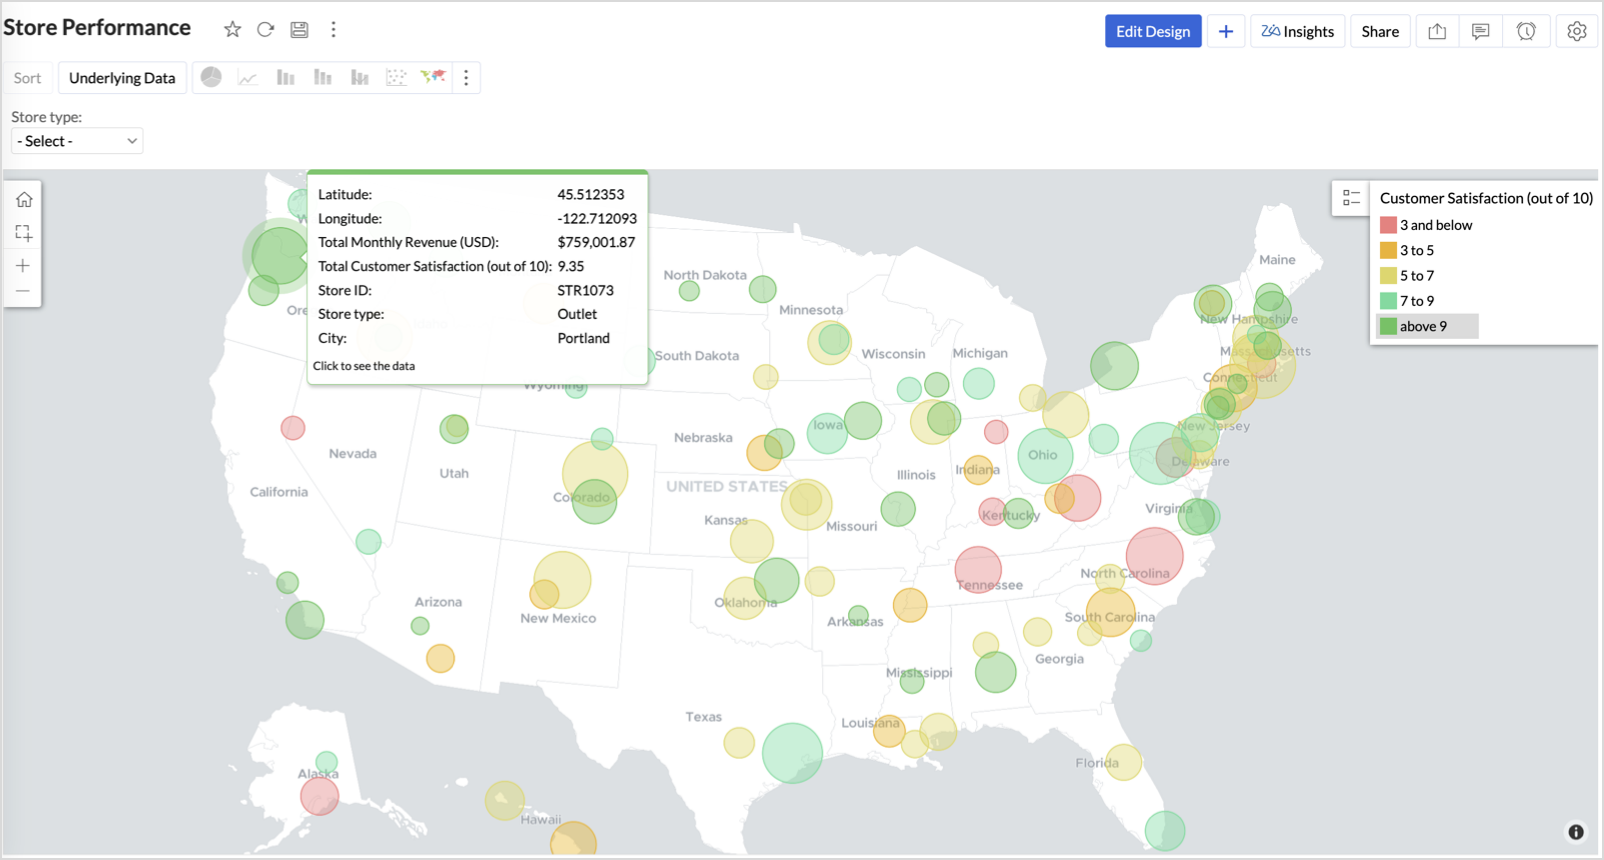
Small bubble + Red color - Low performers — review for possible closure or revamp.
Business Interpretation
This chart acts as a live performance map for executives and analysts. Instead of scanning through tables or KPIs, stakeholders can instantly spot outliers, prioritize investments, and plan corrective actions by just glancing at the map.
2. Revenue-to-Traffic Ratio with Ghost Zone Detection (Map - Filled + Scatter)
To evaluate how efficiently each state is converting foot traffic into store revenue — and more importantly, to identify high-footfall regions without store presence, often referred to as ghost zones.
This chart helps:
- Compare state-level foot traffic against actual revenue
- Spot underutilized or over-performing regions
- Discover untapped markets with high visitor potential but less to no physical stores
Why Map - Filled + Scatter?
- The Map - Filled chart provides a regional perspective of traffic density and revenue generation.
- The Scatter layer overlays actual store locations based on latitude and longitude.
This powerful combo allows you to measure performance where you’re active and spot opportunities where you're not.
Procedure
- From the dataset, click the Create icon and select Chart View.
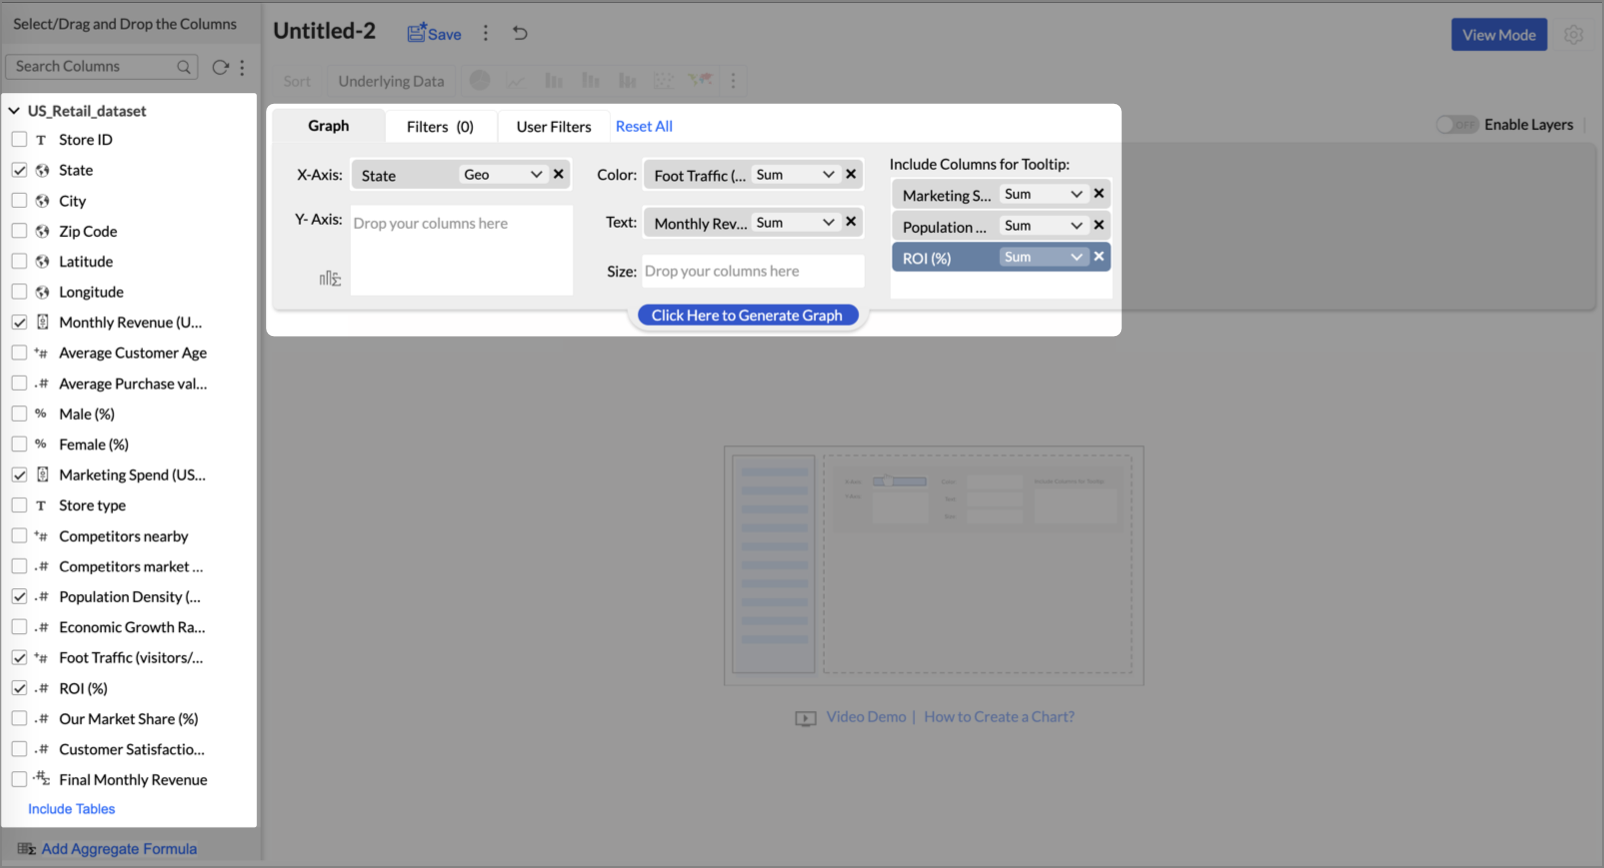
- On the designer page, drag and drop the following columns into their respective shelves:
- State → X-Axis
- Foot Traffic (visitors/month) → Color
- Monthly Revenue (USD) → Text
- Marketing Spend (USD), Population Density (people/sq km), ROI (%) → Tooltip
- Click Generate Graph.
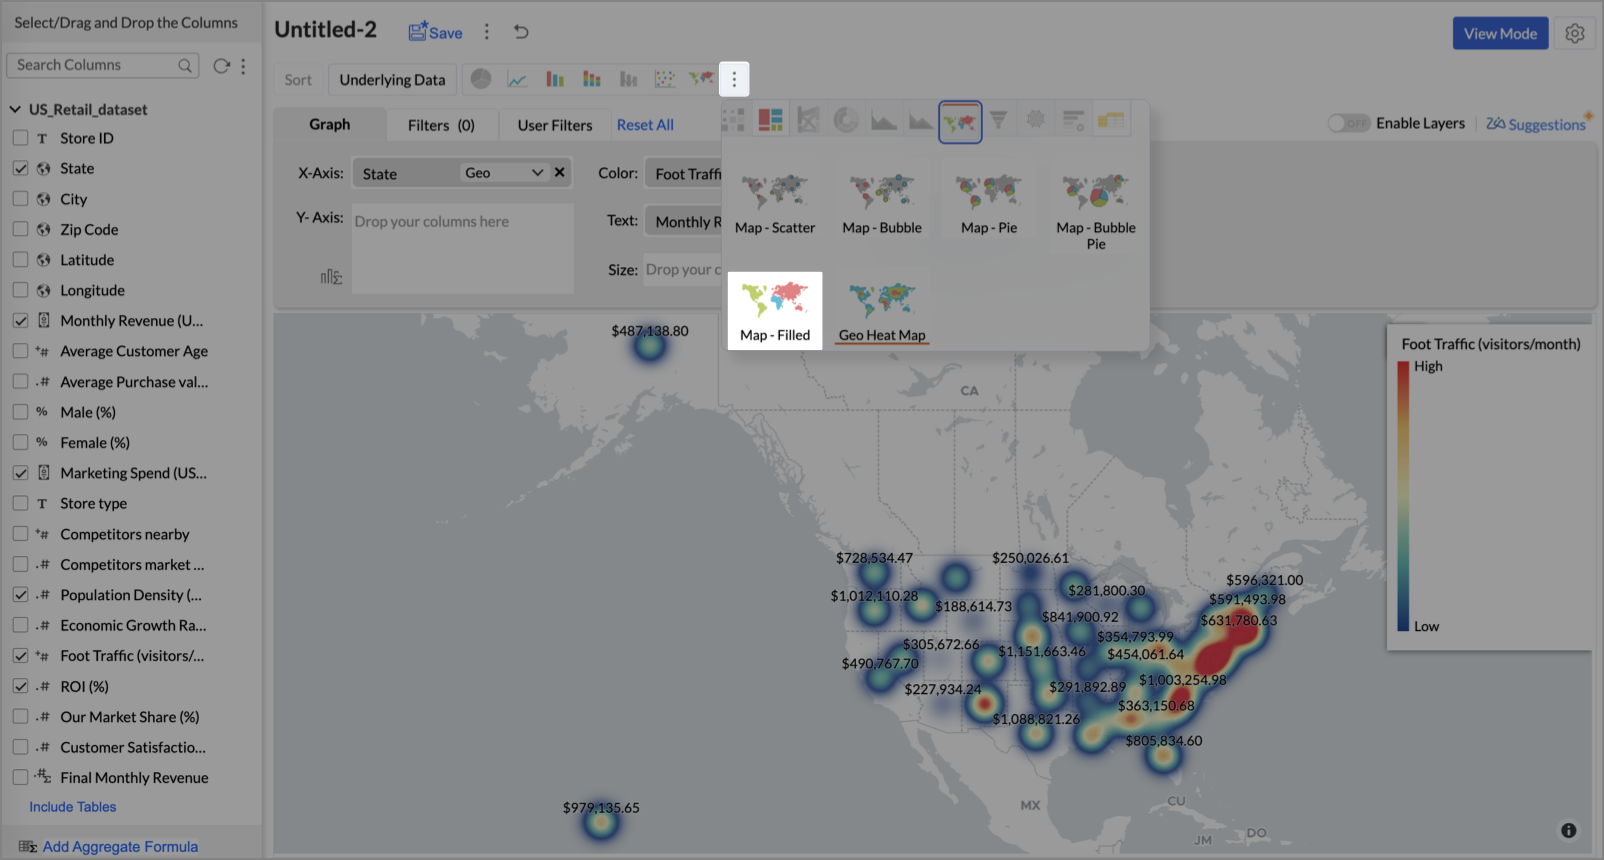
- Click on more option and select the chart type as Map-Filled.
- Click the Settings icon, then click Legend.
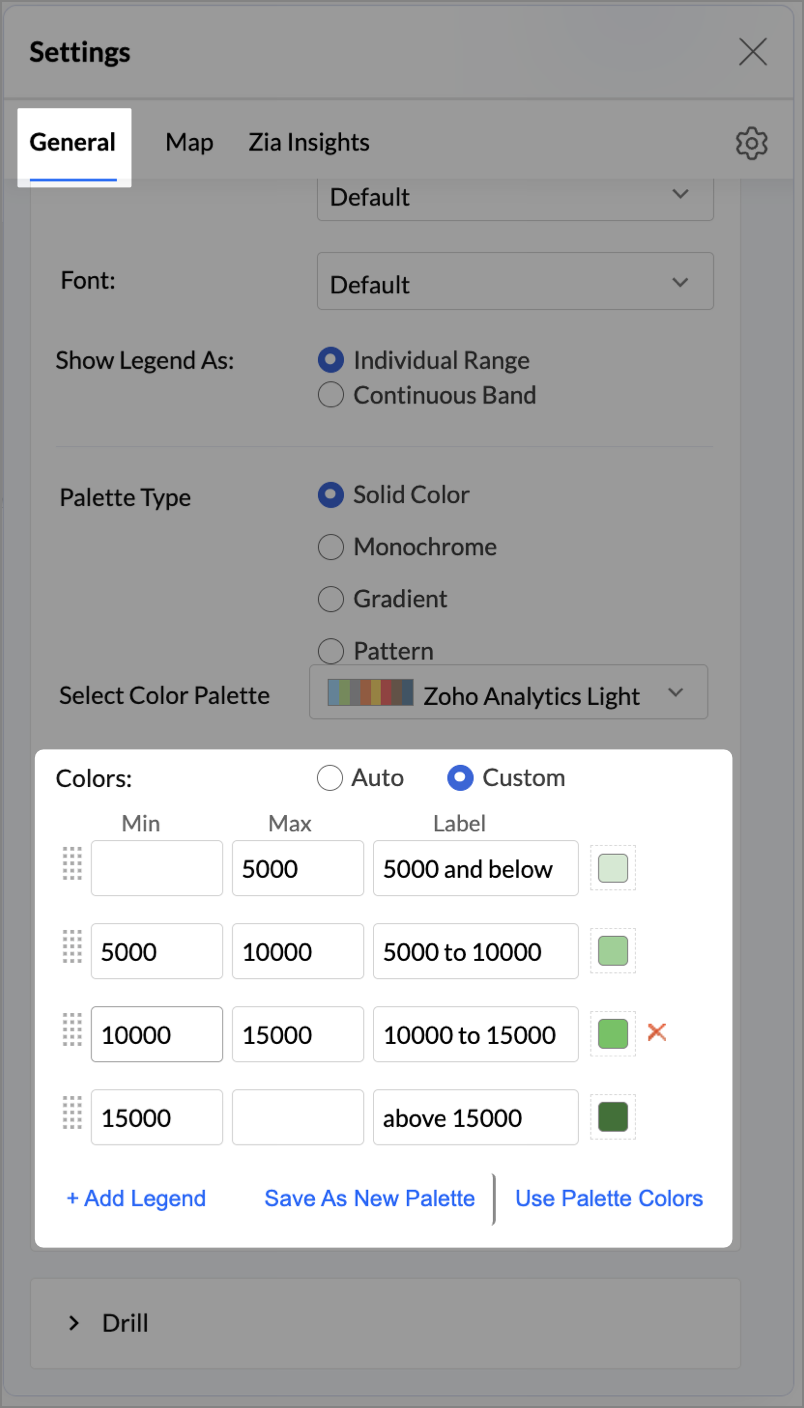
- In the Colors section, assign from light to dark green colors for the below range of foot traffic:
- Below 5,000
- 5,000–10,000
- 10,000–15,000
- Above 15,000
- Under the Map tab, change the map to Albers USA Projection.
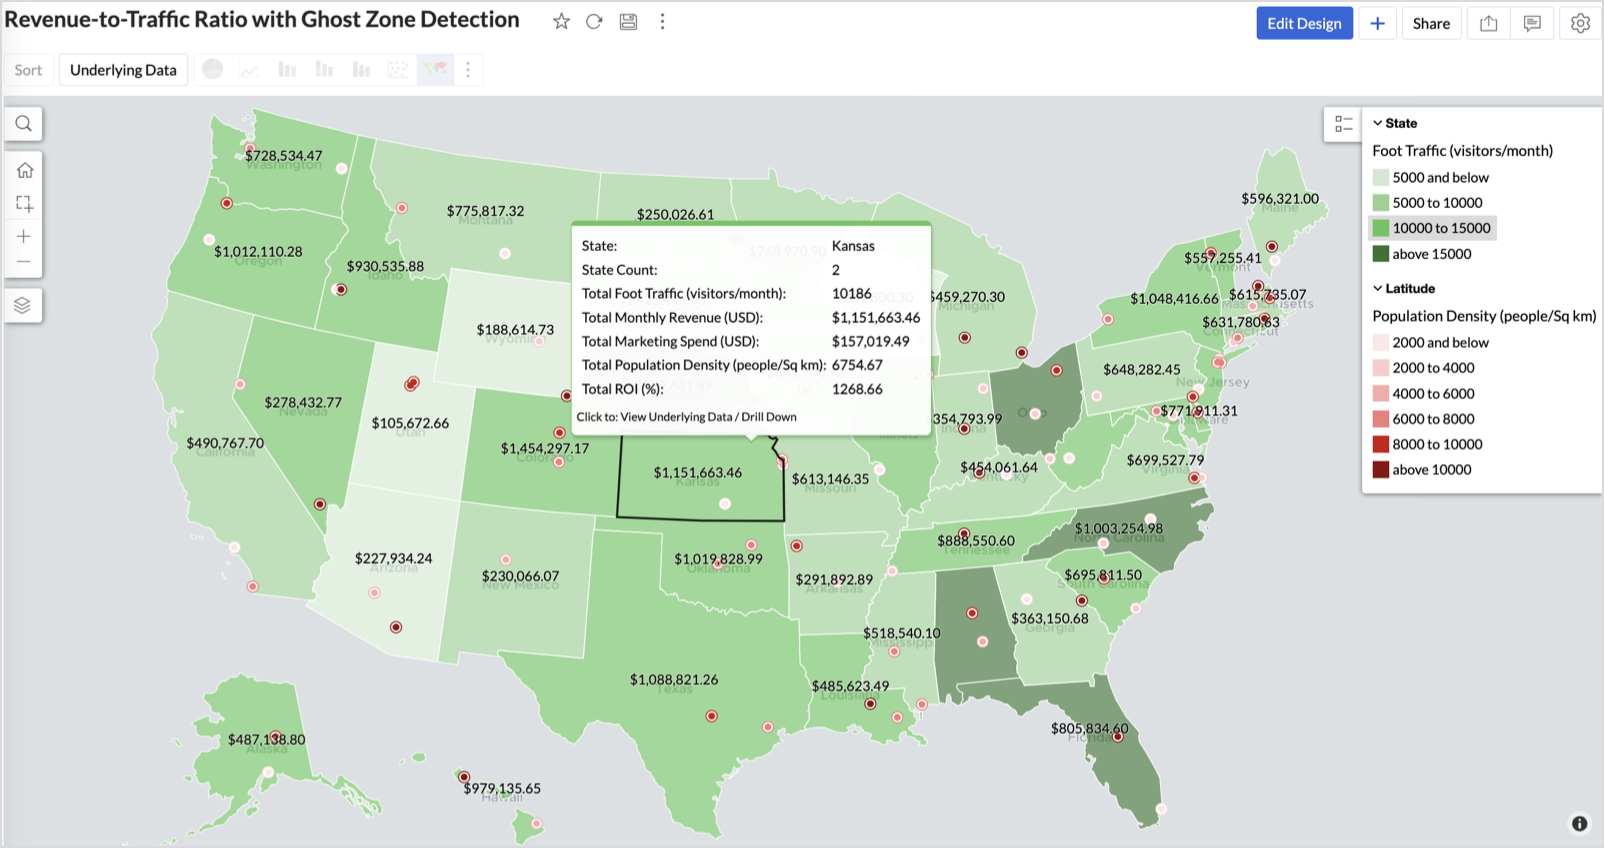
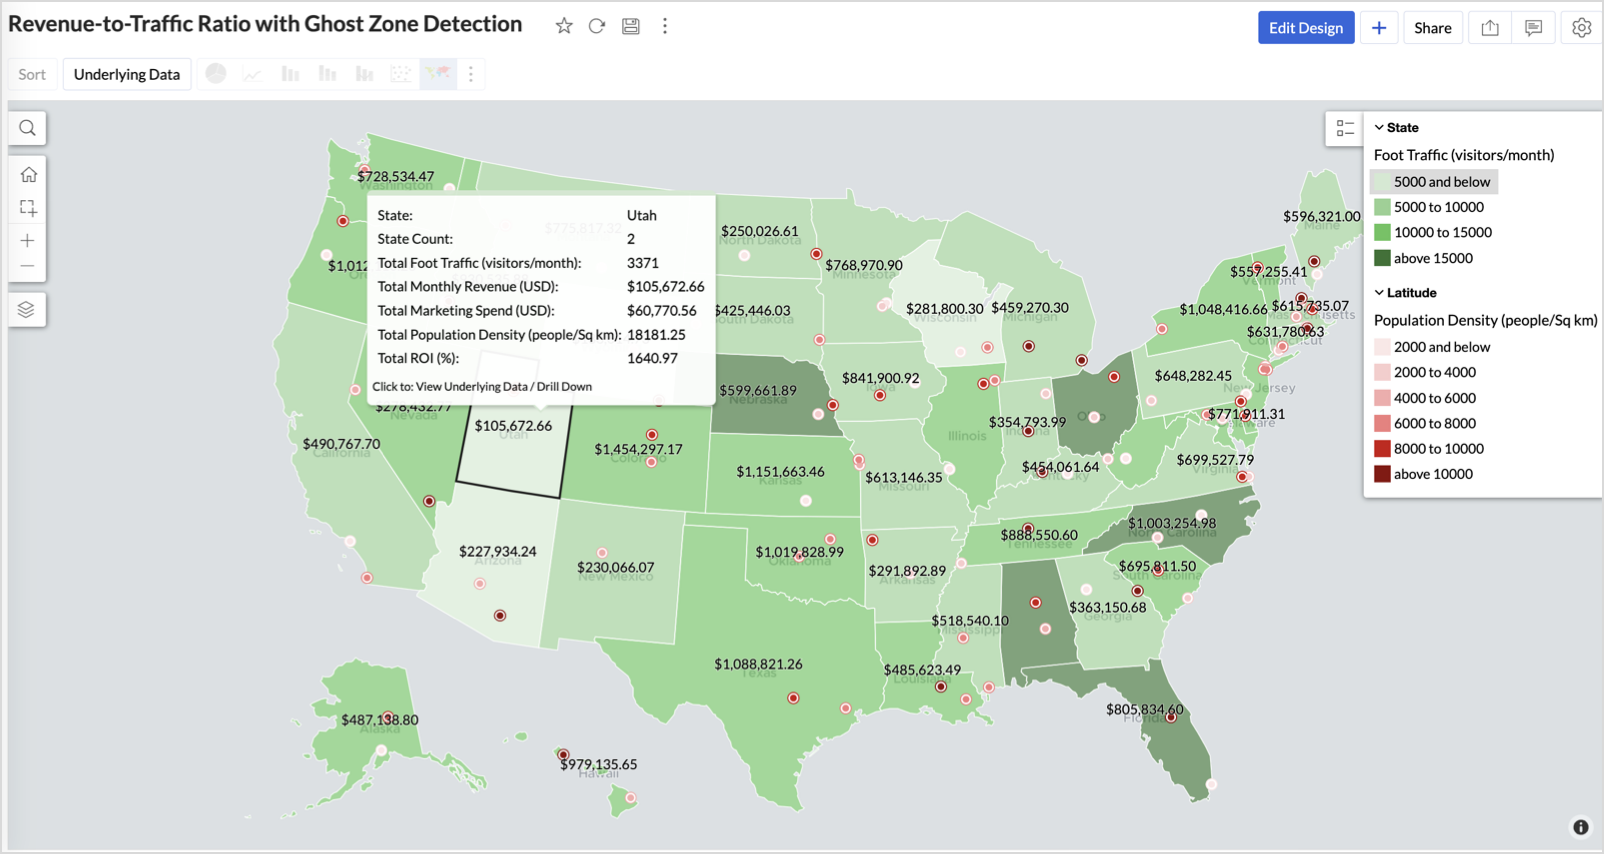
This filled layer highlights traffic and revenue across states.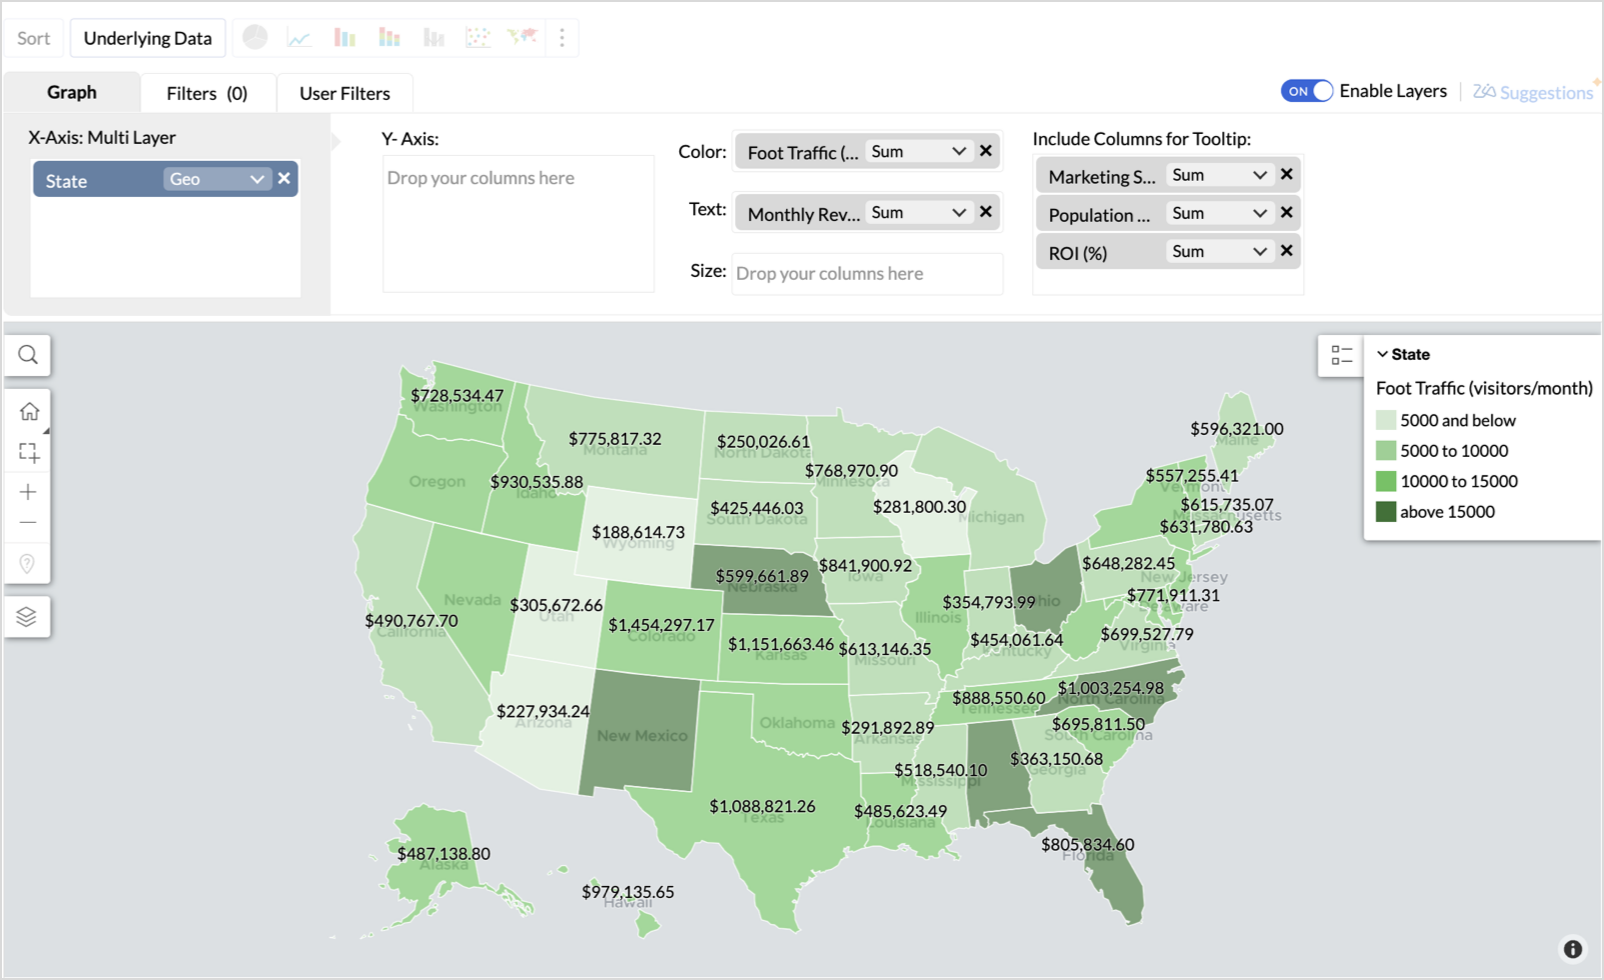
- Toggle Enable Layers to add a second layer.

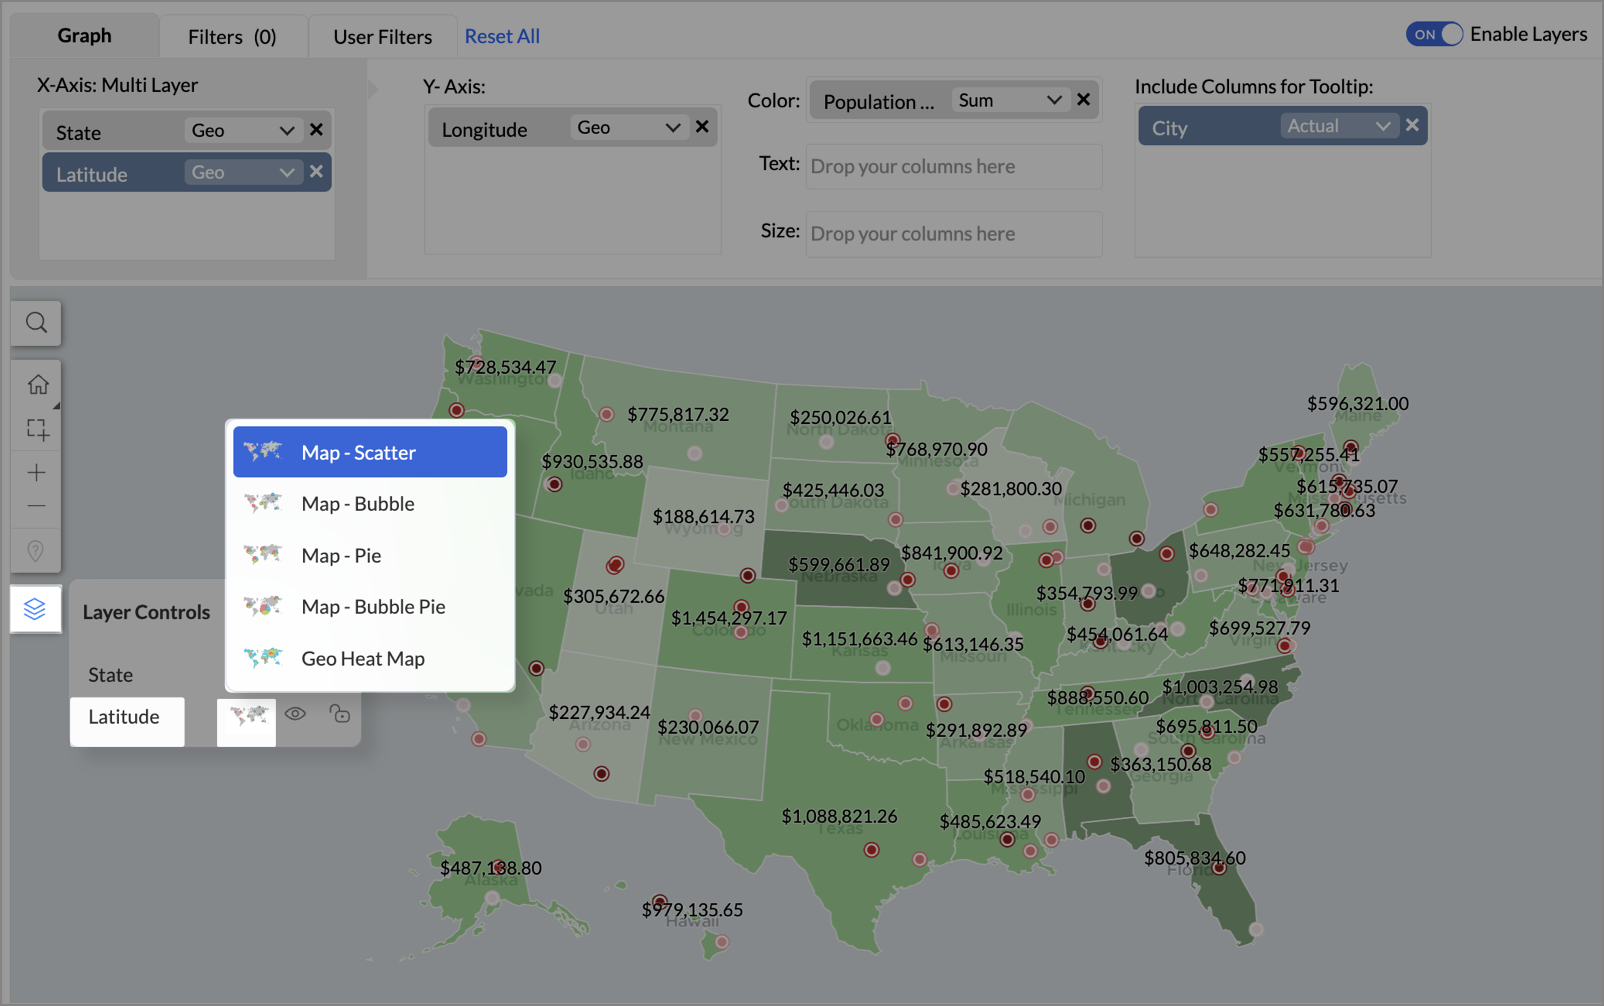
- In the new layer, drag and drop Latitude and Longitude into the X-Axis and Y-Axis respectively, Population density into the Color shelf, and click Generate Graph.

- Click Layer Controls, select Chart Chooser besides Latitude and choose the map as Map - Scatter from the list.
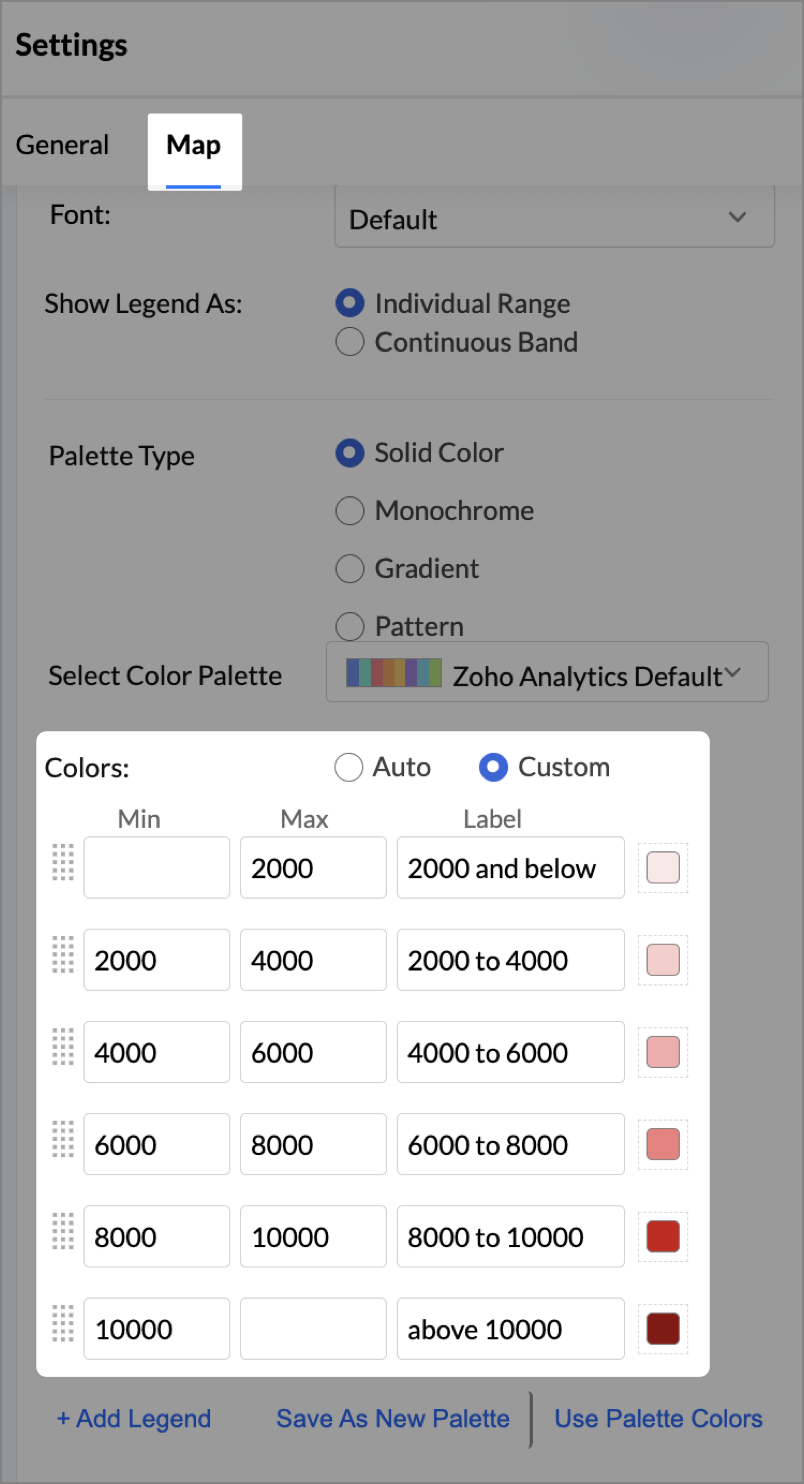
- To customize the second layer, go to Settings → Map → Latitude → Legend, and assign from light to dark red colors for the below range of population density:
- Below 2,000
- 2,000-4,000
- 4,000-6,000
- 6,000-8,000
- 8,000-10000
- Above 10,000
- Rename the report as Revenue-to-Traffic Ratio with Ghost Zone Detection and click Save.
This scatter layer marks the exact store locations, allowing visual correlation with high-traffic regions, revenue, and population density.

Key Insights
Dark green filled (high traffic) + Low revenue - Poor conversion - evaluate strategy or in-store experience
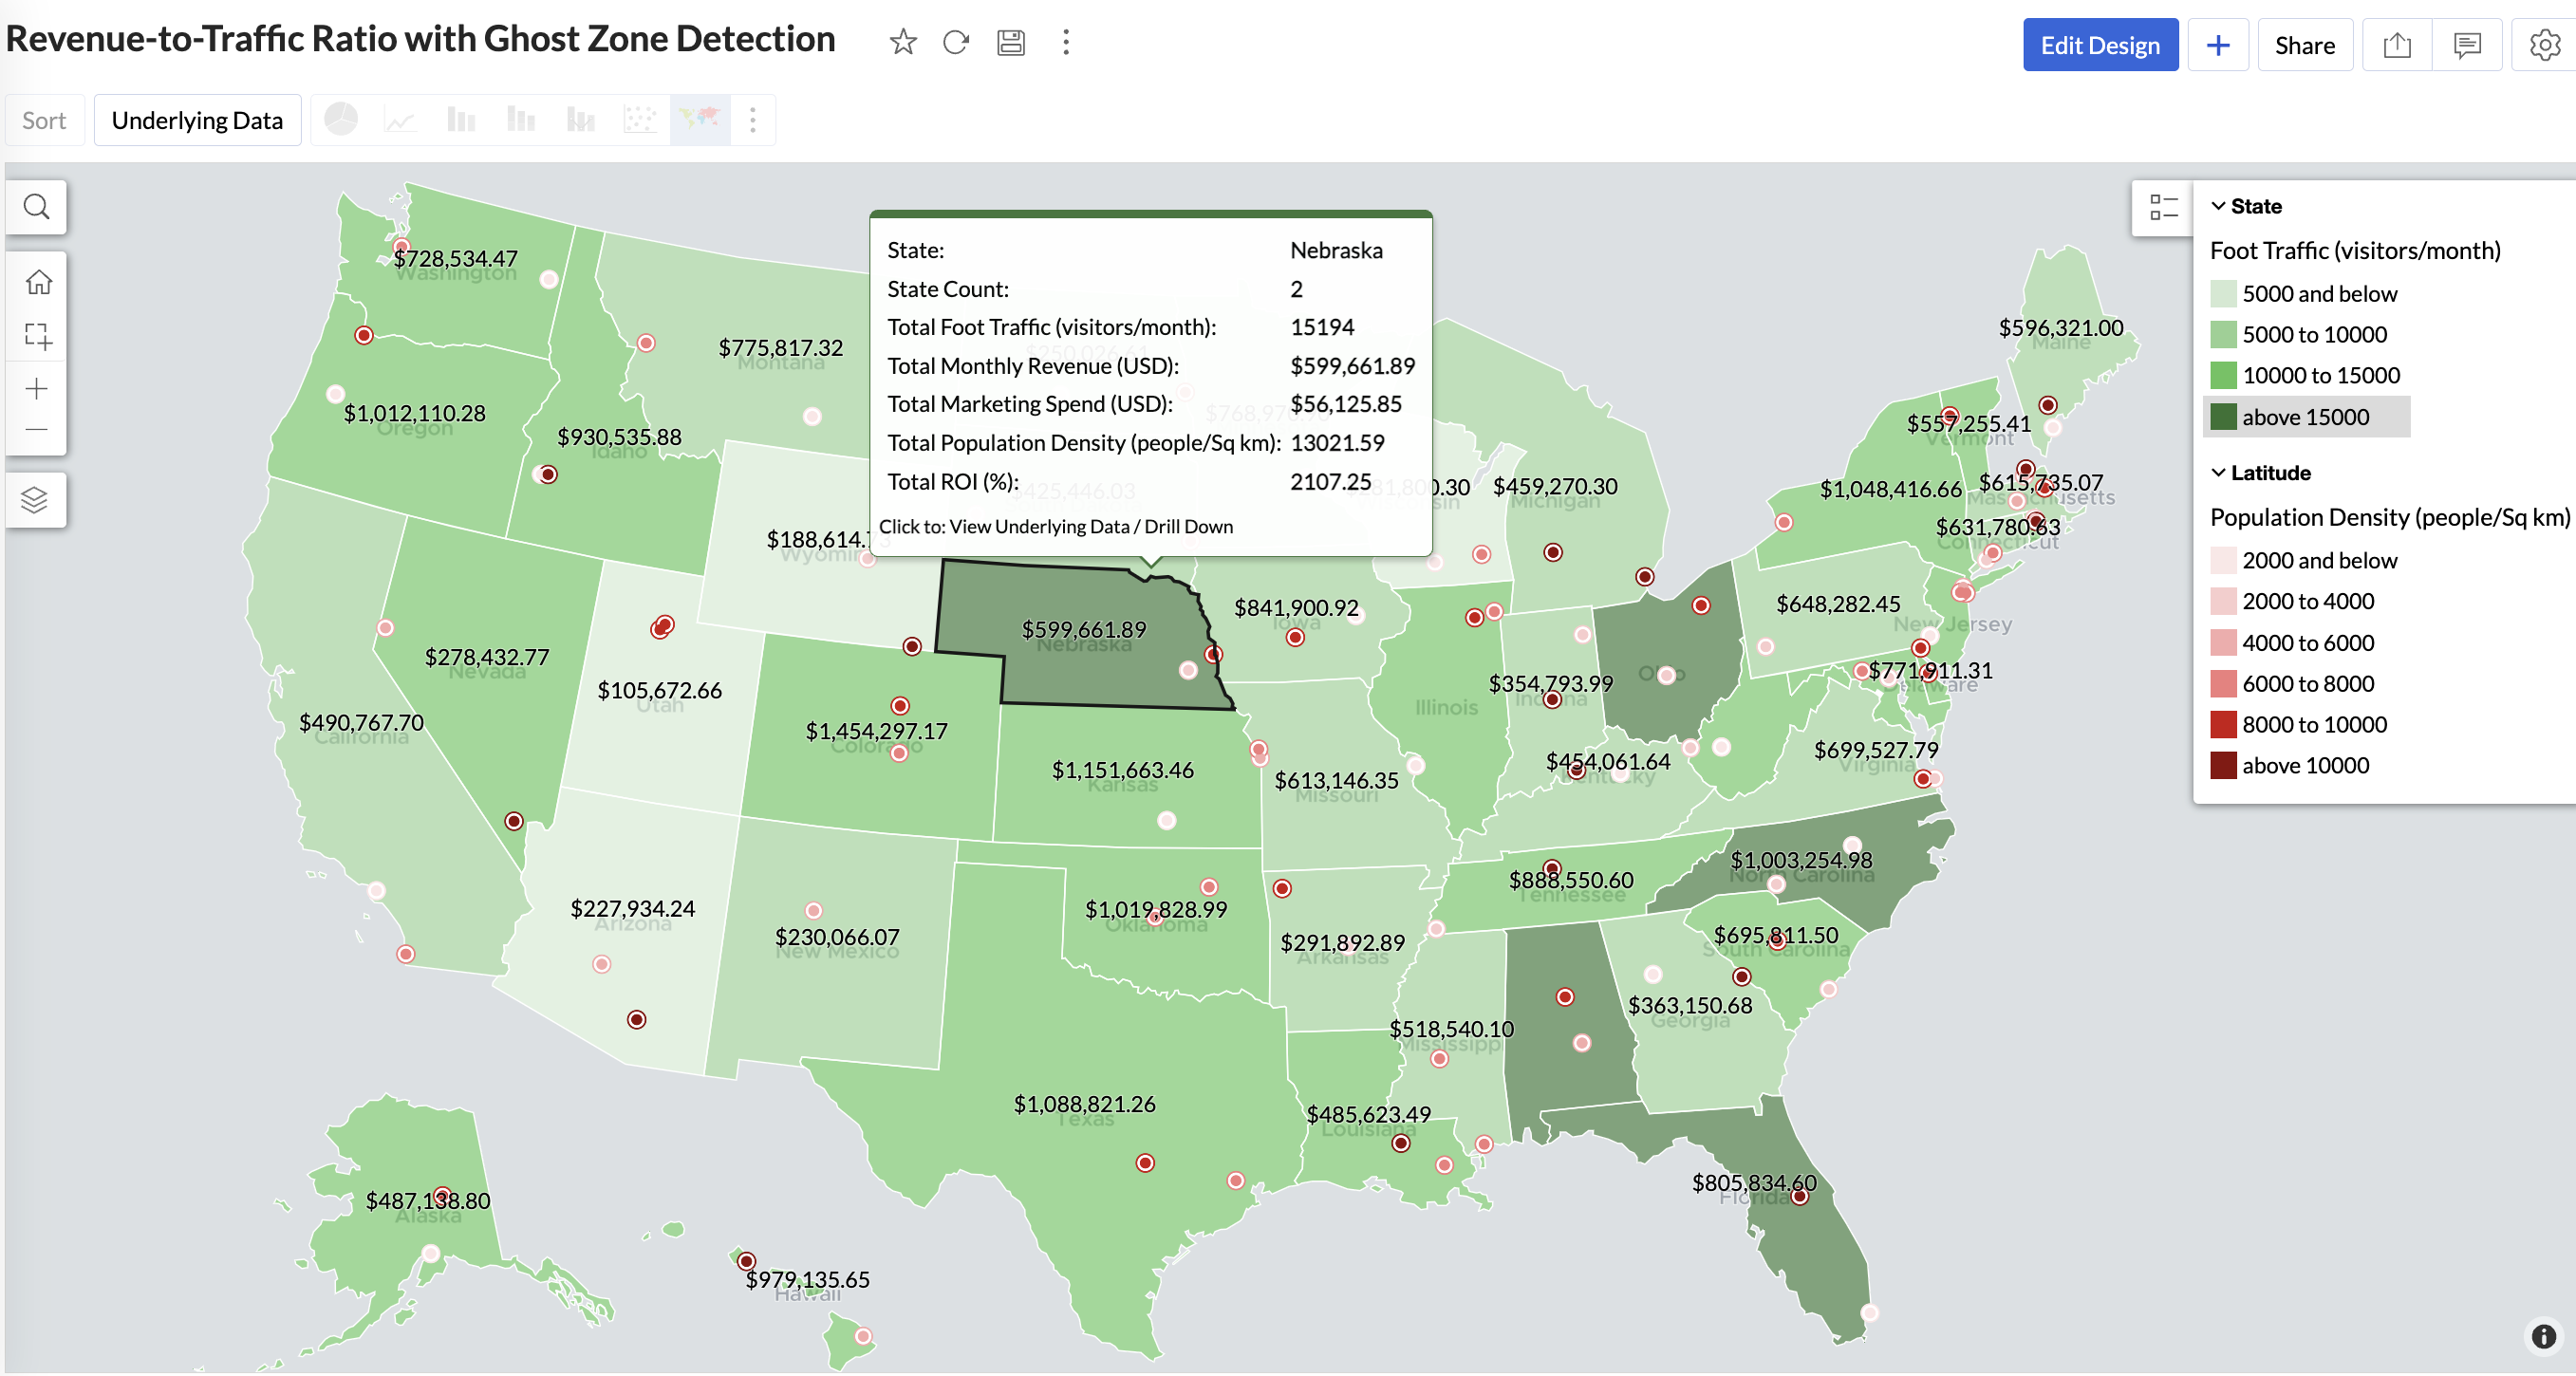

Mid to Dark green filled (high to mid traffic) + balanced revenue - Efficient zones — consider scaling efforts

Light green filled (low traffic) + high marketing spend (from tooltip) - Budget drain — reduce spend or re-evaluate targeting

Dark red marker (high population density) + less to no store markers - Ghost Zones — high opportunity areas for expansion
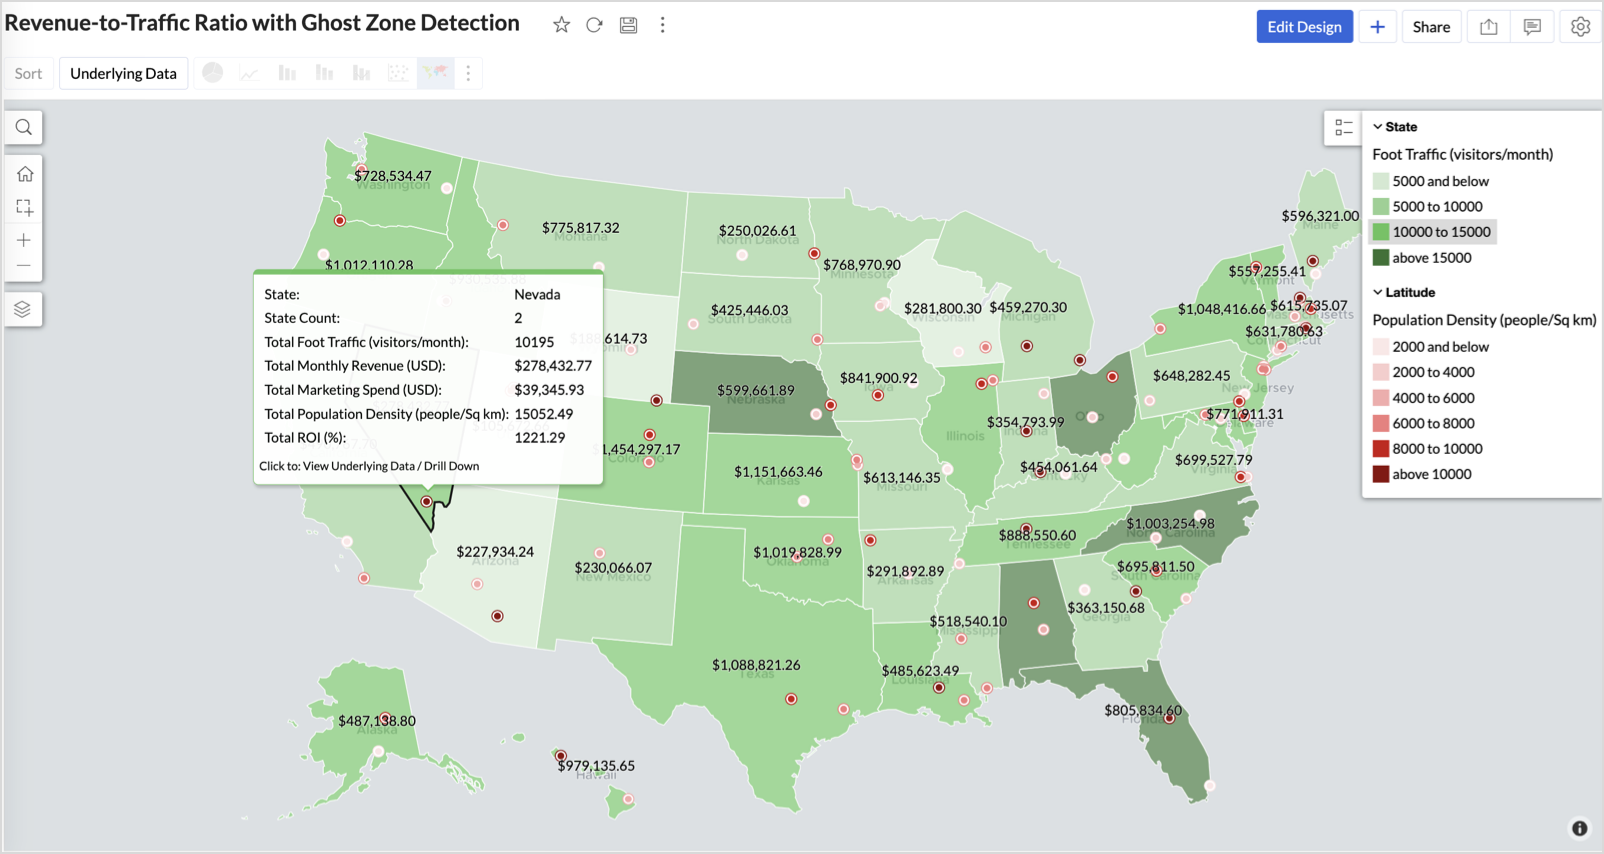

Example: In Las Vegas from Nevada, with a population density of 10,428 people/sq km and only two stores handling 10K–15K visitors/month, monthly revenue of the state remains modest at ~$278K. This indicates a high-opportunity zone for expansion, with strong footfall but untapped revenue potential.
Interpretation & Use
This map is designed for marketing and expansion teams who need to:
- Justify where to open new stores
- Optimize existing resource allocation
It visually answers the question:
Are we generating revenue where people are actually showing up?
Also, with the scatter layer:
Where are we not present — but should be?
3. Competitor Pressure Zones (Map – Scatter)
To evaluate how store performance is impacted by nearby competition, using a scatter map that plots every store across the U.S. and reflects competitor market share through color intensity.
This view helps:
- Detect locations under competitive stress
- Identify high-risk zones where your market share is at risk
- Correlate competitor presence with satisfaction and store performance
Why Map - Scatter?
Map - Scatter offers a clean and lightweight visual that plots each store based on its exact coordinates. By encoding competitor market share as color and overlaying other attributes via tooltip, this chart becomes a competitive pressure radar.
Procedure
- From the dataset, click the Create icon and select Chart View.
- In the chart designer, drag and drop the following columns into their respective shelves:
- Latitude → X-Axis
- Longitude → Y-Axis
- Competitors market share → Color
- Competitors nearby, Monthly Revenue, and Store Type → Tooltip
- Click Generate Graph.

- Click on the more option and select the chart type as Map-Scatter.
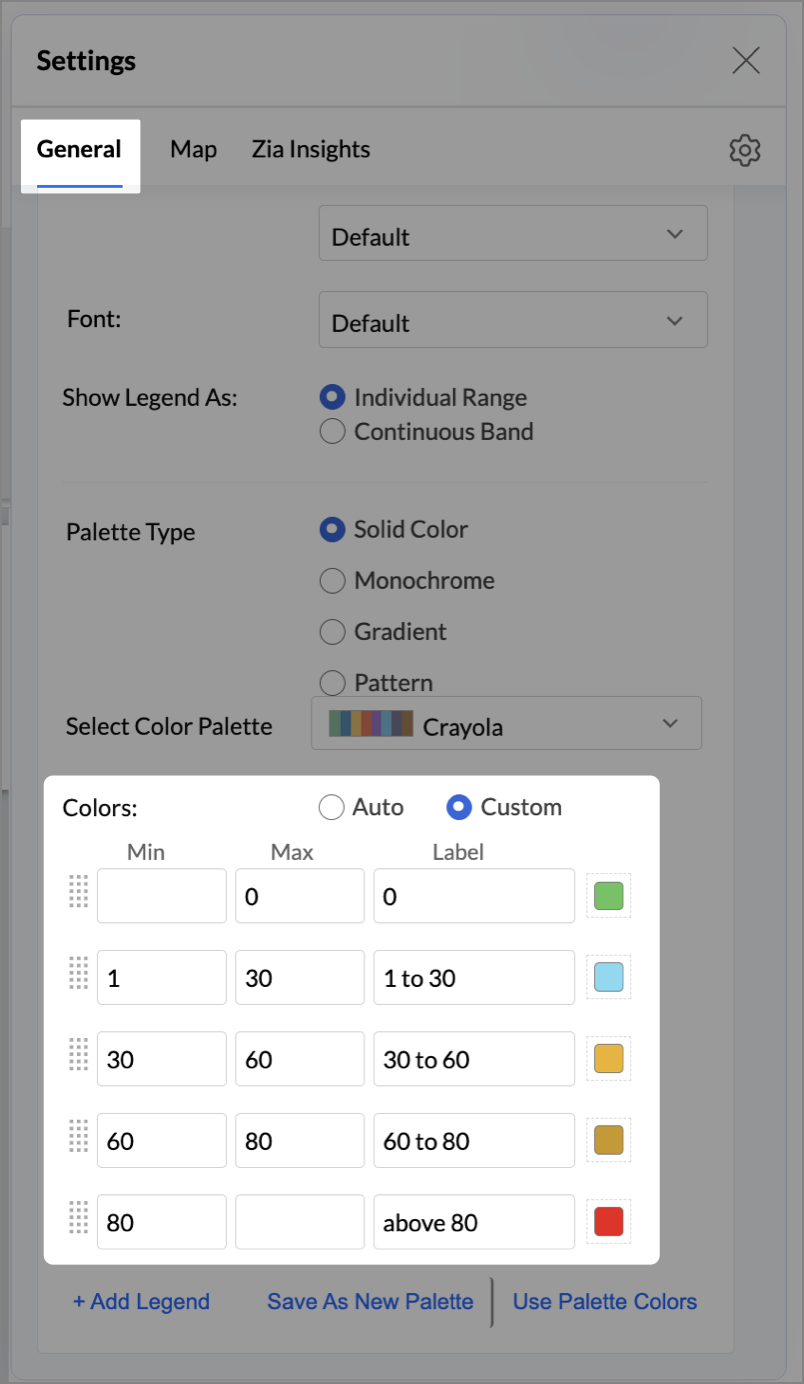
- In the Settings panel, adjust the color gradient to reflect pressure levels
- 0 → Green
- 1-30 → Cyan
- 30-60 → Orange
- 60-80 → Pale red
- Above 80 → Red
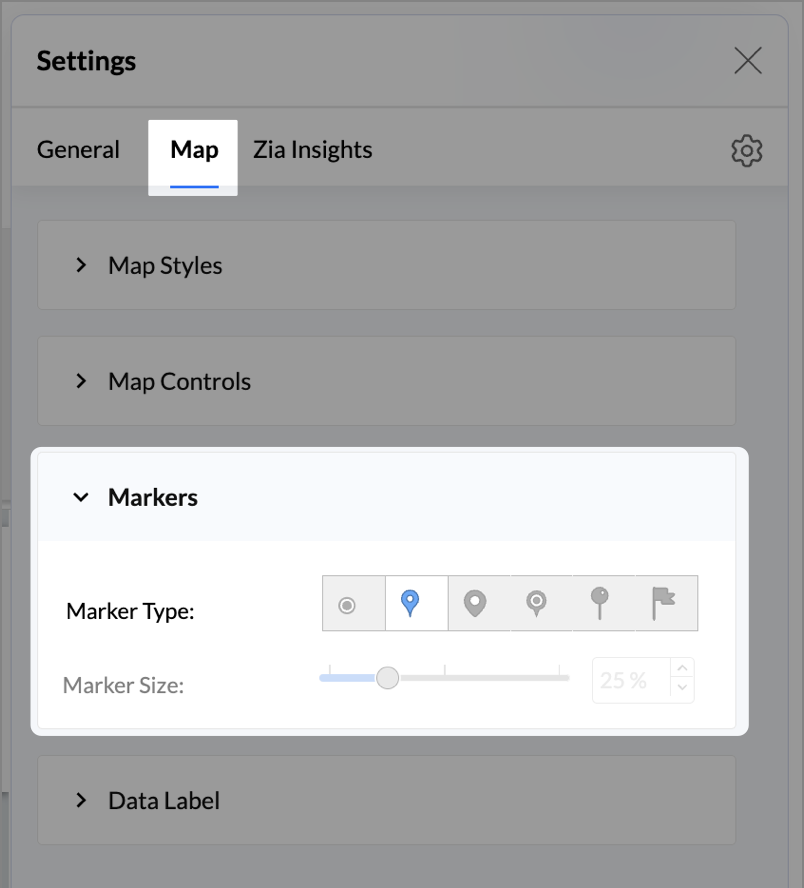
- Change the Marker type under Maps → Marker tab.
- Under the Map tab, change the map to Albers USA Projection.
- Rename the report as Competitor Pressure Zones and click Save.
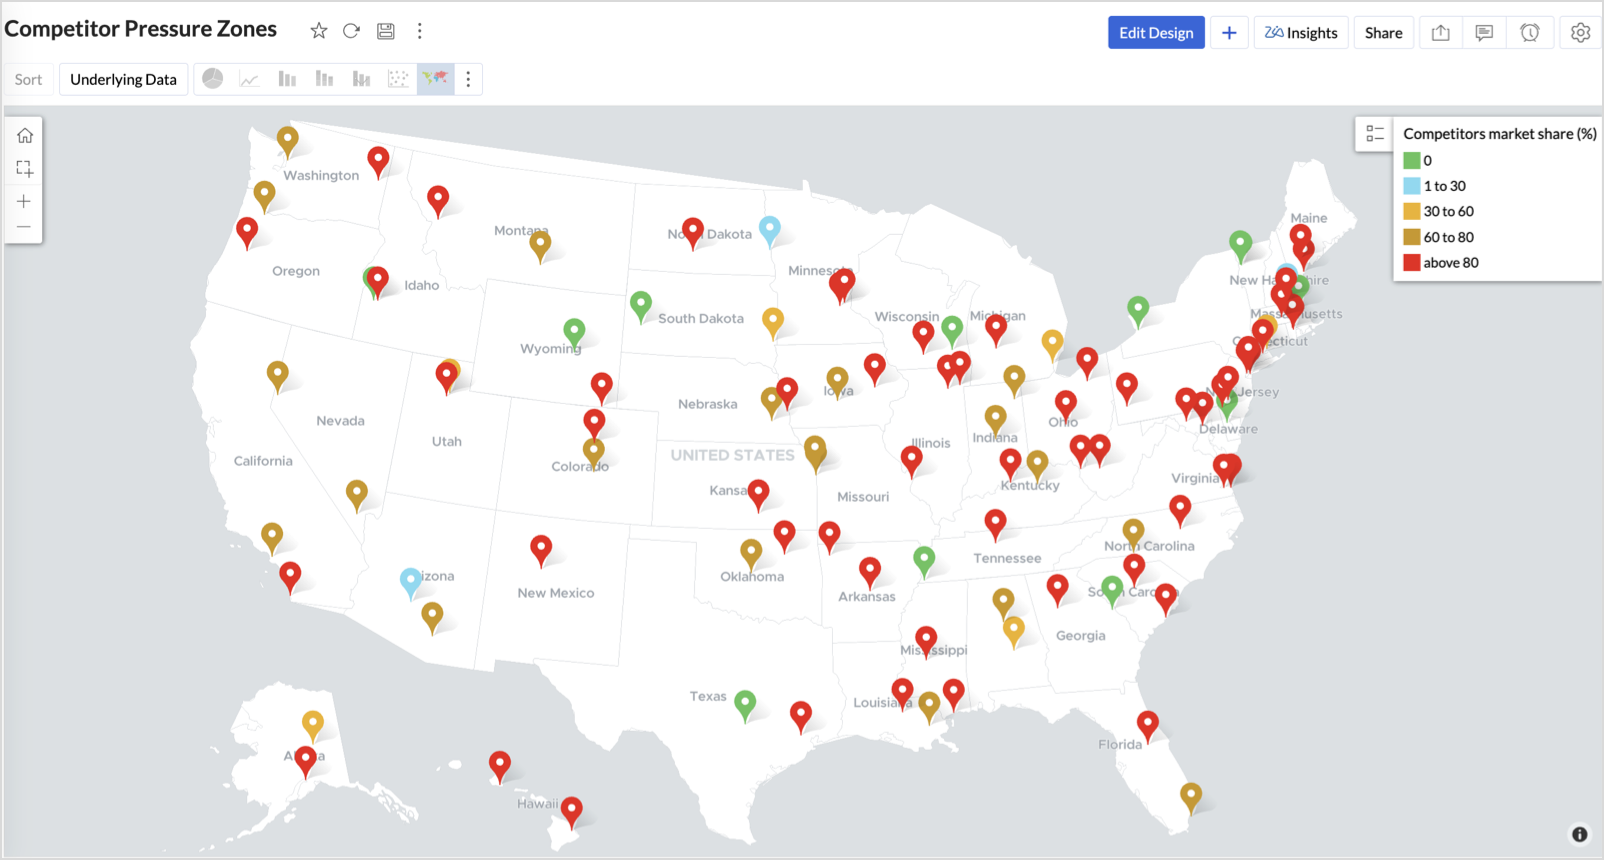
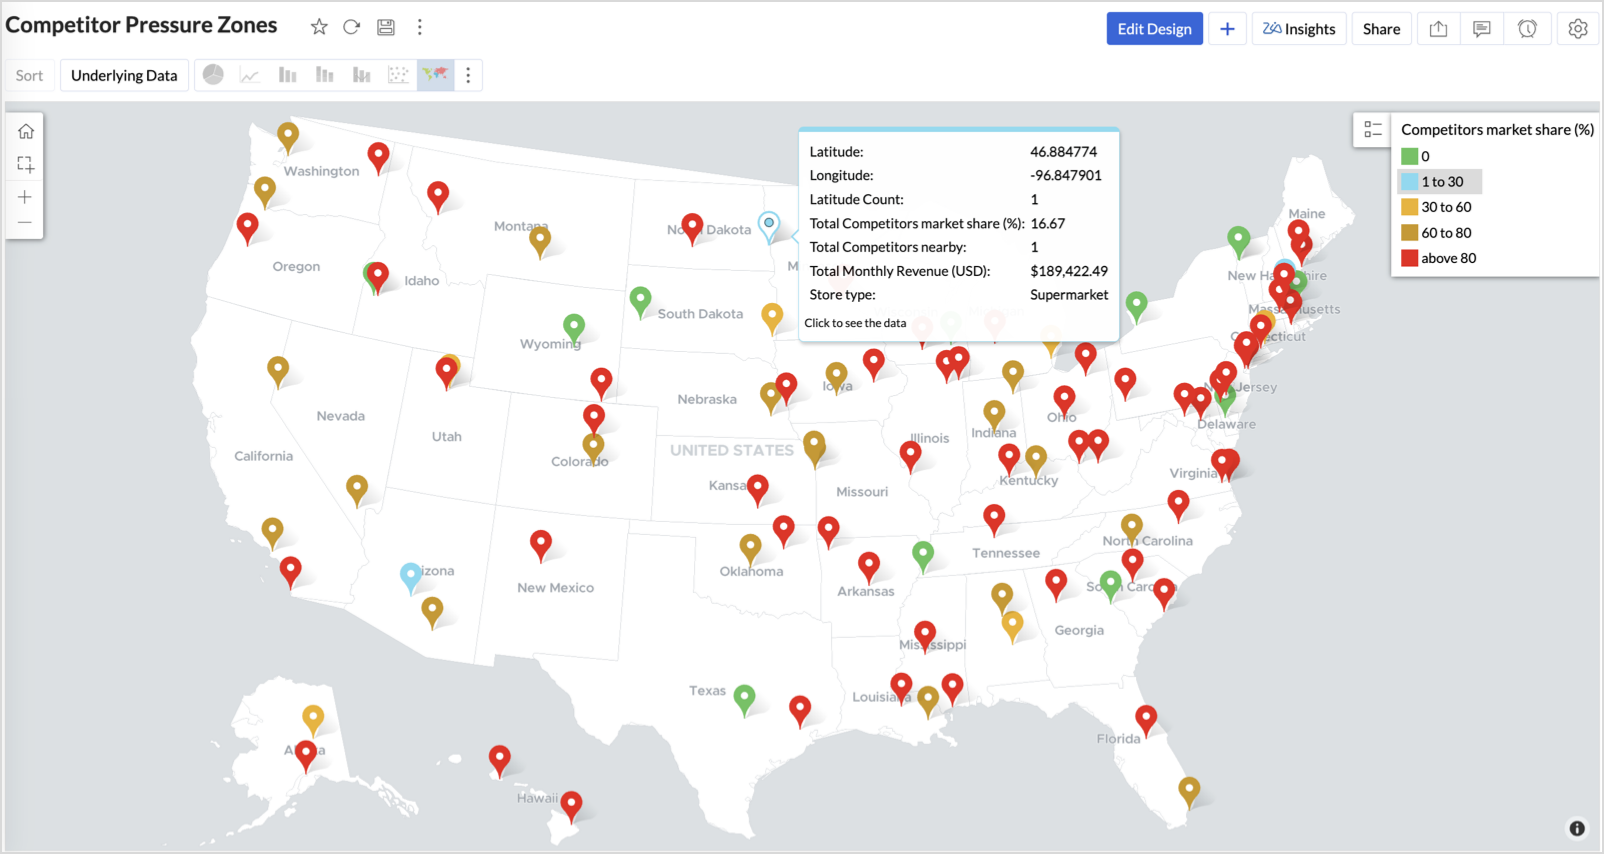
The resulting chart uses color to signal competitive heat around each store, allowing you to scan pressure zones across all regions visually.

Key Insights
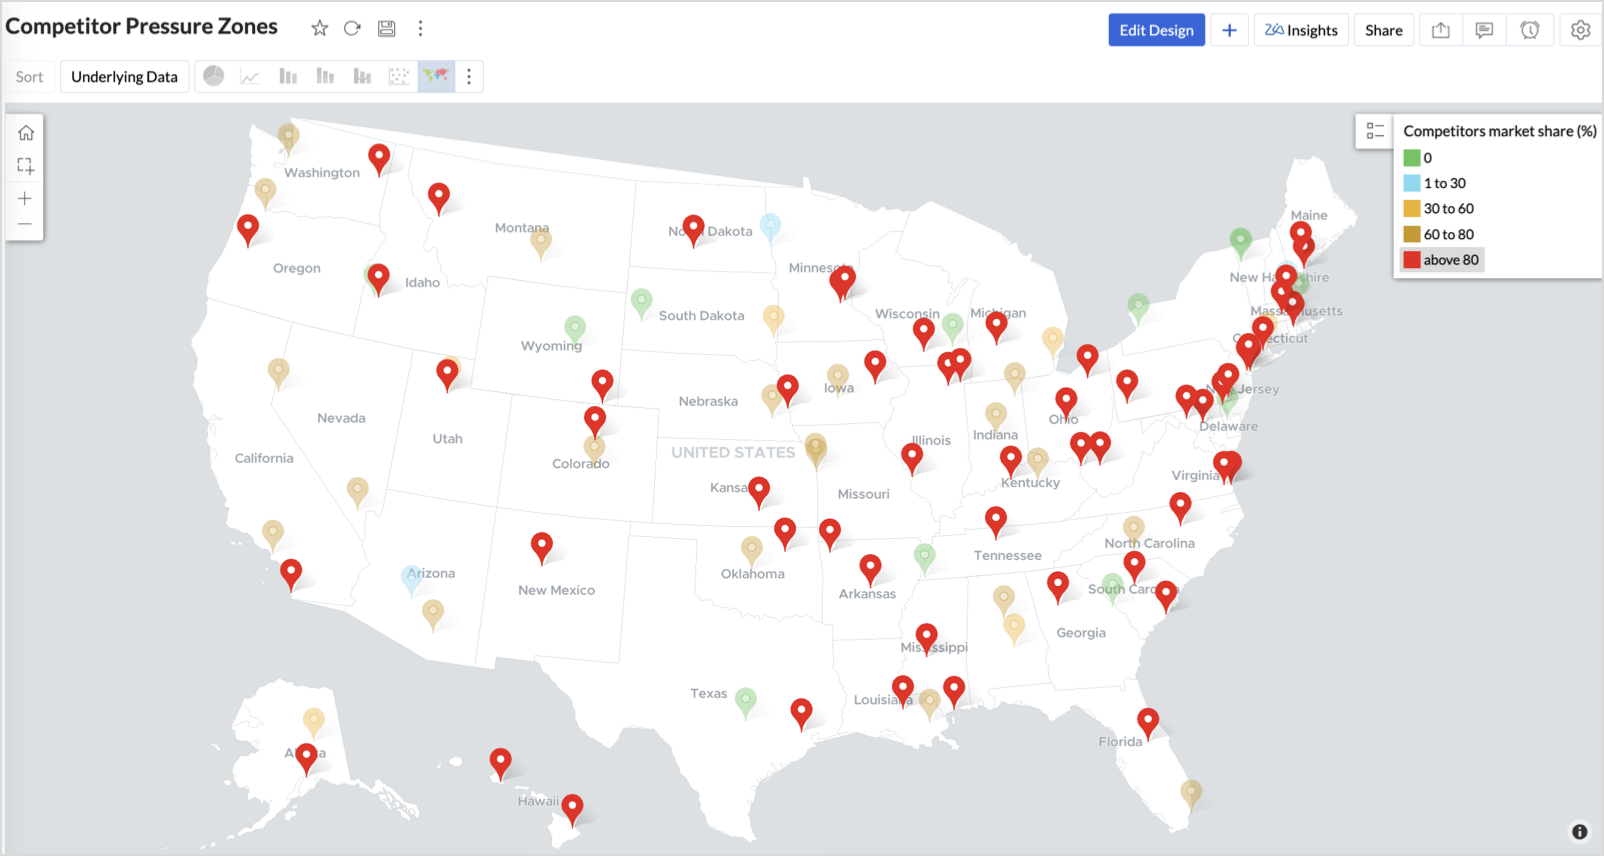
Red (80-100%) - High competitor dominance — urgent intervention zone

Orange (30-60%) + low revenue - Growing pressure — performance risk emerging
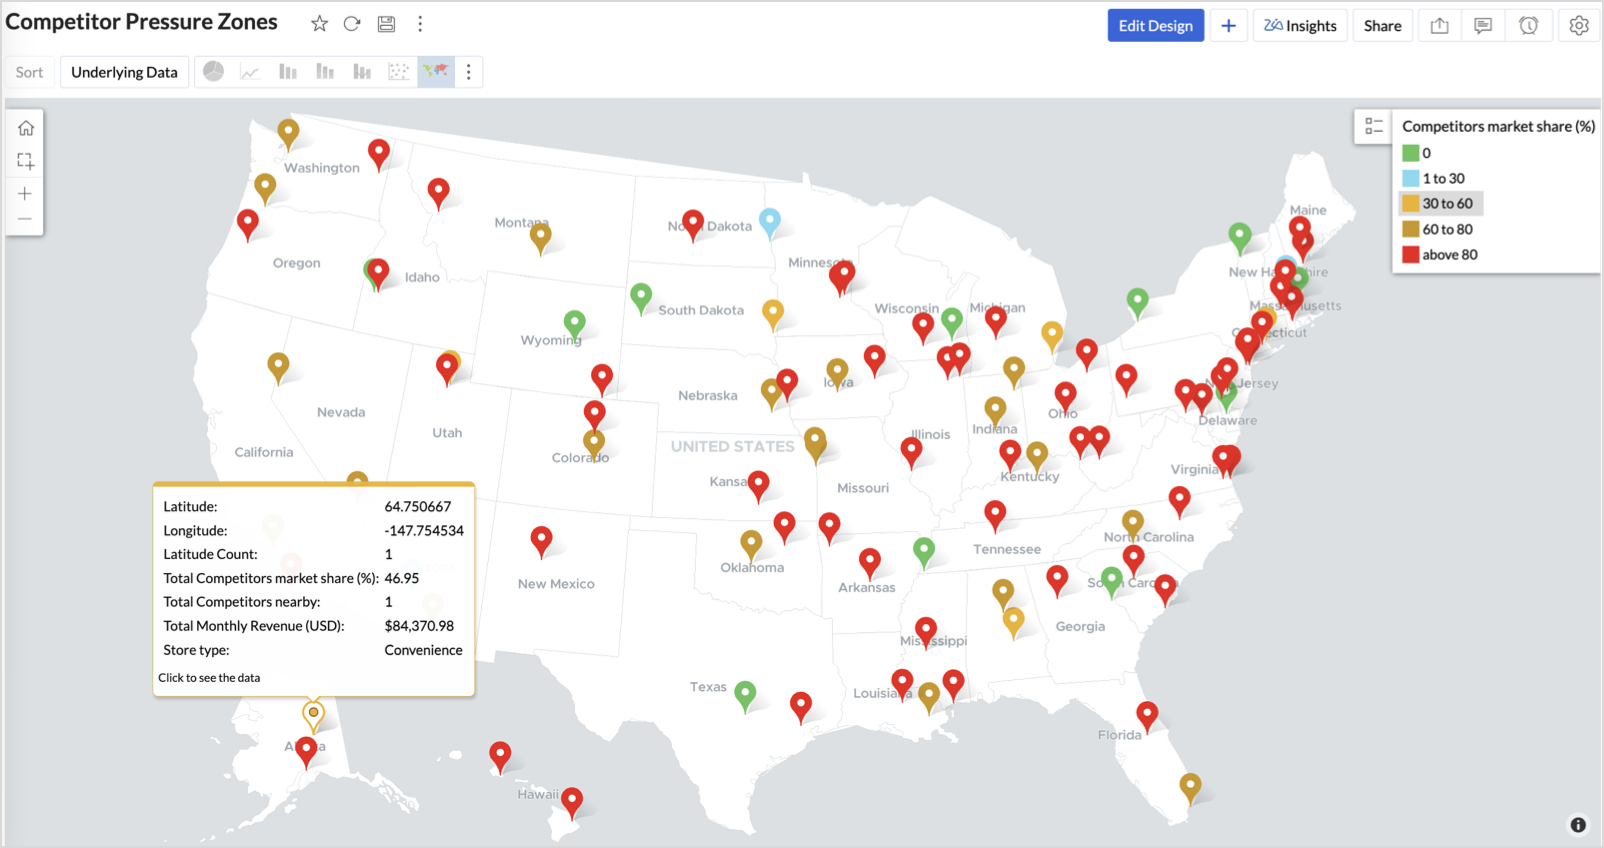

Green (0%) + strong revenue - Market leader — low competition, strong position
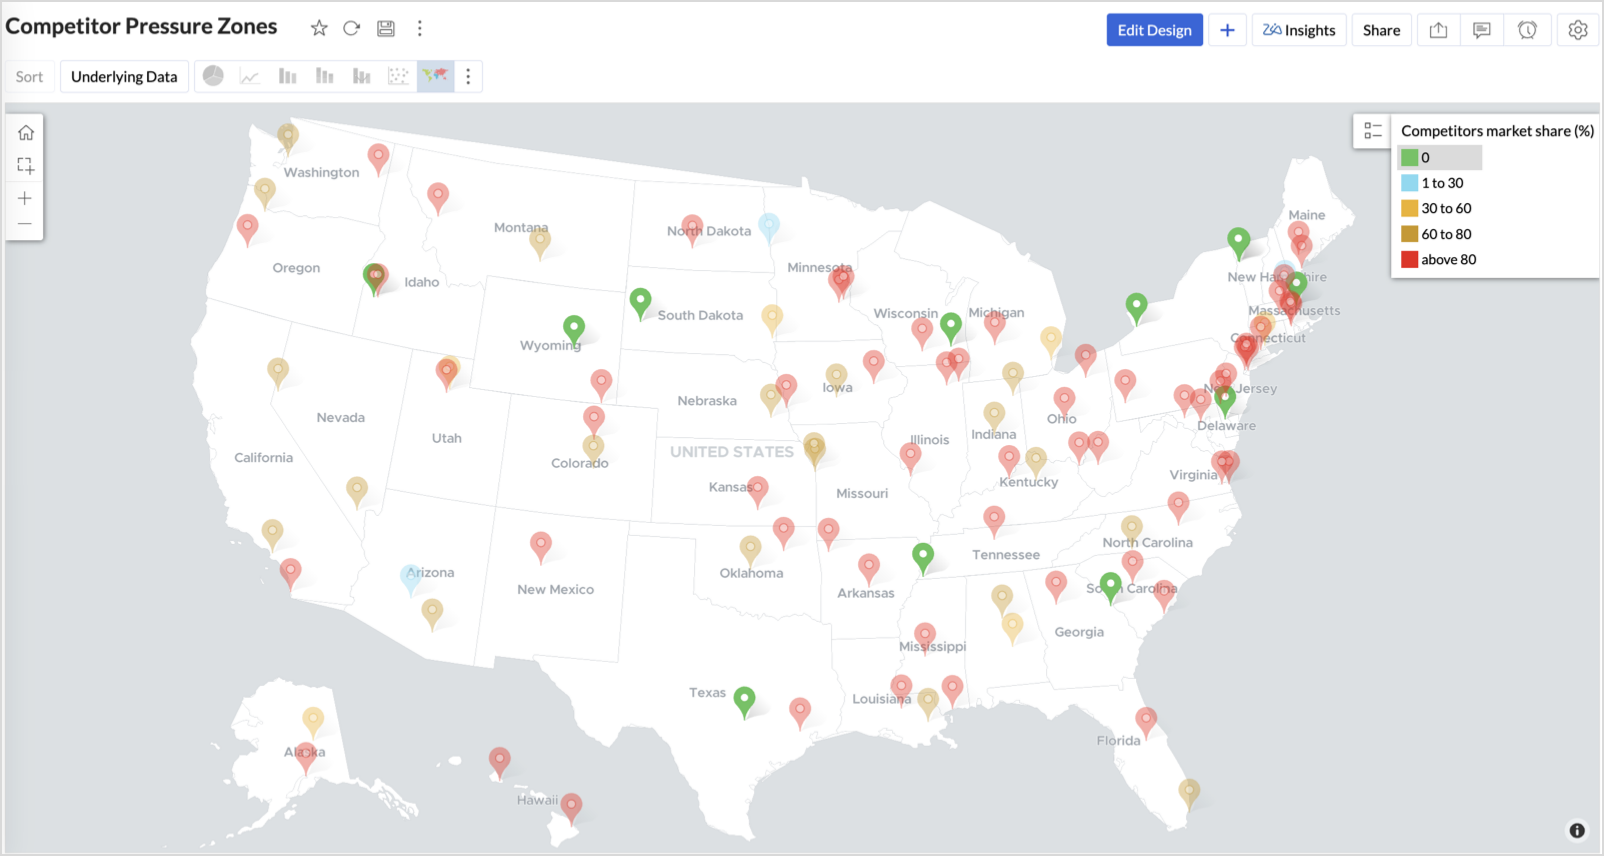

Cyan (1-30%) + moderate revenue - Mild competition — possible opportunity to scale further

Business Interpretation
This chart empowers regional and strategy teams to:
- Detect overcrowded areas where stores are losing share
- Identify safe zones where your brand leads the market
- Spot emerging competitor influence before it cuts into your margins
It acts as a competitive intelligence dashboard, mapping how your store network stands against external threats.
4. Customer Gender Distribution (Map - Pie)
To visualize how the gender distribution of customers varies across store locations. This helps identify stores with significant demographic skews, allowing for more personalized marketing, product selection, and in-store experience.
Why Map - Pie?
The Map - Pie chart is ideal for visualizing data composition across geographical locations.By breaking down each store’s customer base into Male (%) and Female (%) segments, this chart reveals who your customers are and where gender-targeted strategies might work best.
Procedure
- From the dataset, click the Create icon and select Chart View.
- In the chart designer, drag and drop the following columns into their respective shelves:
- Latitude → X-Axis
- Longitude, Male (%), Female (%) → Y-Axis
- City, Store ID, Average Customer Age, Store Type → Tooltip
- Click Generate Graph.

- In Settings, under the Map tab, change the map to Albers USA Projection.
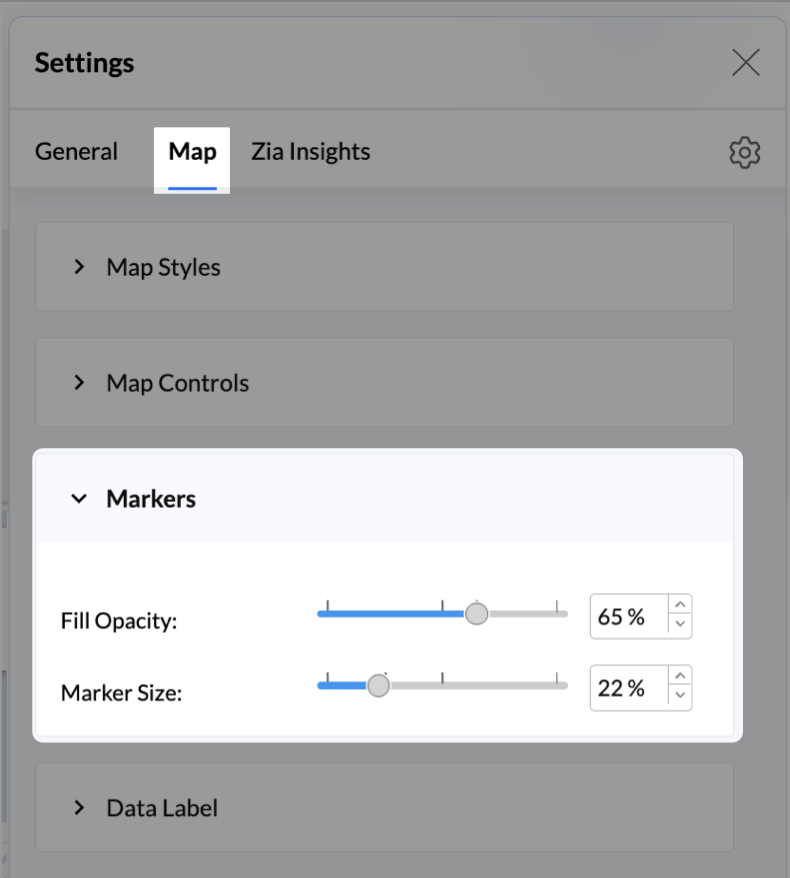
- Click on Markers, adjust the Marker Size as shown.
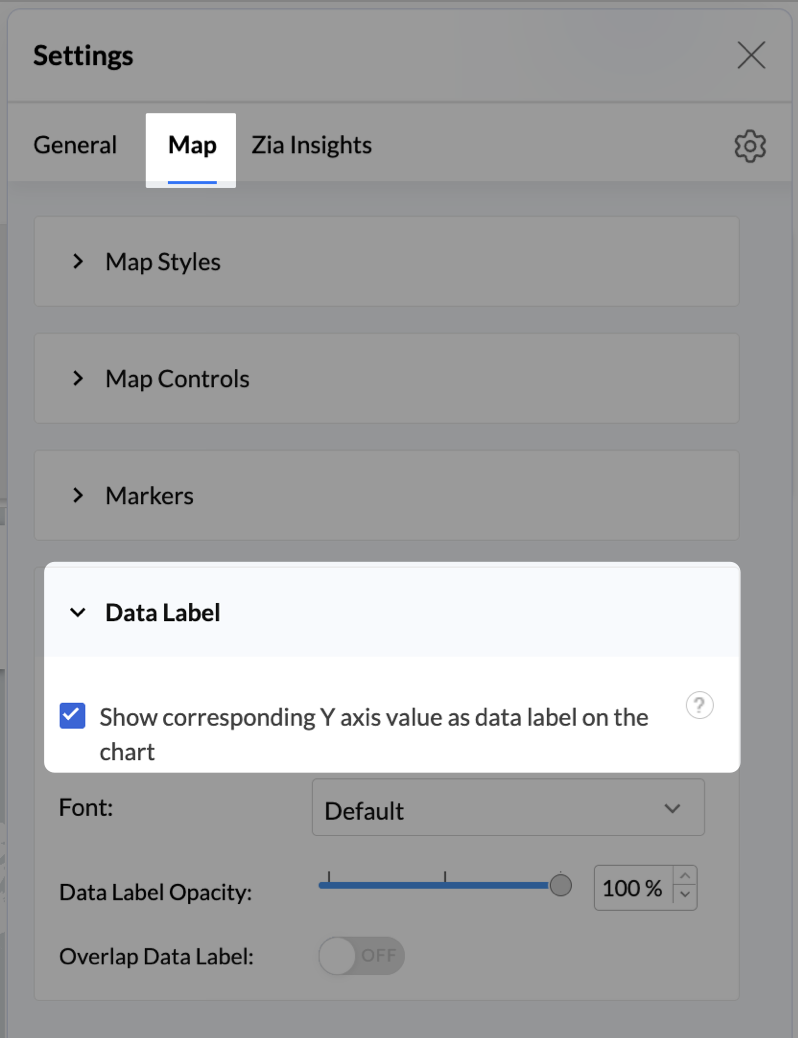
- Click on Data Label, and enable the Show corresponding Y axis value as data label on the chart to display the percentage values on the map.
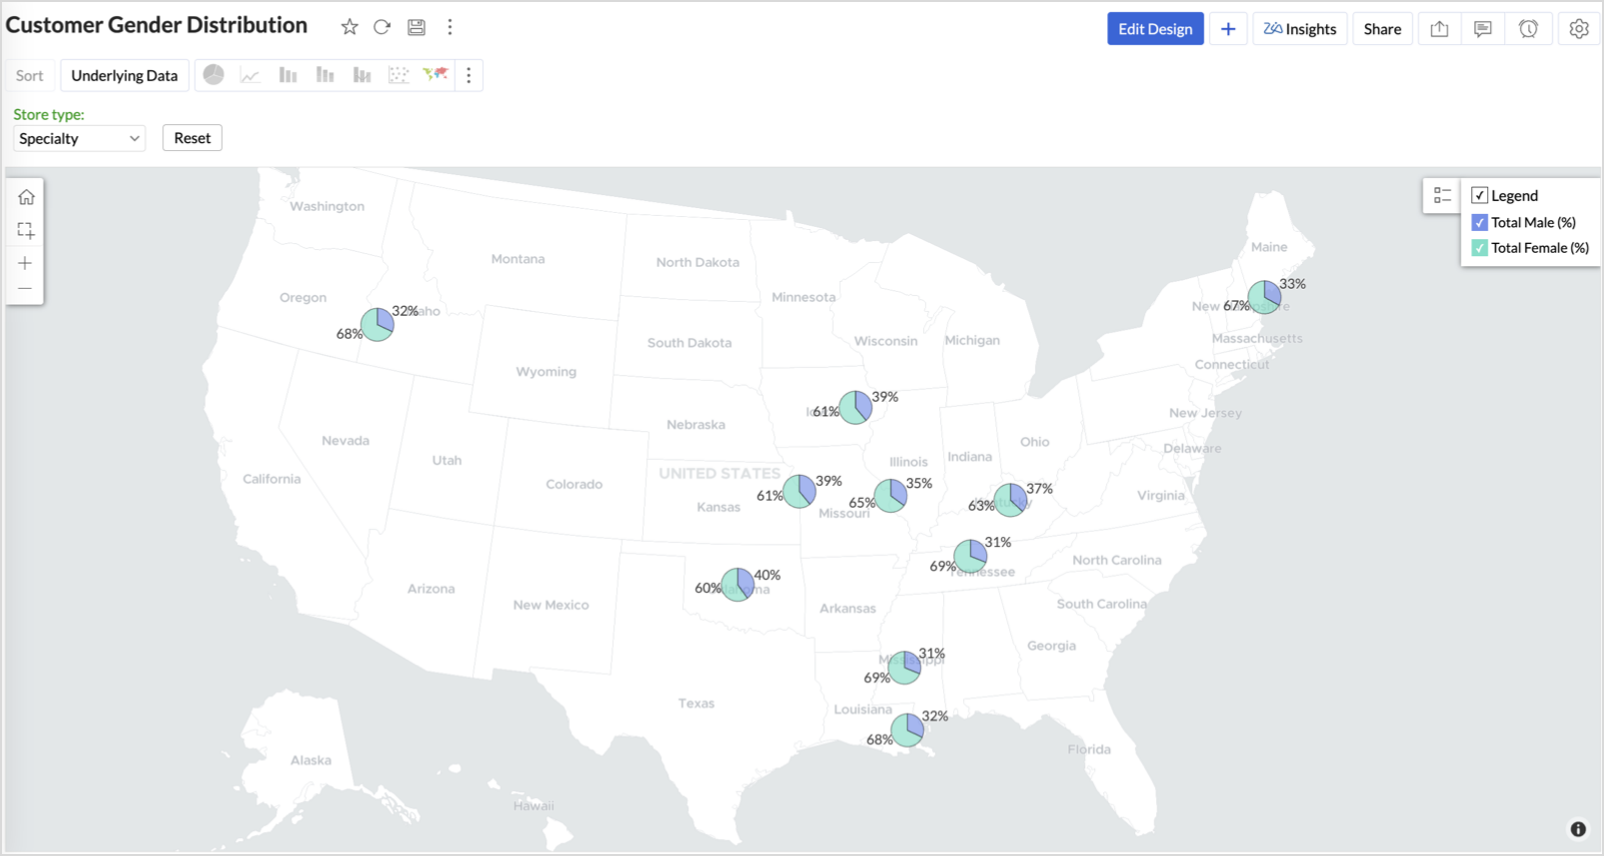
- Add Store Type as User Filters to slice down store-wise gender distribution.
- Rename the report as Customer Gender Distribution and click Save.
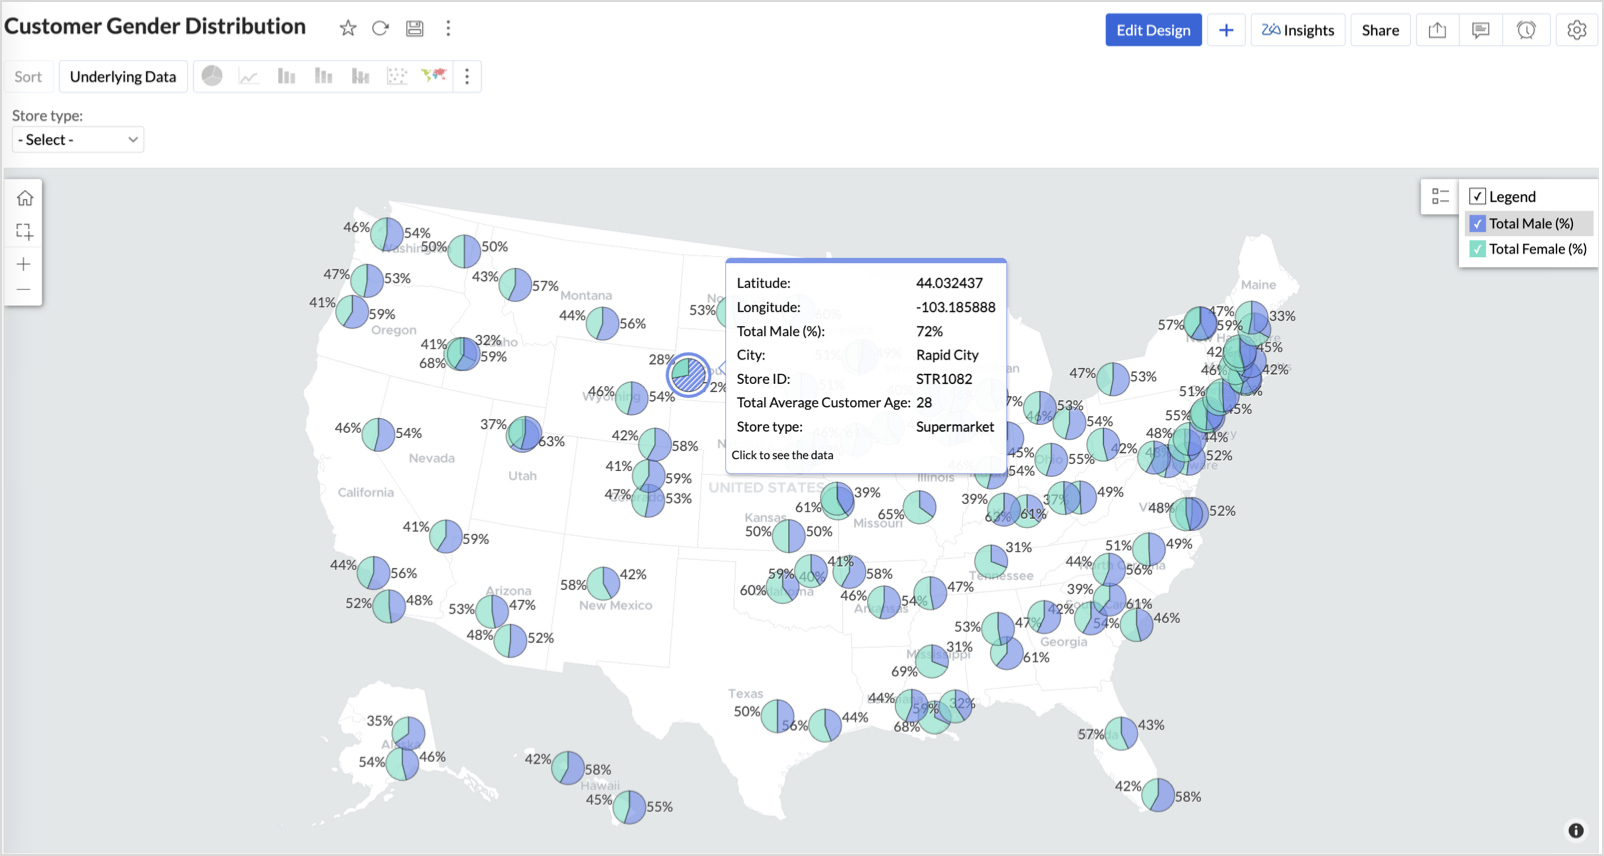
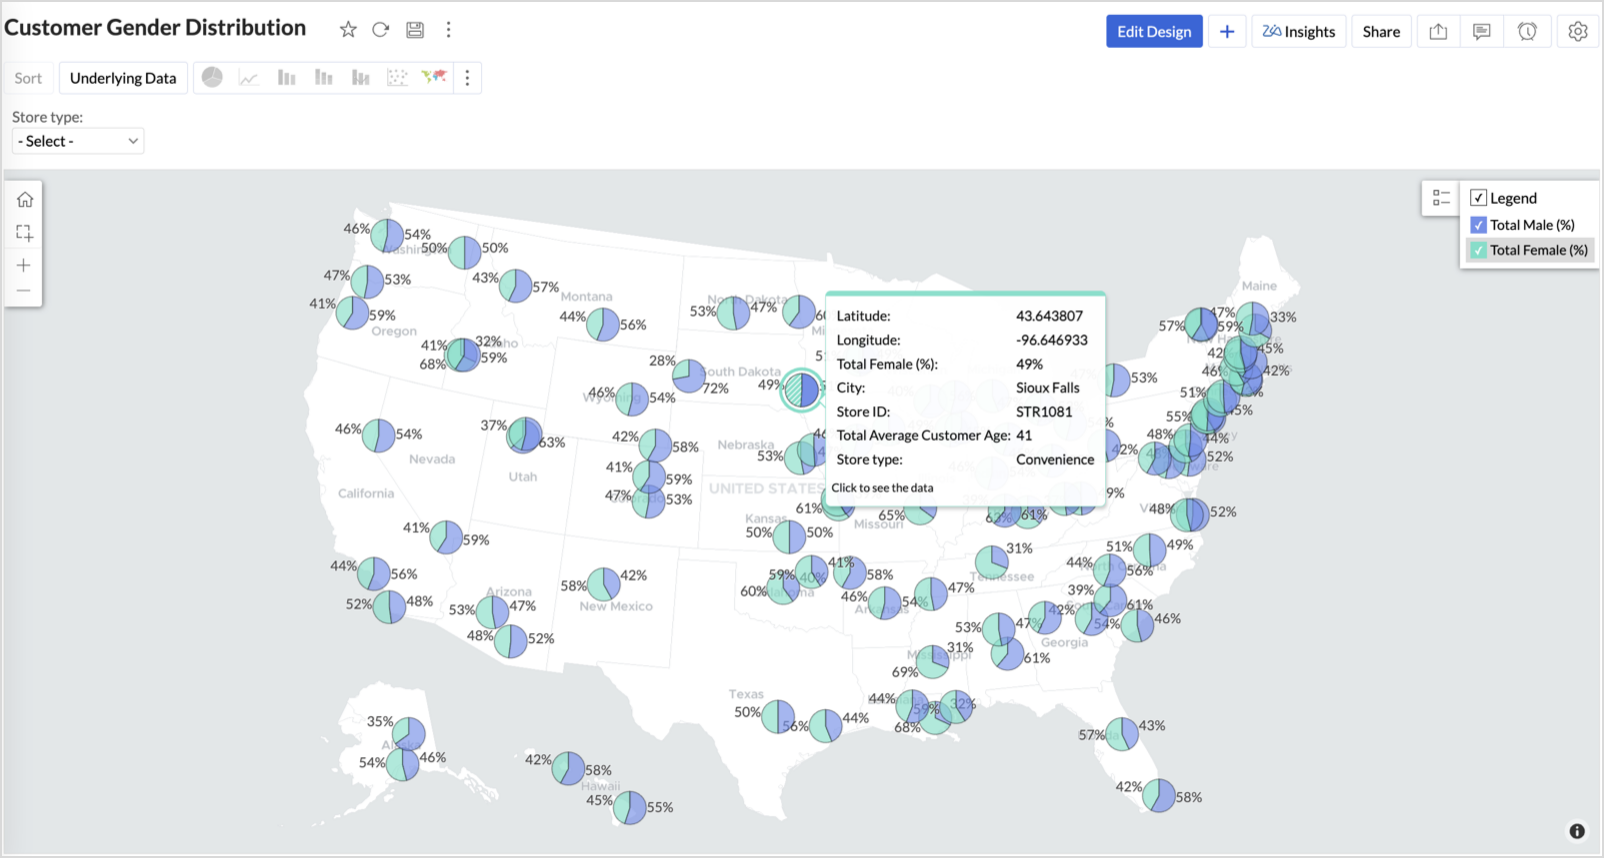
Each store will now display a pie chart representing the gender split among its customers, directly on the map.

Key Insights
Uneven gender split (e.g., 70% Male) - Potential to tailor offerings, branding, or promotions for the dominant gender

Balanced split (≈50/50) - Opportunity to run inclusive or diversified campaigns

High female ratio + specialty store - Indicates demand for niche products — expand category offerings

Business Interpretation
This chart allows marketing and merchandising teams to:
- Understand gender-based customer clustering across regions
- Launch targeted campaigns (e.g., loyalty programs, promotions)
- Refine product assortments to suit local preferences
For example: A store with 70% female shoppers may benefit from deeper investment in lifestyle categories, while a balanced store could serve as a testing ground for unisex offerings.
Summary
In this phase, we laid the foundation for geo-powered retail intelligence using Zoho Analytics. Through a single, well-structured dataset and four powerful geo map visualizations, we transformed raw store data into real, actionable business insights.
Here’s what we achieved:
|
Report
|
Business Insights
|
|
Store Performance (Bubble)
|
Identified stores that are over performing or at churn risk based on revenue and satisfaction.
|
|
Revenue-to-Traffic Ratio (Filled + Scatter)
|
Detected ghost zones and optimized marketing ROI by comparing traffic and revenue.
|
|
Competitor Pressure Zones (Scatter)
|
Mapped out competitor dominance and spotted at-risk or saturated regions.
|
|
Customer Gender Distribution (Pie)
|
Uncovered demographic patterns to tailor product, marketing, and in-store experience.
|
Click here to access the sample workspace.
These visualizations brought spatial awareness into every performance metric — turning maps into a strategic business tool.
And this... is just the beginning.
Stay tuned for Phase 2 — where Multi-Layer Geo Maps and Network Charts come together to supercharge your business strategy with even deeper spatial insights.
New to Zoho Recruit?
Zoho Campaigns Resources
Topic Participants
Pradeepkumar R
Sticky Posts
What’s New in Zoho Analytics – September 2025
Hello Users!! In this month’s update, we’re raising the bar across multiple touchpoints, from how you bring in data, plan and track projects to how you design and brand your dashboards. We’ve added the all-new Gantt chart for project visualization, expandedAnnouncing Agentic AI - Ask Zia!
We are delighted to roll out the new agentic AI capabilities in Ask Zia, where every stage of the BI workflow is assisted by AI. With a human-in-the-loop approach, Ask Zia ensures that you’re in command of the decision, while AI handles the complexity.Invitation-Based User Access in Zoho Analytics
Hello everyone, We’re rolling out an important update on how users are added to your Zoho Analytics Organization and Workspaces. Previously, when admins added users, they were automatically added to the organization. Moving forward, to improve securityZoholics Europe 2025: Your Ultimate Data Analysis (Zoho Analytics) Workshop Experience
Why should you attend? This year, Zoholics Europe 2025 is putting data analysis centre stage. With a dedicated workshop designed to answer all your data-related questions, you’ll gain practical skills, real-time solutions, and expert insights that you[Webinar] Evolving BI & Analytics in the Age of AI
Artificial intelligence is redefining how data is collected, analyzed, and leveraged across industries. As businesses strive to become more agile and insight-driven, traditional BI and analytics must transform to meet new demands. AI-first organizations
Zoho CRM Plus Resources
Zoho Books Resources
Zoho Subscriptions Resources
Zoho Projects Resources
Zoho Sprints Resources
Zoho Orchestly Resources
Zoho Creator Resources
Zoho WorkDrive Resources
Zoho CRM Resources
Get Started. Write Away!
Writer is a powerful online word processor, designed for collaborative work.
Zoho CRM コンテンツ
-
オンラインヘルプ
-
Webセミナー
-
機能活用動画
-
よくある質問
-
Ebook
-
-
Zoho Campaigns
- Zoho サービスのWebセミナー
その他のサービス コンテンツ
ご検討中の方
Recent Topics
【Zoho CRM】ポータル機能のアップデート:UIとポータルの作成フローの変更
ユーザーの皆さま、こんにちは。コミュニティチームの藤澤です。 今回は「Zoho CRM アップデート情報」の中から、ポータル機能のアップデートをご紹介します。 目次 概要 ユーザーグループの作成フローの変更 ユーザーグループ詳細画面内のタブについて 「タブと権限」タブについて 「設定」タブについて 概要 UIとポータルの作成フローが変更されました。ポータルの新機能に先立ち、UIを一部変更しました。タブやオプションの配置を見直し、機能へよりアクセスしやすくなっています。 また、「ポータルユーザーの種類」は今後、「ユーザーグループ」と呼称され、ページ上のボタンも「ユーザーグループを作成する」に変更されます。Tax on Imported goods charged by Shipping Company
Hi Folks, I imported goods from outside Canada, for better understanding I will give an example data. imported goods value: 2000$ The shipping company sent me an invoice containing the following information: Custom duty on imported goods: 400$ AdministrationPrefilled Date fields auto-changed and then locked when using “Edit as new”
If a document out for signature has date fields (not SignedDate fields) that were pre-filled before sending, and then you use “Edit as new” to create a new version of the same document, the value of those date fields gets automatically changed to todayZoho Webinar via Social Media
Hello, is it possible to stream a Zoho Webinar via Social Media like Linkedin or Facebook?Add Hebrew & RTL Support to Feedback Widget
Hello Zoho Desk Team, How are you? We are using Zoho Desk and would like to utilize the Feedback Widget. While Zoho Desk itself supports Hebrew and RTL, the Feedback Widget unfortunately does not. We kindly request that Hebrew and full RTL support beOAUTH2 isn't working with Power Automate and N8N (Zoho Desk)
Hello, I am trying to set up an OAuth2 connection to the Zoho Desk API, but the authentication flow fails immediately. I am experiencing this issue in two separate platforms: Microsoft Power Automate (using a Custom Connector) and n8n. Instead of beingKit Items Breaking Automations - "Provide mapped components for all kit items"
This has been brought up in other threads, but I believe this issue warrants its own topic. Whenever a sales document (Estimate, Sales Order, Invoice) is created or manipulated programmatically, trying to include a Kit as an Item throws this error: "ProvideShow item Cost value on Item screen
The Item screen shows Accounting Stock and Physical Stock. It would be very helpful if value information could be displayed here as well, for instance Cost Price. Currently, to find the Cost Price (as used for inventory valuations) from inside the itemMark shipment as delivered via api
Hellloooo again Zoho guys !! More help required if you would be so kind, pleeeezz..... var options = { 'method' : 'post', 'contentType' : 'application/json', 'muteHttpExceptions' : true }; var myPackNo = encodeURIComponent('###################');Setting Alternative units for an item.
Hello Team, How to create alternate units for an item. We are placing orders for stocks in boxes. One box contain 24 items. At the time of selling we have two categories of buyers wholesalers and retailers. So the sales will be in PCS and in boxes also.Zoho Inventory search when adding items to SO/PO, etc.
I do not see that Zoho Inventory searches within the item name for an item lookup. We have many products with variants. So when I search for a product, say a lighting system, and it comes in different sizes and colors, I can only get those products whereItem Group Attributes
Hello, I would like to see more attributes under grouped items. We sell car parts, there are several suppliers for the same part but under different brands. We want to group them together but the attributes under groups are lacking. For example, the productsRemove HTML Format - Deluge
Hello @all if you want to delete the HTML format from the text please follow the script. Data = "Text"; info Data..replaceAll("<(.|\n)*?>" , "").replaceAll(" " , " "); Apart from this if you require anything please let me know Thanks & Regards PiyushUsing multiple languages in template
I wanted to add the company name in the template in arabic. I found a way through the header and footer option, except when i print the quotation the arabic disappears both in the top and bottom of the page. I have attached pictures of the before andADDING 5% VAT TO PURCHASE ORDERS GENERATED ON ZOHO BOOKS UAE
Please guide on how to add 5% VAT to Purchase Orders generated on ZOHO Books UAE edition.Import from /csv file, some items fail with the error "Specify Tax Or Tax Exemption".
Hello! I am trying to import a csv file of all of my expenses for a complete financial year. I get errors for some items with the error message "Specifiy Tax or Tax Exemption". These errors only occur on lines where I have "Postage" as the expense account.About maximum number of requests per minute
Hi, Our company has integrated Zoho inventory and we're using the shipping order creation and update functions and so on. Currently we're receiving "For security reasons you have been blocked for some time as you have exceeded the maximum number of requestsApproval - Report/Views
Hi, On Zoho Desk - Is there a way to report on pending approvals, or a view or similar?"Zoho CRM Integration" option is missing in Zoho Social Settings
I am trying to integrate my Zoho Social account with my Zoho CRM account. I am on the Professional Trial plan and my user role is "Brand Admin". However, I cannot find the "Zoho CRM Integration" or "Lead Generation" option anywhere in my Zoho Social settings.Error 553
Não estou conseguindo enviar ou receber e-mail, sempre dando o erro 553, sendo que há mais de um mês o domínio está pago e liberado. Preciso de um suporte urgenteAutomate insurance document workflows with Zoho Writer
Insurance companies have to deal with creating and managing complex documents and forms, such as policy applications, explanation of benefits documents, brochures, renewals, and claim forms. Handling all of this manually is hugely time and effort intensive,Create PDFs with Text so that we can copy from a generated PDF
Currently, any information that a user enters into a field cannot be highlighted and copied from the PDF that Zoho Sign renders. For example, if someone were to provide a phone number in a Zoho Sign text field, you would not be able to copy the phoneHow To Insert Data into Zoho Table using Api
Hi Community, I have created a table inside zoho tables. How do I insert data into table using API. Please tell the exact endpoint and payload , I just have to insert data into table columns. Also tell how to find tableid, viewid, baseid etc. which areHow do I delete a folder in Marketing Automation?
Folders are used across contact lists and segments, and email templates. How do I delete a folder once it's been created?Portal Approval Process
Hi Zoho team and fellow users, I am seeking a method to establish a multi-step approval process between a Zoho user and a portal user (Custom Portal) to review and approve requests through the Custom Portal. For instance, within this setup, one of theNarrative 8: Intelligent in-app support that's instantly available anytime and anywhere
Behind the scenes of a successful ticketing system - BTS Series Narrative 8: Intelligent in-app support that's instantly available anytime and anywhere The App Support Across Platforms (ASAP) add-on for Zoho Desk is an independent application that integratesNavigation issue — unable to return to Customer page after opening Receipt from Transactions
Steps to reproduce: Open a Customer record. Go to Transactions tab and open a Receipt by clicking its receipt number. After viewing the receipt, clicking browser Back or closing the receipt does not reliably return me to the original Customer record (IThermal Printer Option Needed for Delivery Challan Templates
Currently in Zoho Books, the Delivery Challan template only supports A4 and A5 page sizes. However, in many businesses (especially retail and hardware), we use thermal printers (like 3-inch or 4-inch rolls) to print delivery challans. It would be verySeparate Default Payment Modes for Receipts vs. Payments
Right now, when I set a default Payment Mode via a customer invoice or Payments Received screen, that same mode shows up for vendor payments (Purchases → Payments Made). 🔹 Request: We need different default modes for: Customer receipts (e.g., defaultUpdate/Change GSTIN in GST Settings of zohobooks
We are trying to update our GSTIN under the GST settings section of our Zohobooks account Initially, we had entered a dummy GSTIN (123456789123456) to generate a sample invoice before obtaining our official GST registration. After receiving our actualLink Payment Mode and Paid Through Accounts
For most users, it's very difficult for them to understand that the Payment Mode is totally independent of the Paid Through account when paying bills. It seems (and is) redundant for them to have to select what is basically the same thing twice. The currentLets enable business to choose the default payment mode
Lets enable business to choose the default payment mode so that we do not have choose payment mode again and again for each and every transsctionsAdd Attachment Support to Zoho Flow Mailhook / Email Trigger Module
Dear Zoho Support Team, We hope you are well. We would like to kindly request a feature enhancement for the Mailhook module in Zoho Flow. Currently, the email trigger in Zoho Flow provides access to the message body, subject, from address, and to address,South African Payment Gateways
Since the "Demise" of Wave many South African users have moved over to Zoho and yet for years users have been requesting Integration with a South African Payment Gateway to no avail. Payfast was the most commonly requested gateway as it supports recurringHas anyone verified if Zoho is PCI compliant?
We are planning on using Zoho to process payments via Authorize.net. We have everything set up and are attempting to complete the PCI DSS SAQ-A requirement for our merchant account. This requires us to prove Zoho has completed the SAQ-D for Service Providers. We need a way to verify compliance, or a copy of an attestation of compliance signed by the appropriate officer at Zoho. I assume I'm not the first person to use Zoho to process payment, and therefore not the first to require this informationBigin Plugin for Outlook
Could we get this added? The Gmail version already exists, and I would like to avoid having to make a switch.Date does not fit the field
Hi There. I am having fun learning zoho sign API. Today I noticed the "Signed Date" field does not fit, or alternatively the font is to large for the auto field space. See screenshot below. The signed date field is created by putting {{Signdate}} on theTip of the Week #69 – Automate your Zoho TeamInbox tasks with n8n integration.
Don’t waste time repeating the same tasks—like sending follow-up emails or adding new contacts. Let automation save the day. With n8n, an open-source automation tool, you can connect your favorite apps and let them handle the busywork for you. You don’tMulti Page/Step Forms in creator
Greetings i was wondering if it's possible to create multipage/step forms on creator similar to what we have on zoho forms. is that possbile? ThanksPackage Geometry
how can i add the dimensions and weight capacity of the available boxes to be default in the system everytime we use it ?Next Page


