Spotlight Series #14: Visualize your data with tables

Hello everyone,
When presenting data, it's critical to ensure the information is understandable and meaningful to your audience. Representing data visually is ideal, as it can help audiences comprehend complex information quickly. Tables help organize your information and play a crucial role in conveying it effectively, so viewers can interpret your data faster.
You can use tables to compare two or more pieces of information in the form of text or numerals.
Working with tables in Show:
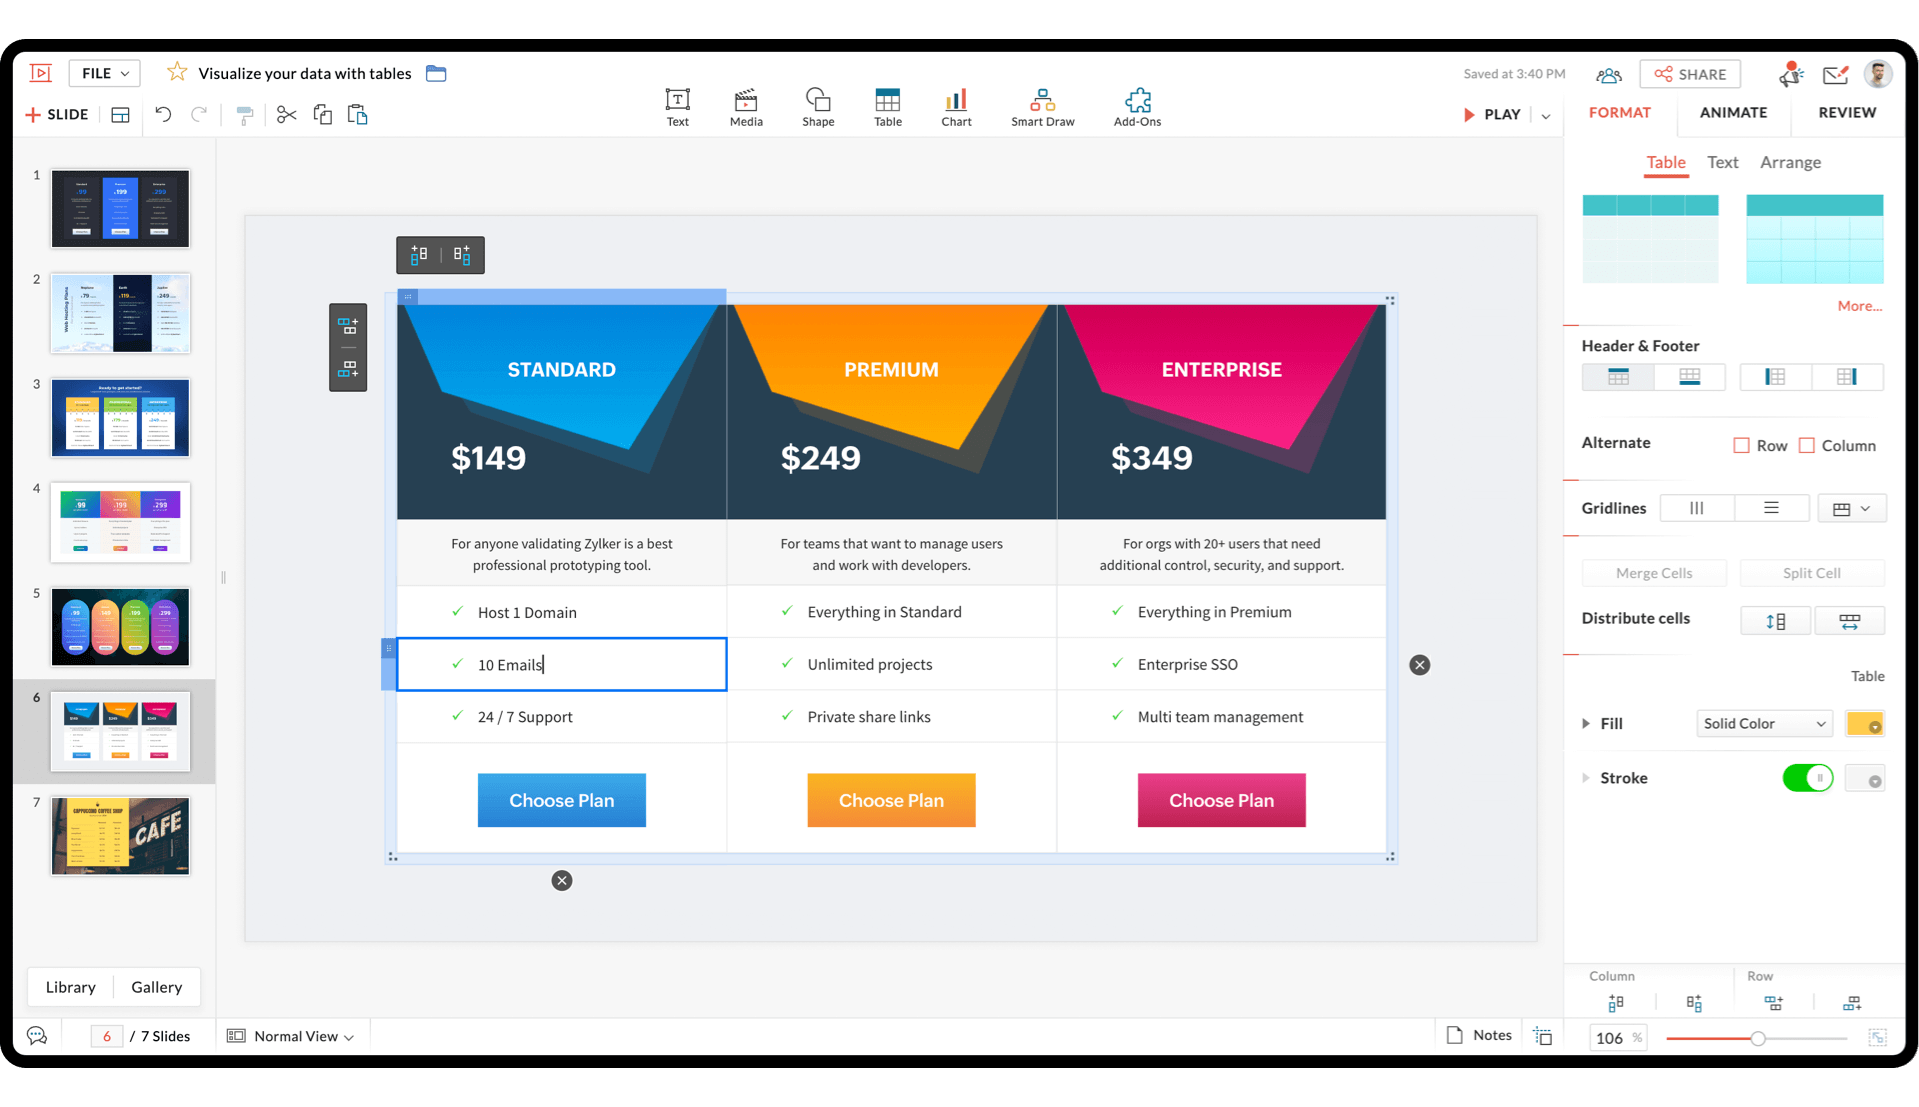
The Show app makes it easy for you to insert a table. You can add, edit, and customize it as needed.
Create:
With the Show app, you can create tables in a snap. All you have to do is hover the cursor and choose a number of rows and columns for the table. Initially, you can create a table with a maximum of eight rows and eight columns. However, you can add any number of rows and columns later.
Edit:
 and
and  help you add columns to the left or right of the selected column.
  and
and  helps you add rows up or below of the selected row. To delete a row or column, use the
  icon.
icon. 
Format:
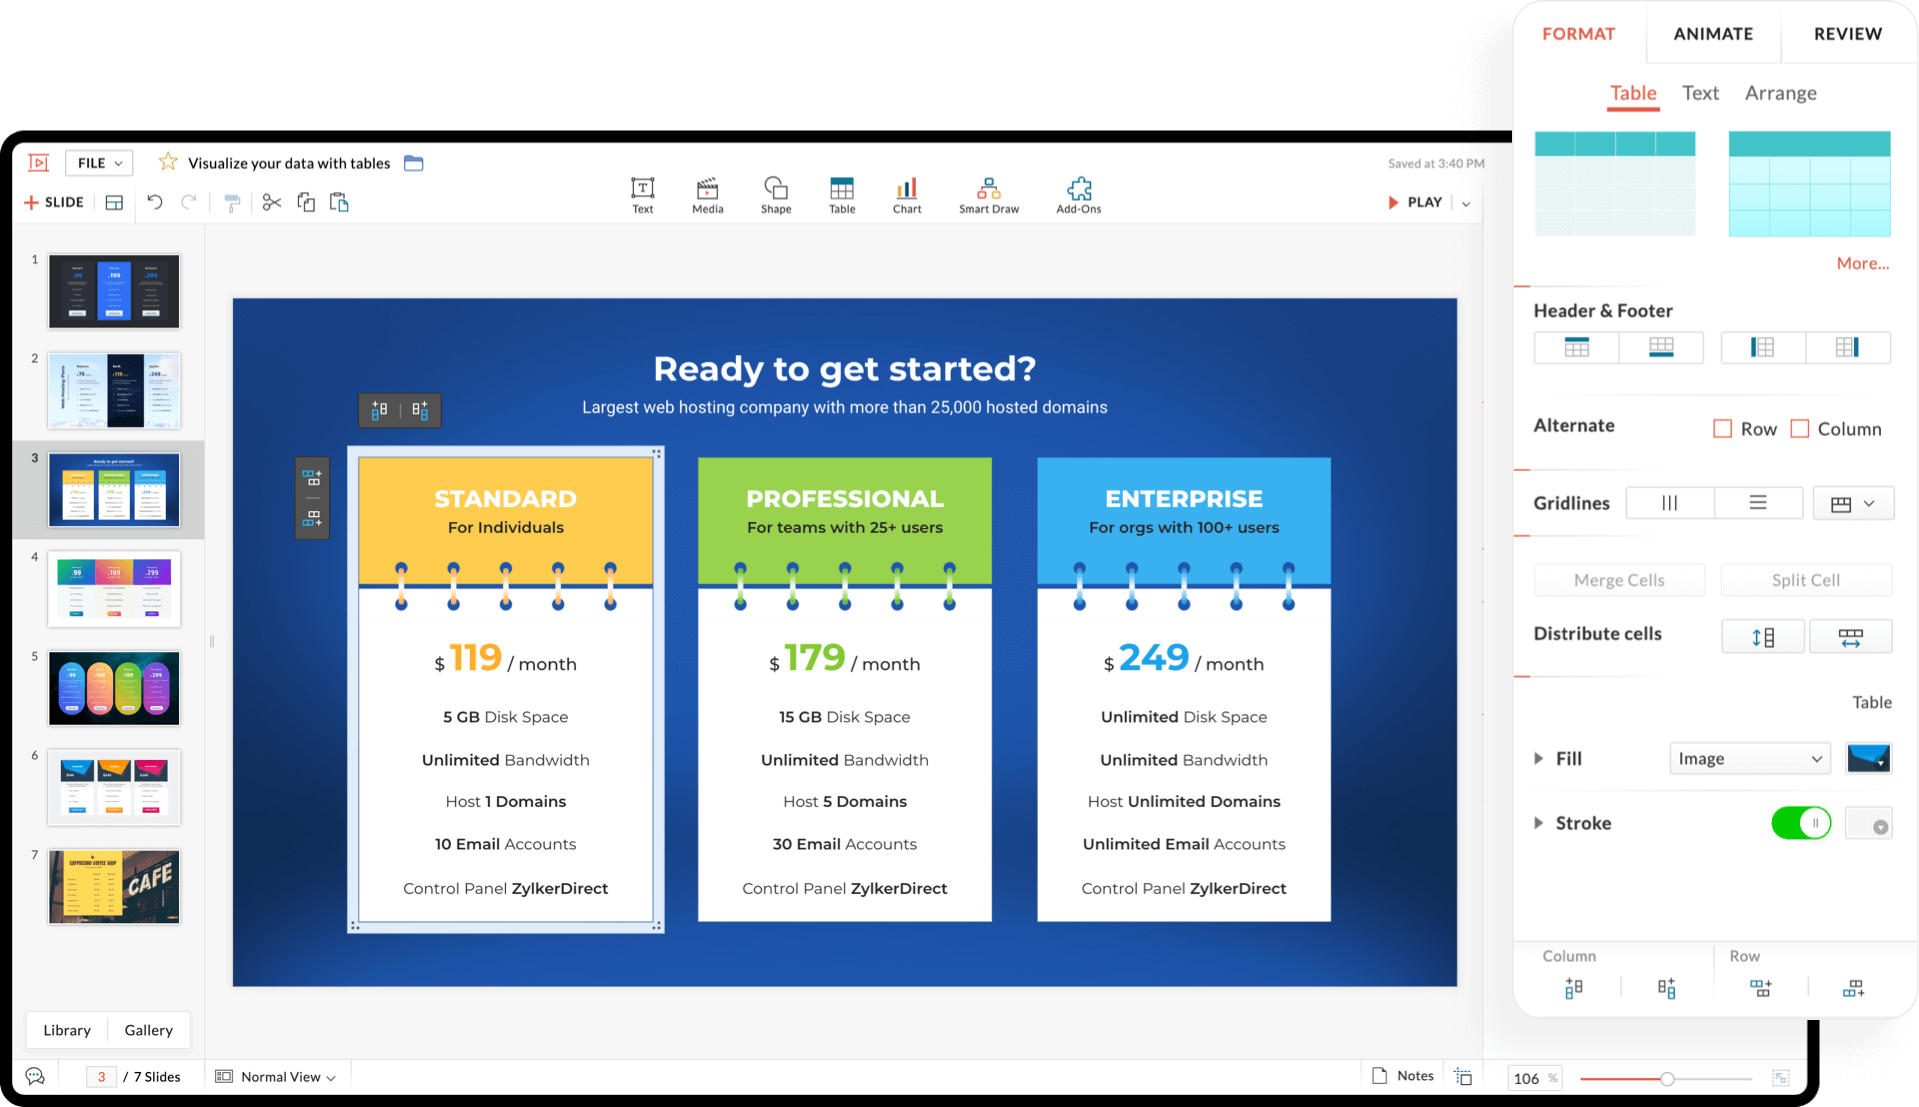
Zoho Show lets you format tables using a wide range of customization options. With Show, you can:
- Choose a style from a variety of built-in table presets.
- Change the header and footer of the table to display horizontally or vertically.
- Shade alternate rows or columns for visual distinction.
- Add table grid lines to distinguish each cell in the table.
- Merge two or more cells.
- Distribute the table's cells to adjust the height and the width of the rows and columns.
- Highlight cells, rows, or columns with a fill color, image, or pattern.
- Give definition to the table by applying a border.
- Align the text inside a cell.

Pro tip: Want to move data from a table to a chart? You don't have to re-enter the entire data set. Simply right-click on the table and use the Convert to Chart option to transform it into either a chart or graph.
New to Zoho Recruit?
Zoho Campaigns Resources
Topic Participants
Gowthami Boominathan
Zoho CRM Plus Resources
Zoho Books Resources
Zoho Subscriptions Resources
Zoho Projects Resources
Zoho Sprints Resources
Zoho Orchestly Resources
Zoho Creator Resources
Zoho WorkDrive Resources
Zoho CRM Resources
Get Started. Write Away!
Writer is a powerful online word processor, designed for collaborative work.
Zoho CRM コンテンツ
-
オンラインヘルプ
-
Webセミナー
-
機能活用動画
-
よくある質問
-
Ebook
-
-
Zoho Campaigns
- Zoho サービスのWebセミナー
その他のサービス コンテンツ
ご検討中の方
Recent Topics
Work Type - Limitation
Hello, I'm setting up work types and have noticed, a limitation on the parts area to 10 lines. Can this be increased to 20 or greater? In addition to this, when I attempt to add the work type to a work order, the correct labour hours doesn't flow through.Module Customisation - Lookup function not available
Good evening, Within my business, I can have multiple customers, who have multiple mobile assets. When I set these assets up, I enter information such as vehicle registration, Vehicle identification number (VIN), Unit number, YOM, in addition to others.Emails sent through Bigin are not posting in IMAP Sent folder
I have set up my email to work from within Bigin using IMAP. I am using IMAP so I can sync my email across multiple devices - phone / laptop / desktop / iPad / etc. I want all my emails to populate my email client (outlook & iphone email) whether orTurning the page for Zoho SalesIQ: 2025 to 2026
As we wrap up 2025, we would like to take a moment to reflect on what we set out to achieve this year, what we’ve delivered, and where we’re headed next. What we focused on in 2025 This year was all about strengthening the core of engagement and AI, makingStage-probability mapping feature in custom module
Hi, I'm building a custom module for manage projects. I would like to implement the stage-probability feature that Potentials has. Is this possible?Temporary Outage in Zoho Cliq Affecting US Users – July 23, 2025
We experienced a service disruption in Zoho Cliq that impacted core functionality for users in the US region. The issue occurred between Jul 23, 2025, 06:54:00 PM IST and 07:13:13 PM IST, lasting approximately 19 minutes. To restore service stability,Why Sharing Rules do Not support relative date comparison???
I am creating a Sharing Rule and simply want to share where "Last Day of Coverage" (Date field) is Greater than TODAY (Starting Tomorrow). However, sharing rules don't have the option to compare a date field to a relative date (like today), only to StaticZoho Cliq not working on airplanes
Hi, My team and I have been having this constant issue of cliq not working when connected to an airplane's wifi. Is there a reason for this? We have tried on different Airlines and it doesn't work on any of them. We need assistance here since we are constantlyProblem with Workdrive folders
I'm having a problem a problem accessing files in a Zoho work drive folder when using the Zoho writer app. The problem folder appears grayed out in the Zoho work drive window in both the online and writer application. However I can open the folder inSend Supervisor Rule Emails Within Ticket Context in Zoho Desk
Dear Zoho Desk Team, I hope this message finds you well. Currently, emails sent via Supervisor Rules in Zoho Desk are sent outside of the ticket context. As a result, if a client replies to such emails, their response creates a new ticket instead of appendingMulti-currency and Products
One of the main reasons I have gone down the Zoho route is because I need multi-currency support. However, I find that products can only be priced in the home currency, We sell to the US and UK. However, we maintain different price lists for each.Create an Eye-Catching Announcement Widget for Your Help Center
Hello Everyone! In this week’s edition, let’s explore how to keep your customers updated with exciting news in the Help Center. See how ZylkerMobile wowed their customers by bringing updates right to their portal. ZylkerMobile, the renowned brand forSend Whatsapp with API including custom placeholders
Is is possible to initiate a session on whatsapp IM channel with a template that includes params (placeholders) that are passed on the API call? This is very usefull to send a Utility message for a transactional notification including an order numberCustomer Management: #6 Common Mistakes in Customer Handling
Managing customers doesn't usually fall apart overnight. More often, slight gaps in the process slowly become bigger problems. Incidents like missed follow-ups, billing confusion, and unhappy customers will lead to revenue loss. Many businesses don'tZoho Desk iOS app update: UI enhancement of picklist and multi picklist fields
Hello everyone! We have enhanced the UI of the picklist and multiselect picklist fields on the Zoho Desk iOS app to provide a more refined, efficient, and user-friendly experience. We have now supported an option to Search within the picklist and multiselectZoho Desk iOS app update: Revamped scribbles with Apple pencil kit
Hello everyone! We’re excited to introduce a revamped Scribble experience, rebuilt from the ground up using Apple PencilKit for smooth strokes, proper scaling, and seamless image uploads. Please update the app to the latest version directly from the AppZoho Desk Android app update: Norwegian language support
Hello everyone! In the most recent Android version of the Zoho Desk app update, we have brought in support to access the app in Norwegian language. We have introduced the Norwegian language on the IM module of the Zoho Desk app as well. Please updateIs it possible to roll up all Contact emails to the Account view?
Is there a way to track all emails associated with an Account in one single view? Currently, email history is visible when opening an individual Contact record. However, since multiple Contacts are often associated with a single Account, it would be beneficialFunction #53: Transaction Level Profitability for Invoices
Hello everyone, and welcome back to our series! We have previously provided custom functions for calculating the profitability of a quote and a sales order. There may be instances where the invoice may differ from its corresponding quote or sales order.Payment Vouchers
Is there any Payment Vouchers in Zoho? How can we create payment for non-trade vendors, i.e. professional fees, rent, and payment to commissioner income tax?API in E-Invoice/GST portal
Hi, Do I have to change the api in gst/e-invoice portal as I use zoho e books for my e-invoicing. If yes, please confirm the process.When I click on PDF/PRINT it makes the invoice half size
When I click PDF / Print for my invoice in Zoho Books, the generated PDF appears at half size — everything is scaled down, including the logo, text, and layout. The content does not fill the page as it should. Could someone advise what causes Zoho BooksSearch by contain letter in a column
Hello, everyone I need a filter function that searches by letter in a cell, and it should be a macro. To clarify further, if I have a column with several names and I chose a search cell and what I want is search by a single letter, for example, "a" thenArchiving Contacts
How do I archive a list of contacts, or individual contacts?Enrich your contact and company details automatically using the Data Enrichment topping
Greetings, I hope you're all doing well. We're happy to announce the latest topping we've added to Bigin: The Data Enrichment topping, powered by WebAmigo. This topping helps you automatically enhance your contact and company records in Bigin. By leveragingEasier onboarding for new users with stage descriptions
Greetings, I hope all of you are doing well. We're happy to announce a recent enhancement we've made to Bigin. You can now add descriptions to the stages in your pipeline. Previously, when creating a pipeline, you could only add stages. With this update,Zoho Books Invoices Templates
It would be really helpful to have more advanced features to customise the invoice templates in Zoho Books. Especially I´m thinking of the spacing of the different parts of the invoice (Address line etc.). If you have a sender and receiver address inCan add a colum to the left of the item in Zoho Books?
I would need to add a column to the left of the item column in Books. When i create custom fields, i can only display them to the right of the item.Verifying Zoho Mail Functionality After Switching DNS from Cloudflare to Hosting Provider
I initially configured my domain's (https://roblaxmod.com/) email with Zoho Mail while using Cloudflare to manage my DNS records (MX, SPF, etc.). All services were working correctly. Recently, I have removed my site from Cloudflare and switched my domain'sAI Bot and Advanced Automation for WhatsApp
Most small businesses "live" on WhatsApp, and while Bigin’s current integration is helpful, users need more automation to keep up with volume. We are requesting features based on our customer Feedbacks AI Bot: For auto-replying to FAQs. Keyword Triggers:Improved Contact Sync flow in Google Integration with Zoho CRM
Hello Everyone, Your contact sync in Google integration just got revamped! We have redesigned the sync process to give users more control over what data flows into Google and ensure that this data flows effortlessly between Zoho CRM and Google. With this2025 Ask the Experts sessions wrap-up : Key highlights from the experts
Here is a rewind journey of our Ask the Experts (ATE) Sessions, where we brought you expert insights and practical best practices together in one place. This recap highlights the key takeaways, learnings, and best practices from all these sessions soNew Enhancements to Zoho CRM and Zoho Creator Integration
Hello Everyone, We’ve rolled out enhancements to the Zoho Creator and Zoho CRM integration to align with recent updates made to the Zoho Creator platform. With enhancements to both the UI and functionality, This update also tightens access control byHow to disable the edit option in subform
How to disable the edit option in subformPower up your Kiosk Studio with Real-Time Data Capture, Client Scripts & More!
Hello Everyone, We’re thrilled to announce a powerful set of enhancements to Kiosk Studio in Zoho CRM. These new updates give you more flexibility, faster record handling, and real-time data capture, making your Kiosk flows smarter and more efficientAdding non-Indian billing address for my Zoho subscription
Hey Need help with adding a non-Indian billing address for my Zoho subscription, trying to edit the address to my Singapore registered company. Won't let me change the country. Would appreciate the help. Regards, RishabhIs it possible to enforce a single default task for all users in a Zoho Projects ?
In Zoho Projects, the Tasks module provides multiple views, including List, Gantt, and Kanban. Additionally, users can create and switch to their own custom views. During project review meetings, this flexibility creates confusion because different usersMove record from one custom module to another custom module
Is it possible to create a button or custom field that will transfer a record from one custom module to another? I already have the 'Leads' module used for the Sr. Sales department, once the deal is closed they convert it to the 'Accounts' module. I would like to create a 'Convert' button for a custom module ('Locations') for the department that finds locations for each account. Once the location is secured, I want to move the record to another custom module called 'Secured Locations'. It's basicallyConvert Lead Automation Trigger
Currently, there is only a convert lead action available in workflow rules and blueprints. Also, there is a Convert Lead button available but it doesn't trigger any automations. Once the lead is converted to a Contact/Account the dataset that can be fetchedNotes Not Saving
Hello, My notes are continuously not saving. I make sure to save them, I know the process to save them. It is not operator error. I go back into a Leads profile a while later and do not see the previous notes that I have made. I then have to go back and do unnecessary research that would have been in the notes in the first place. Not a good experience and it is frustrating. Slows me down and makes me do unnecessary work. Please resolve. As a quick heads up, deleting cookies is not a fixNext Page


