Tip of the Week - Conditional Formatting Chart
Conditional formatting allows you to highlight your data series based on a pattern or a trend in your data. This makes it easy for you to identify when your data reaches certain values or when it deviates from the trend.
Zoho Analytics allows you to format chart data points with specific color based on a condition. In this week's tip, we'll see how to apply conditional formatting over your chart.
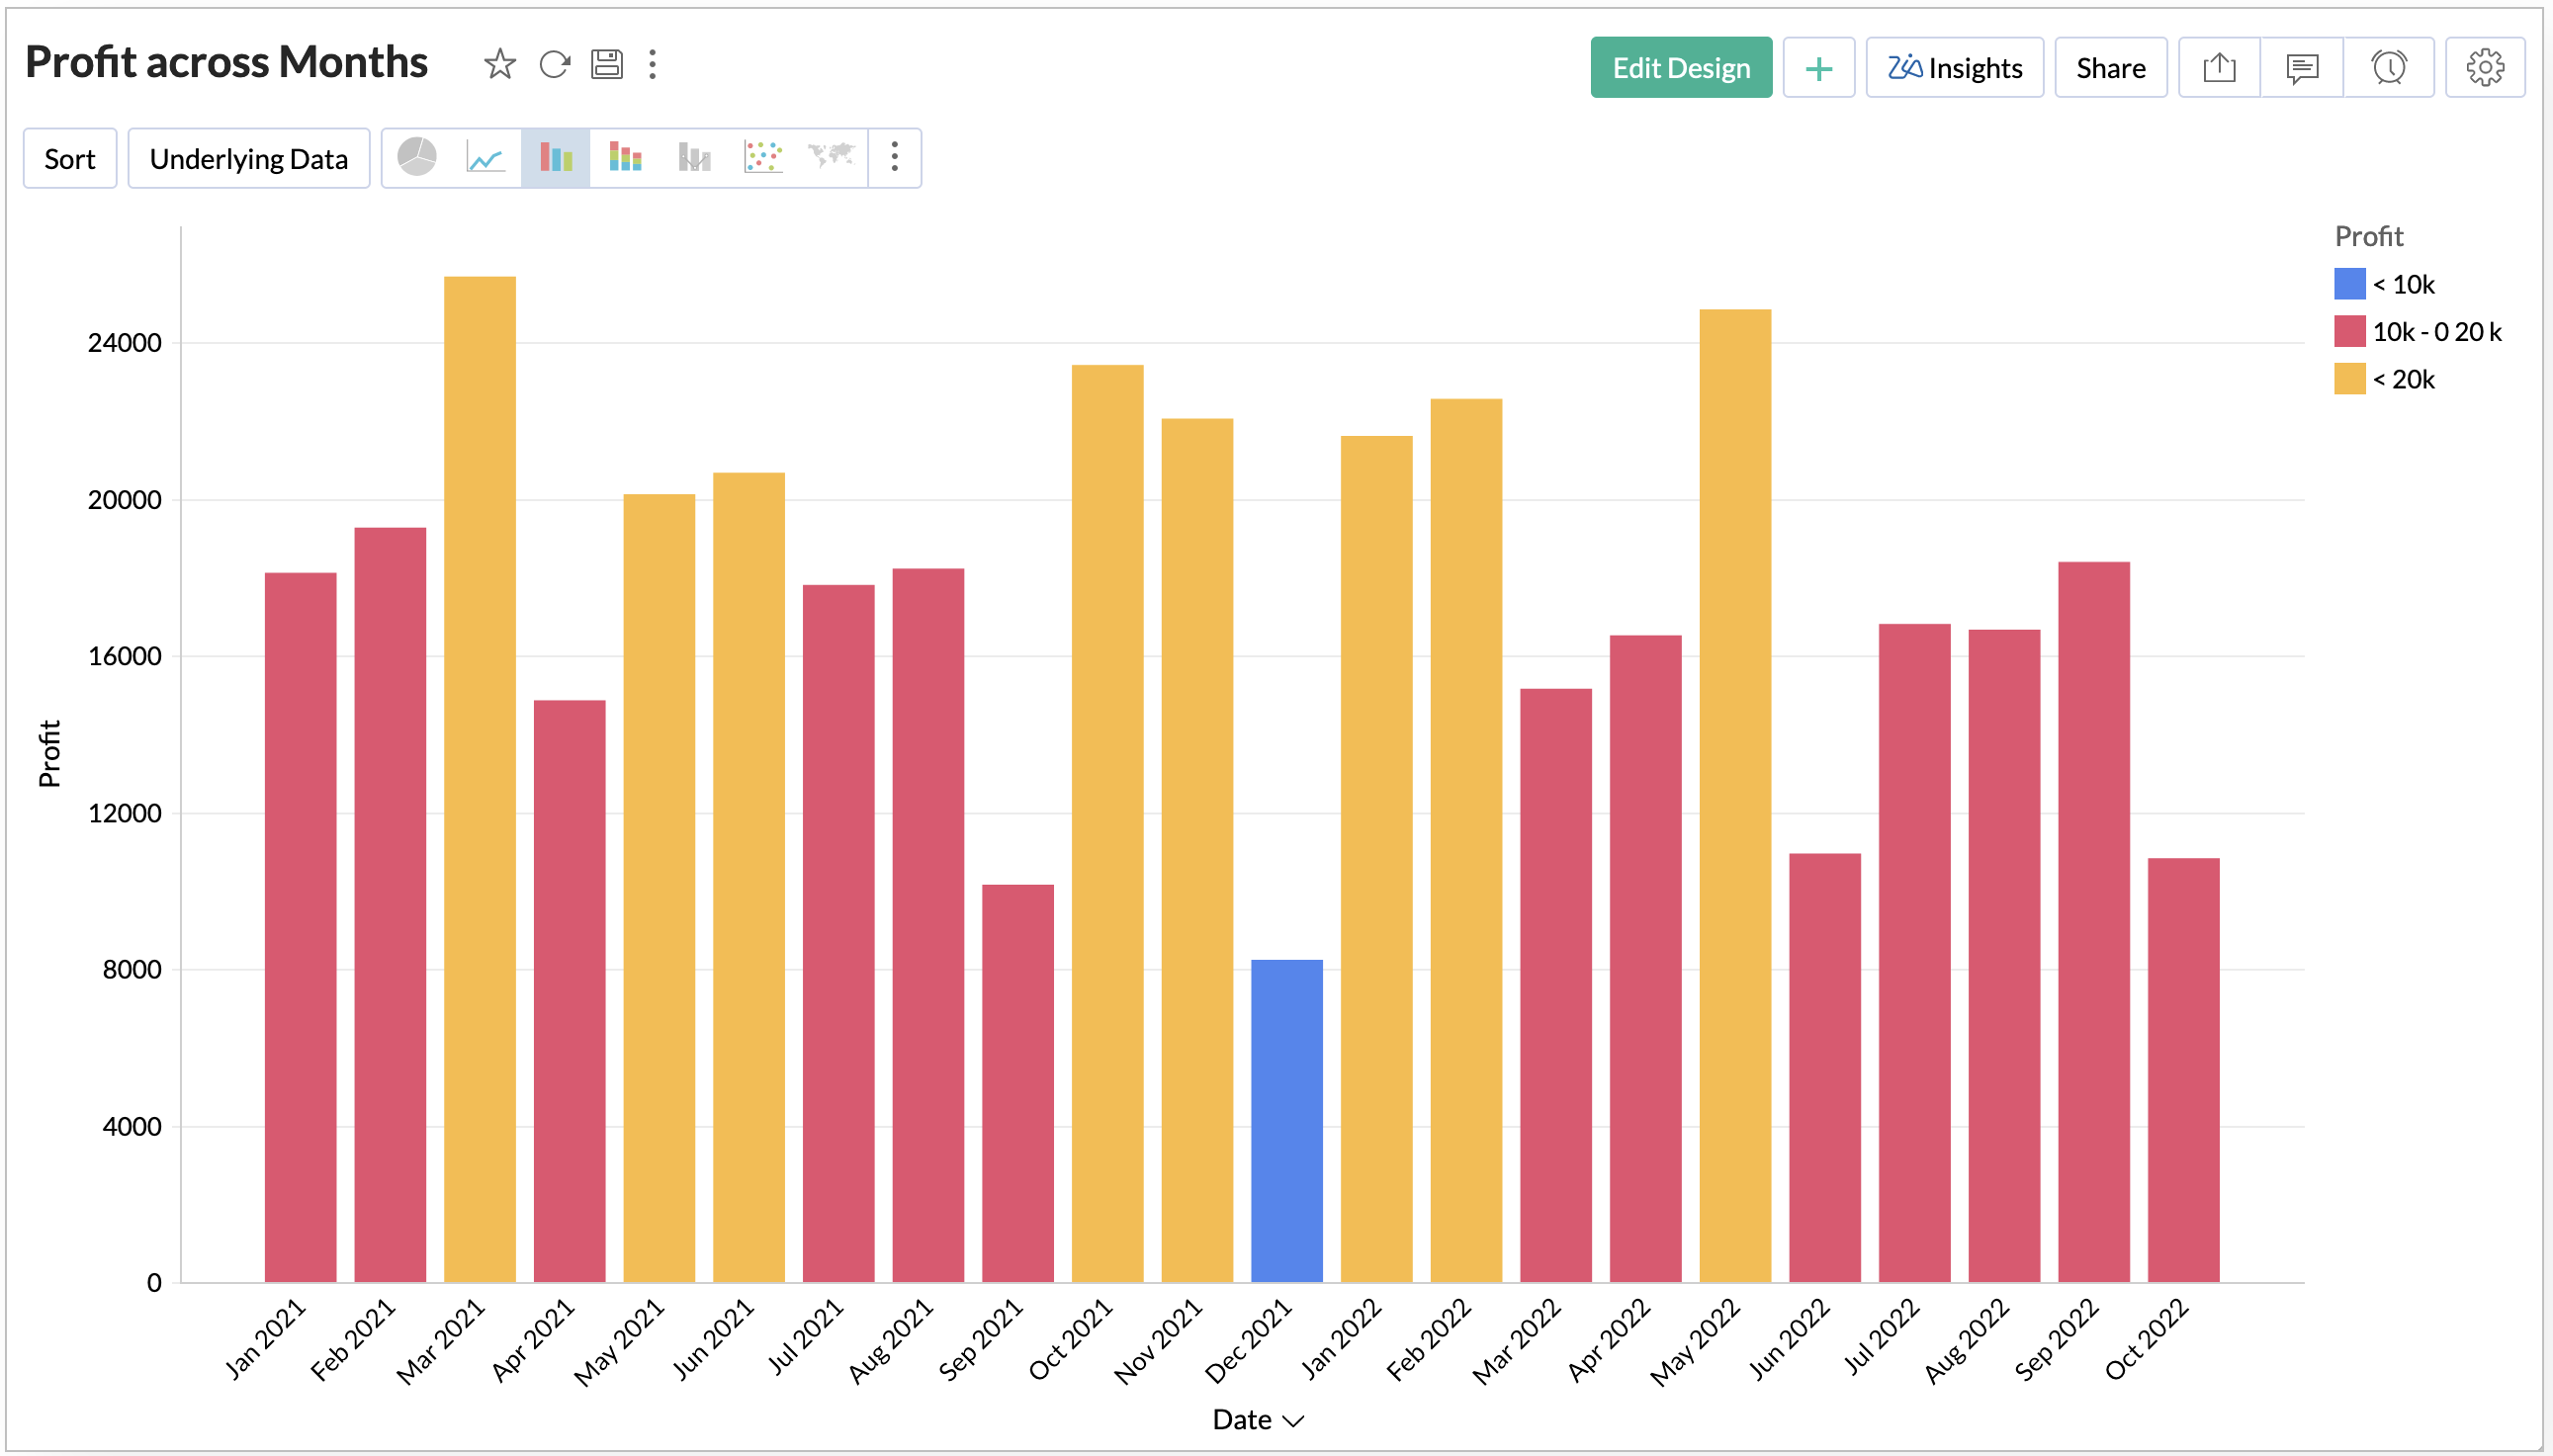
Let's see how to format the Profit across months by the profit range.
-
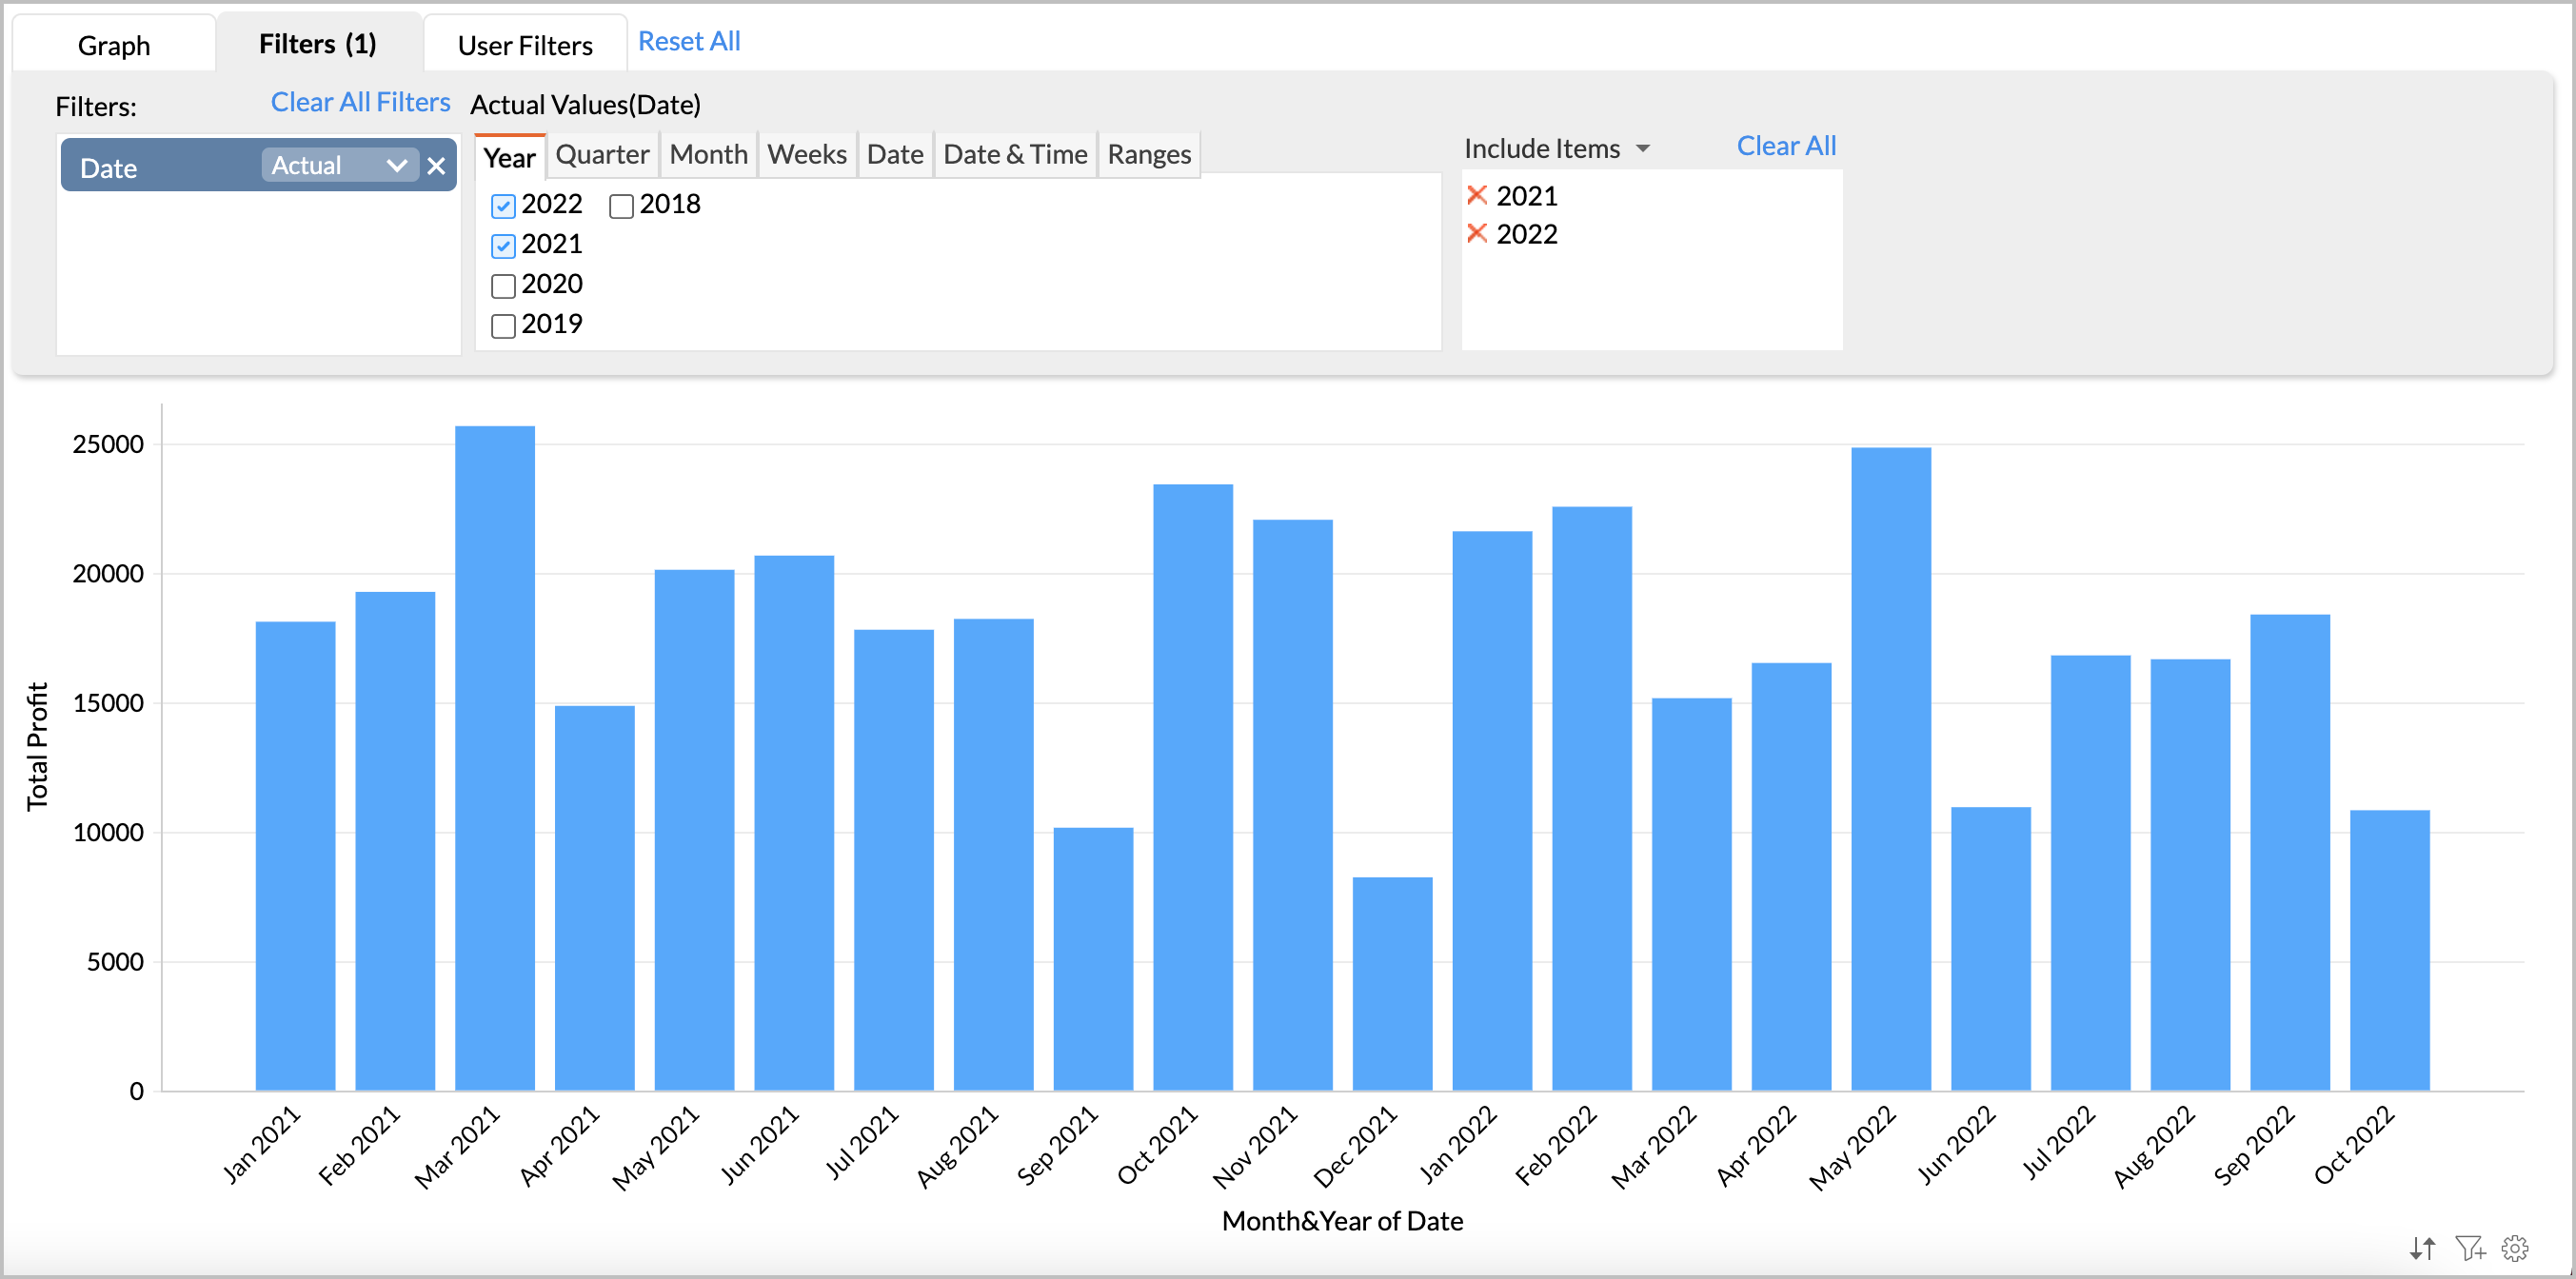
Open the chart in
Edit Design
mode.
-
Add the Profit column in the Color shelf.
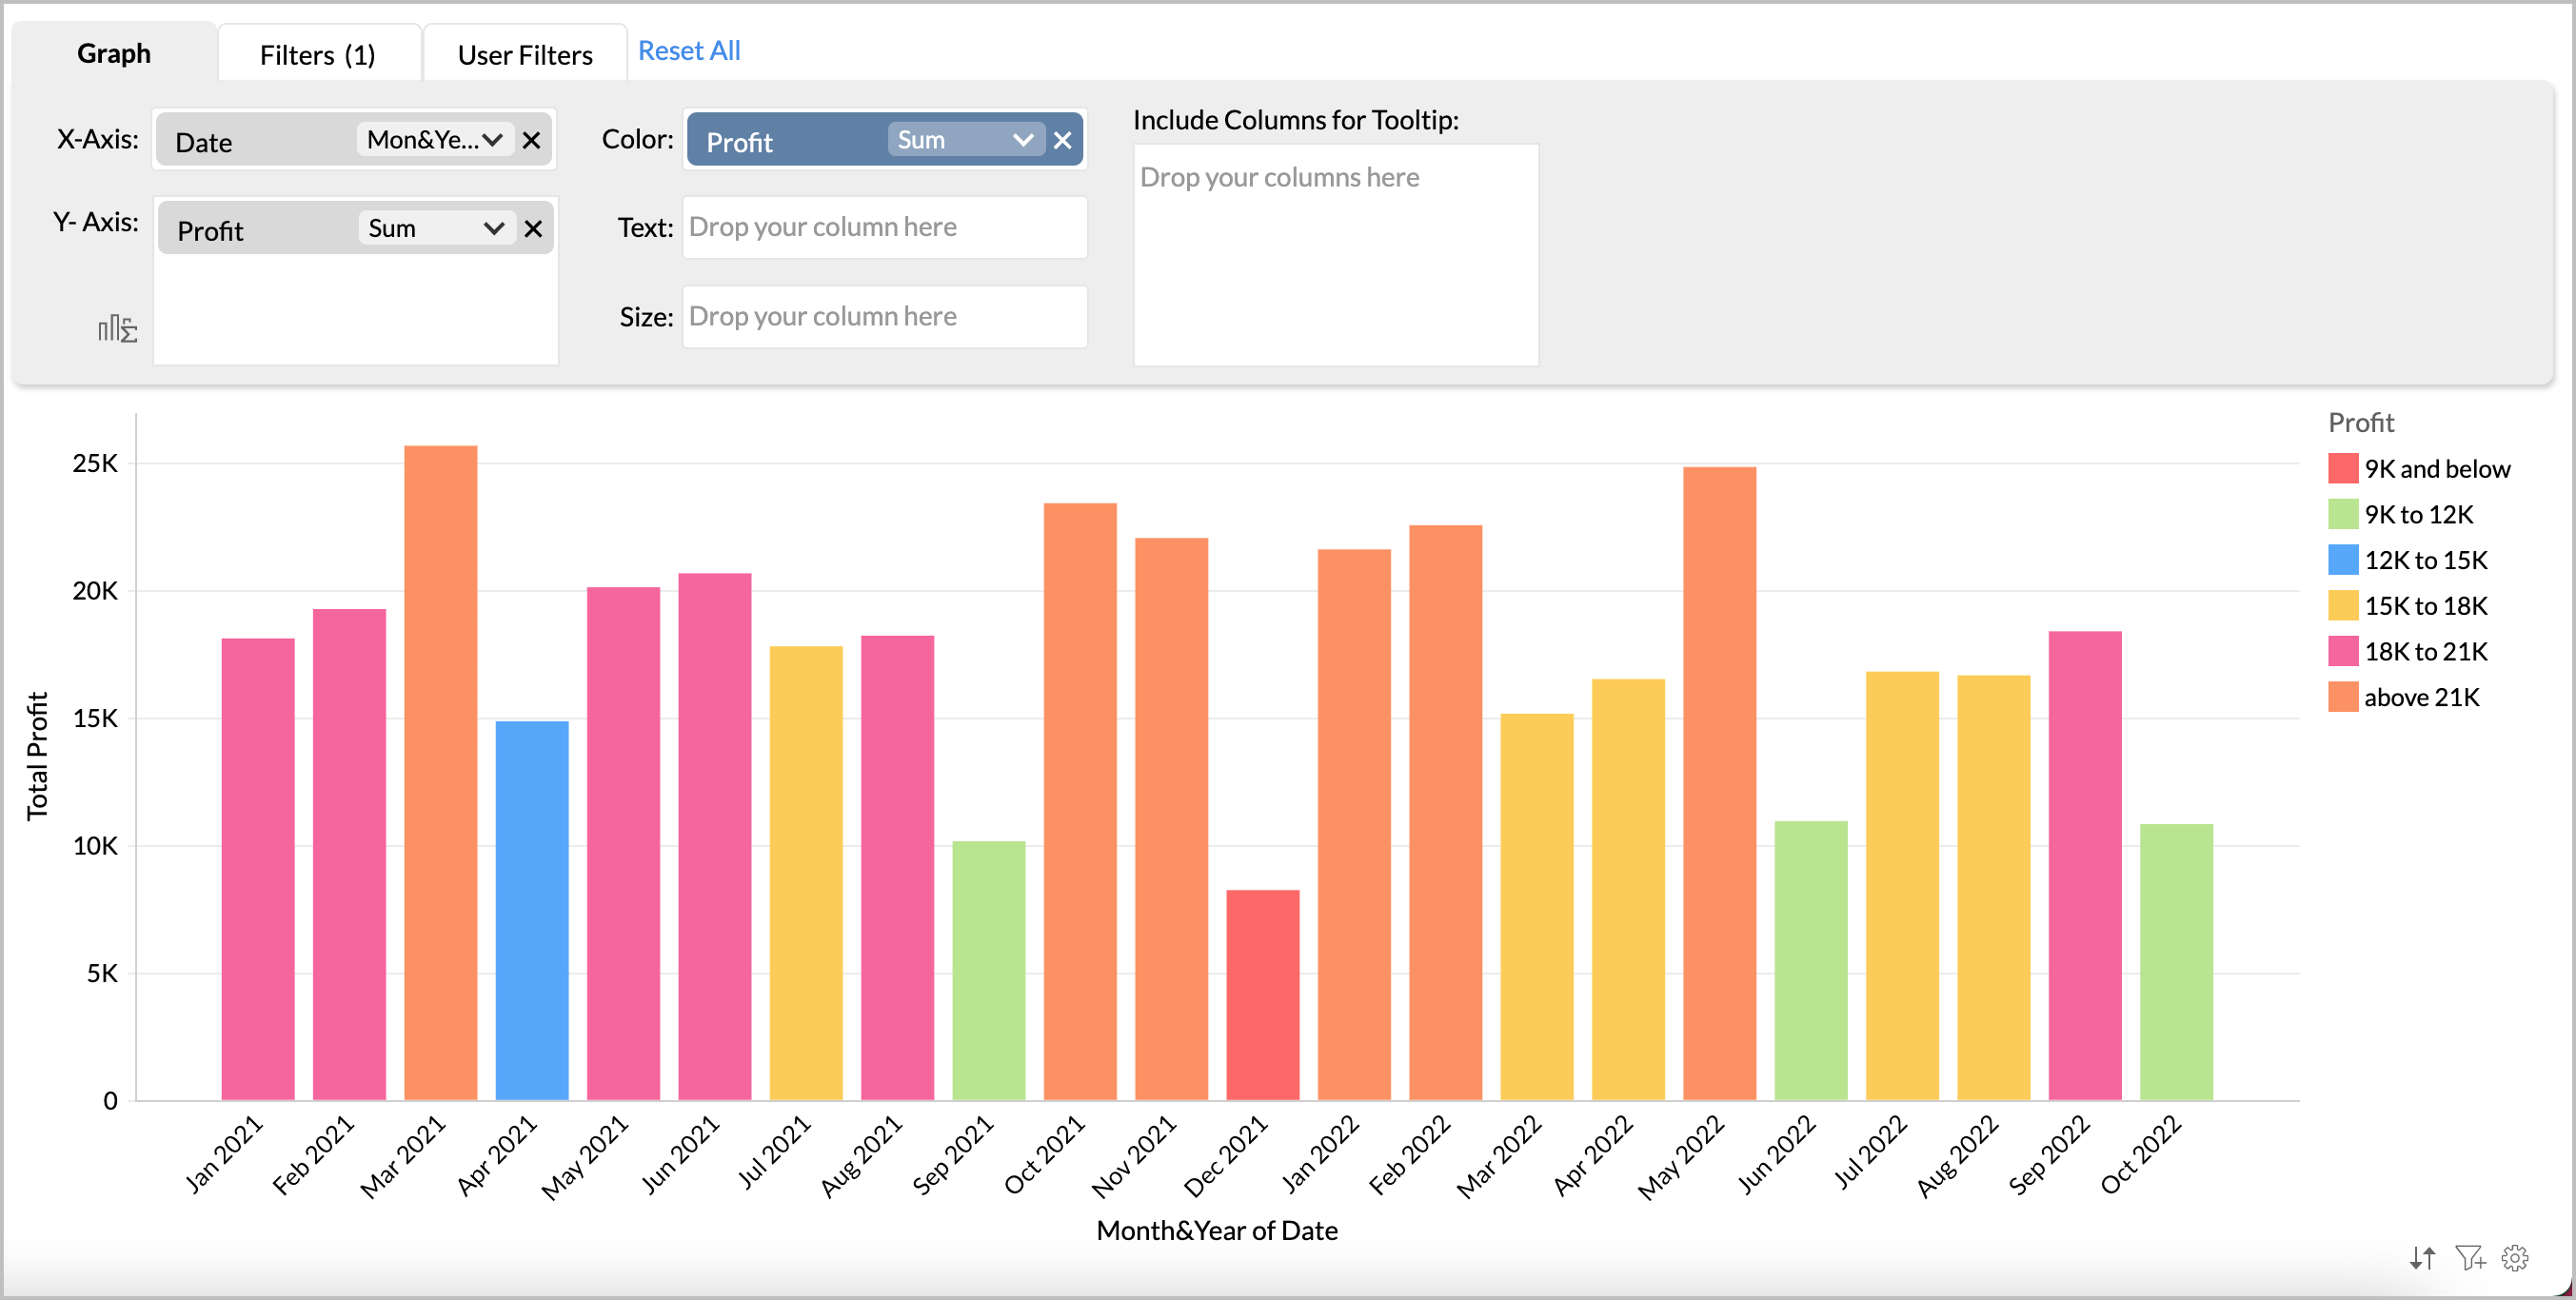
- Zoho Analytics will intelligently identify the pattern in your data to categorize your data into various buckets and apply color over them. You can change this to your own specific conditions using the Settings page.
-
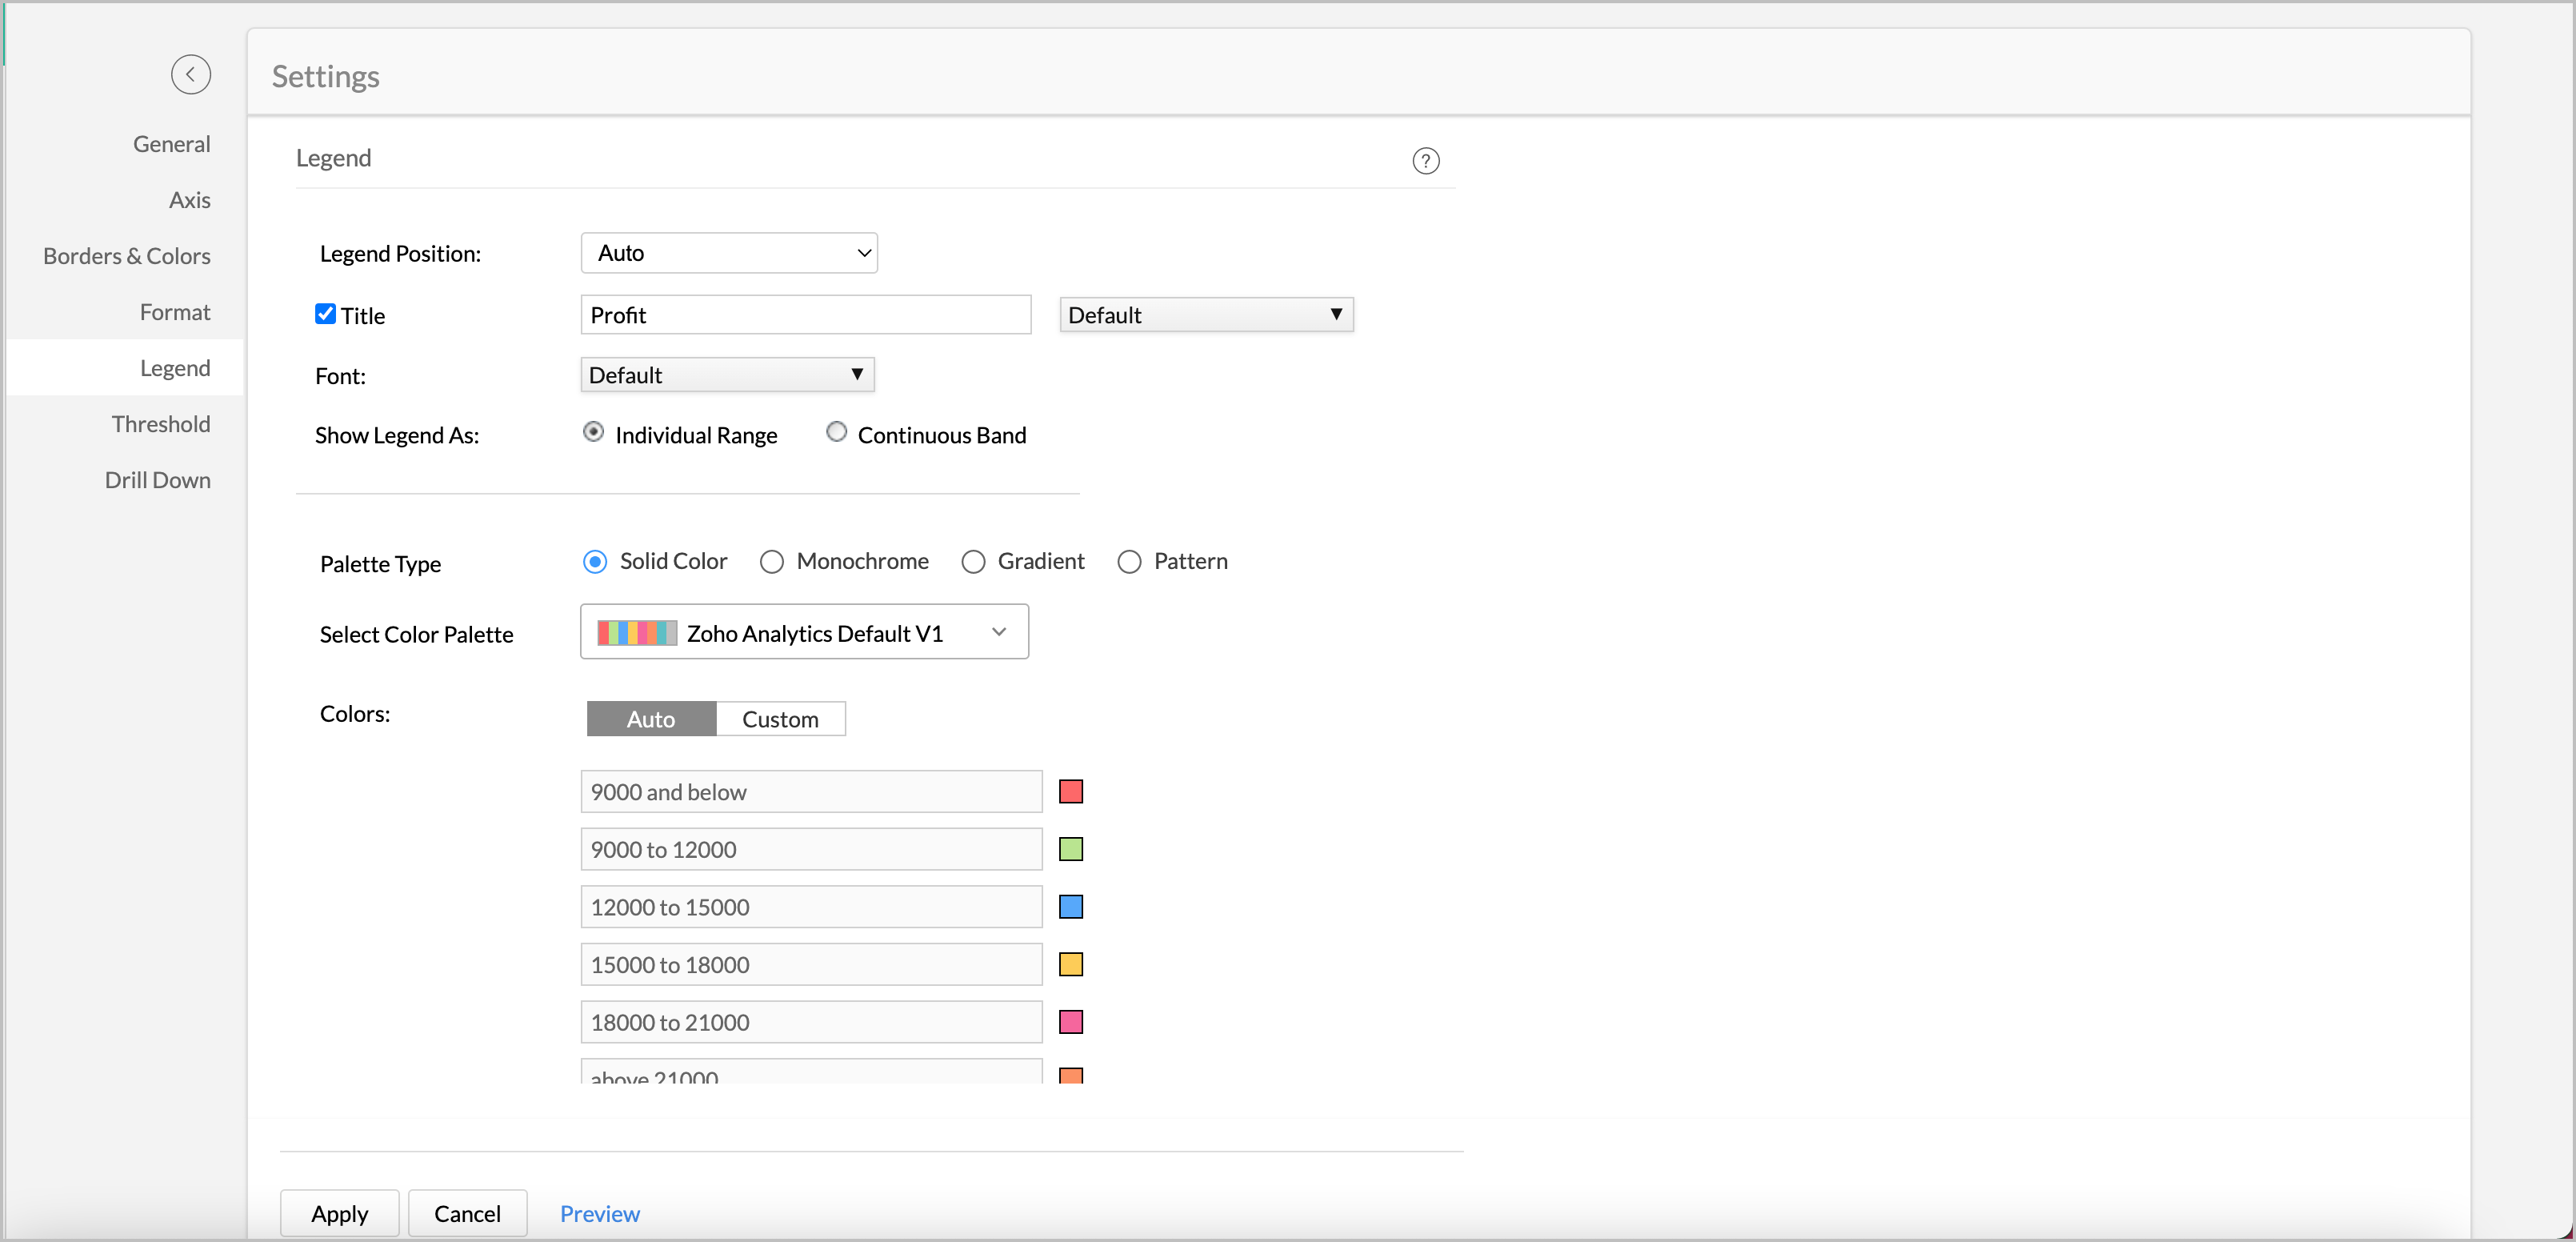
Click the
Setting
icon to open the
Settings
page and navigate to the
Legend
tab.
-
In the
Color
section, click
Custom
.
- Specify the range to format in the Min and the Max field.
-
In the Label field, specify required name for your legends.
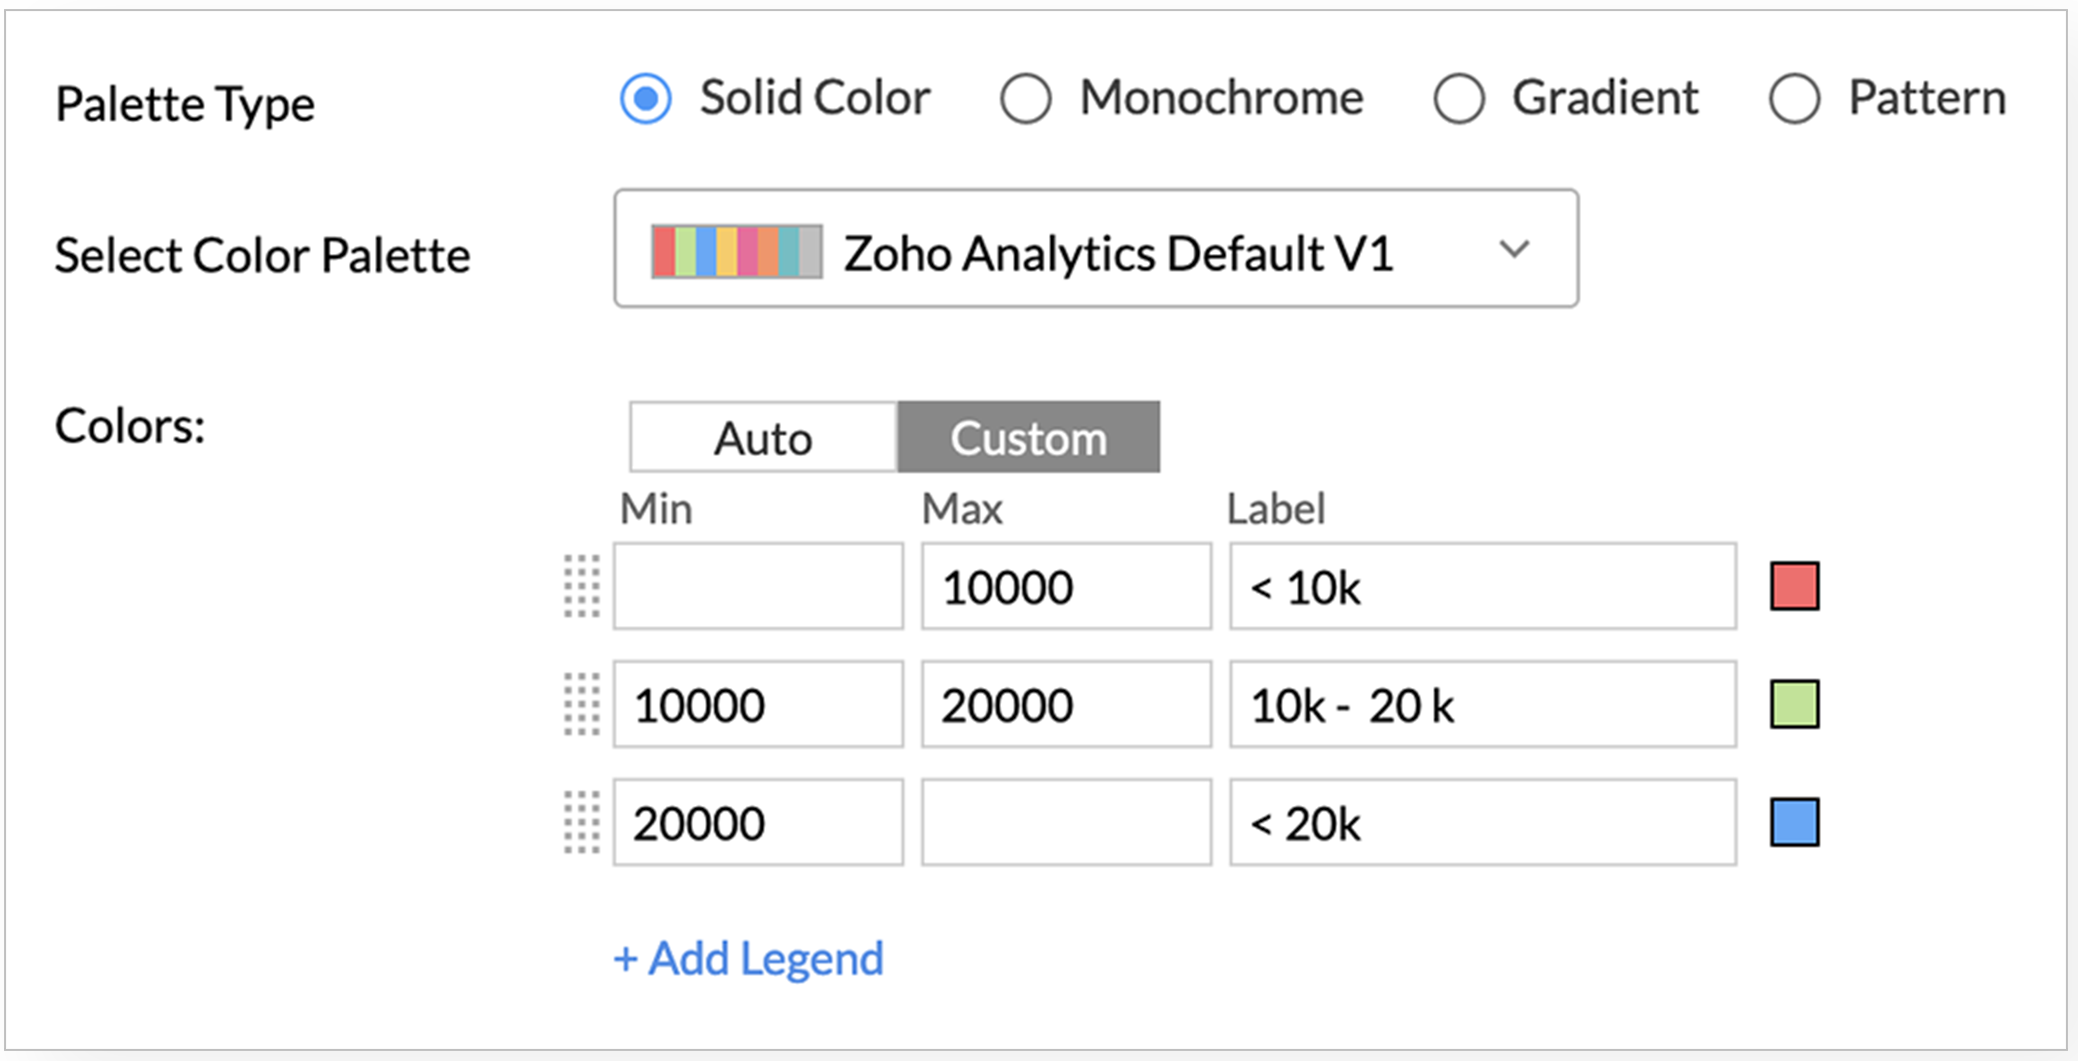
-
Click the
Color
tile to change color.
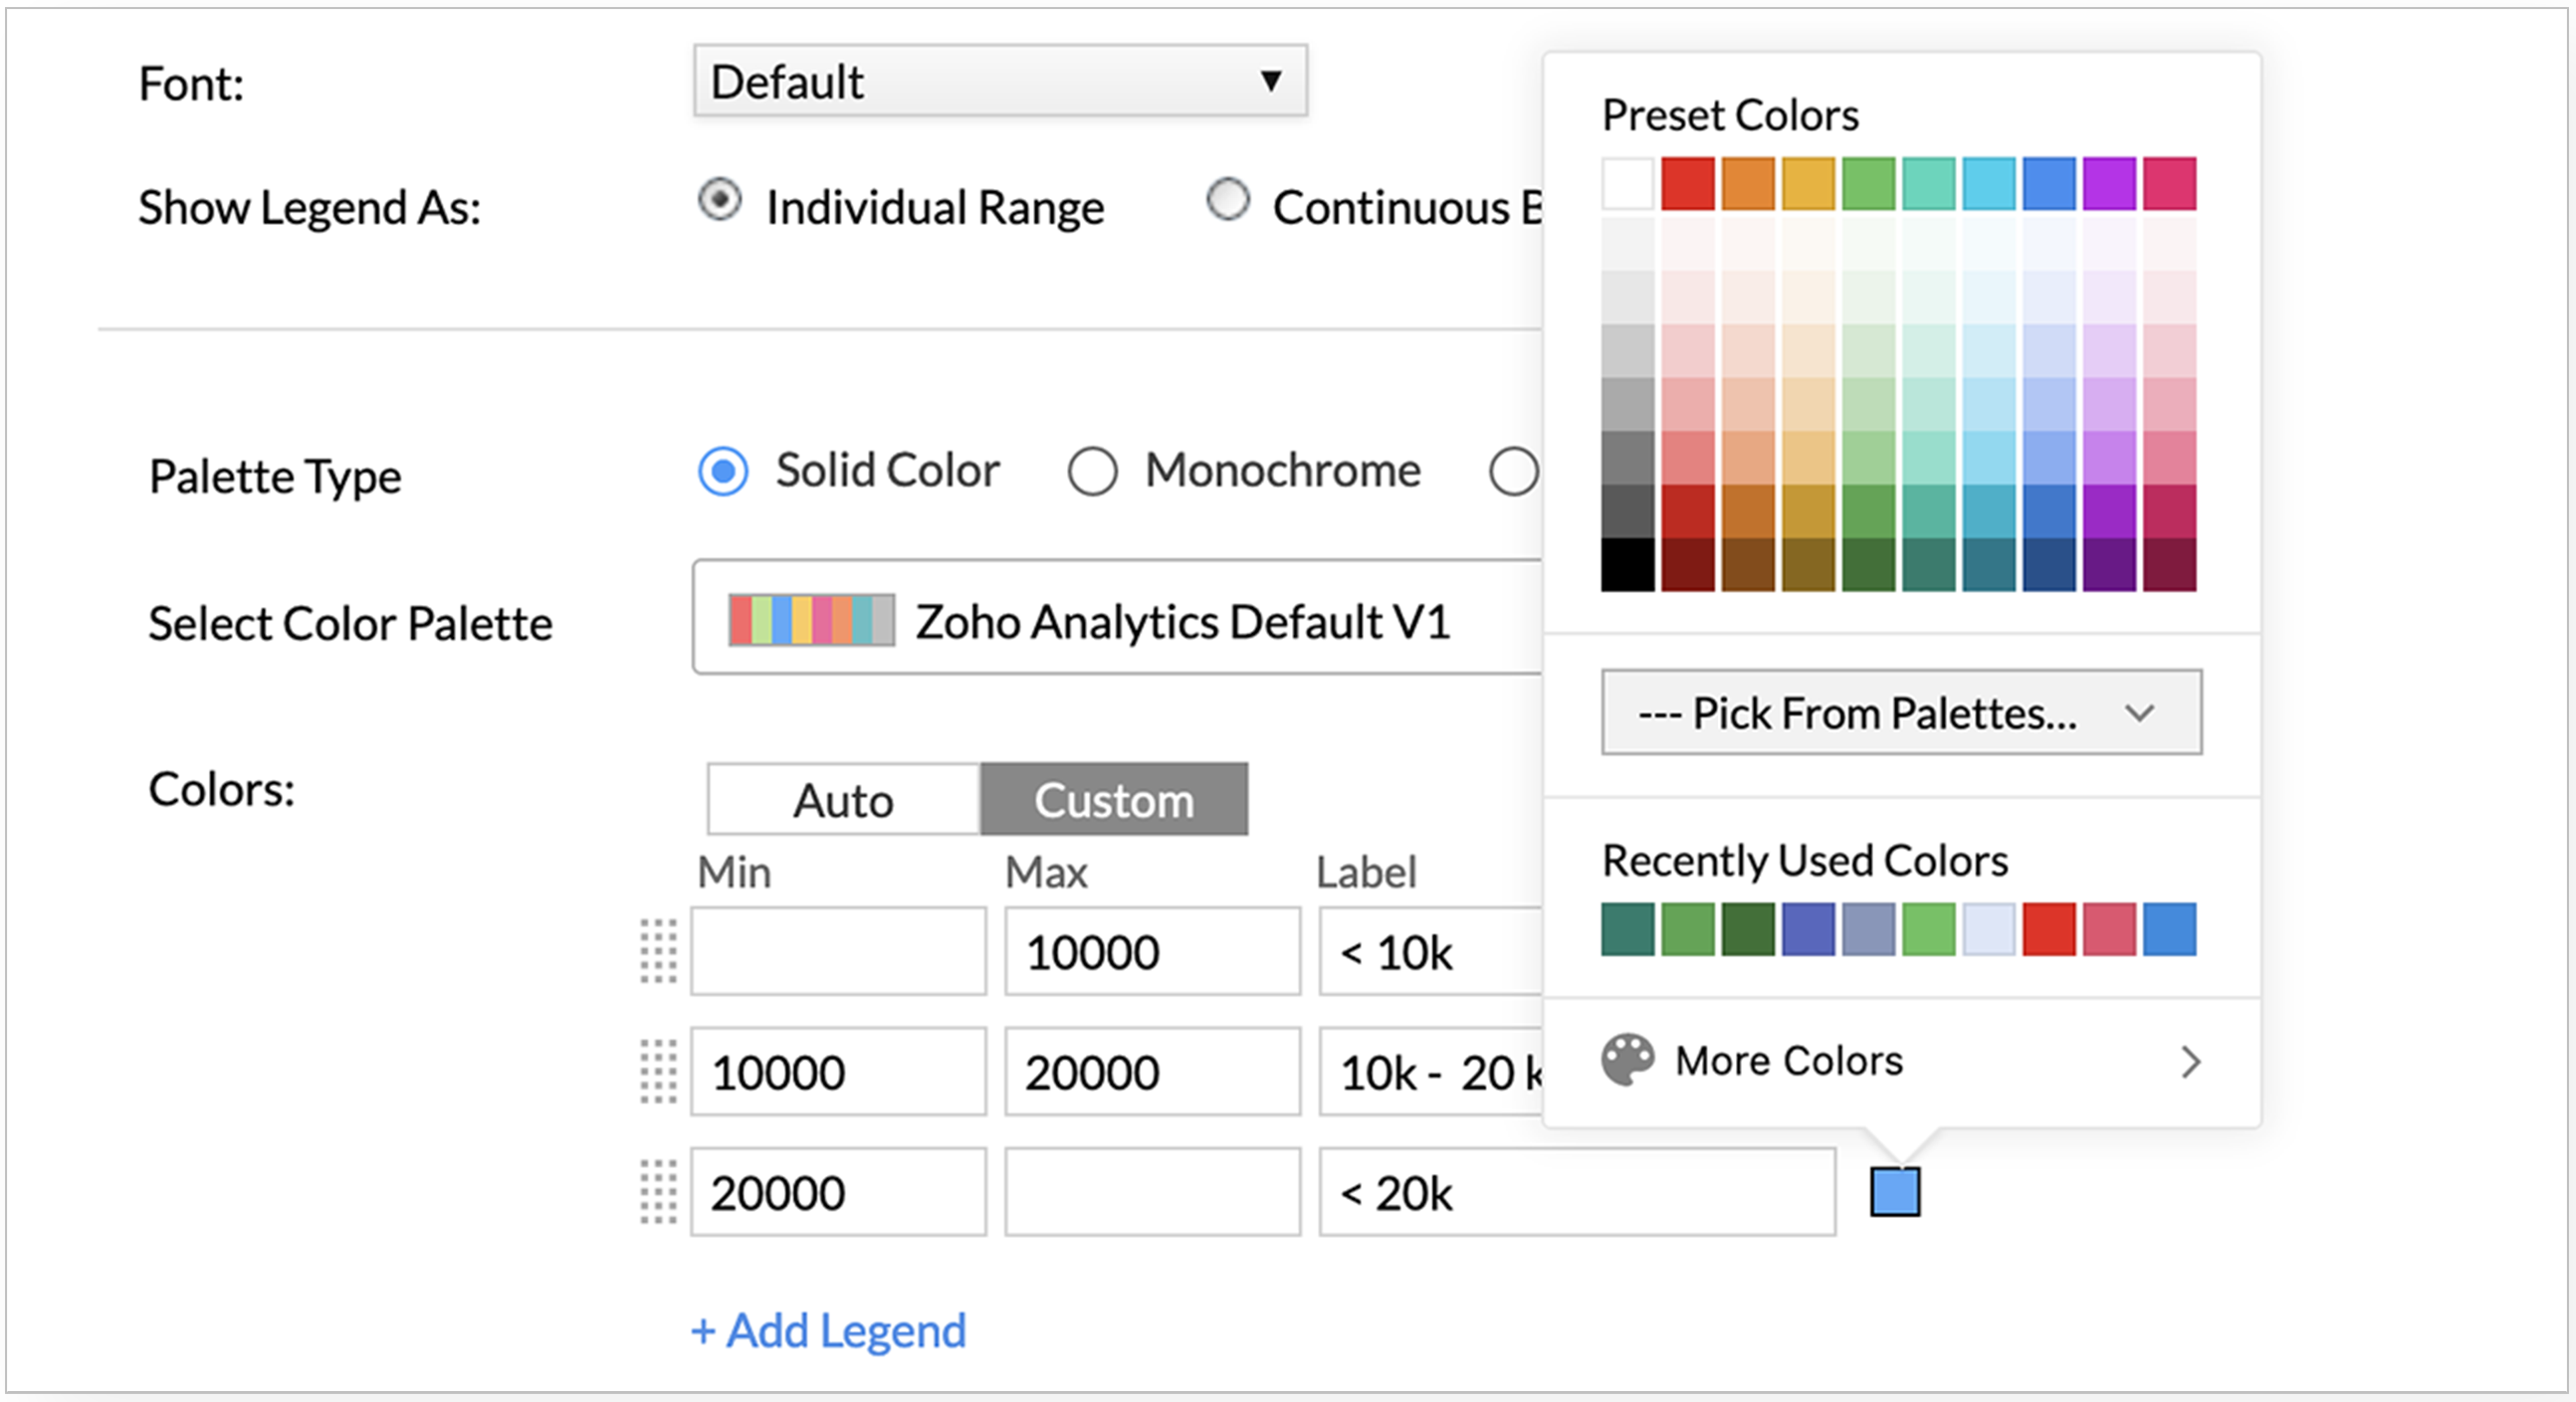
-
Click
Apply
. The chart will be formatted based on the conditions you have specified.
Now we have applied formatting based on a simple condition. Zoho Analytics allows you to format the chart based on advanced conditions using the Formulas .
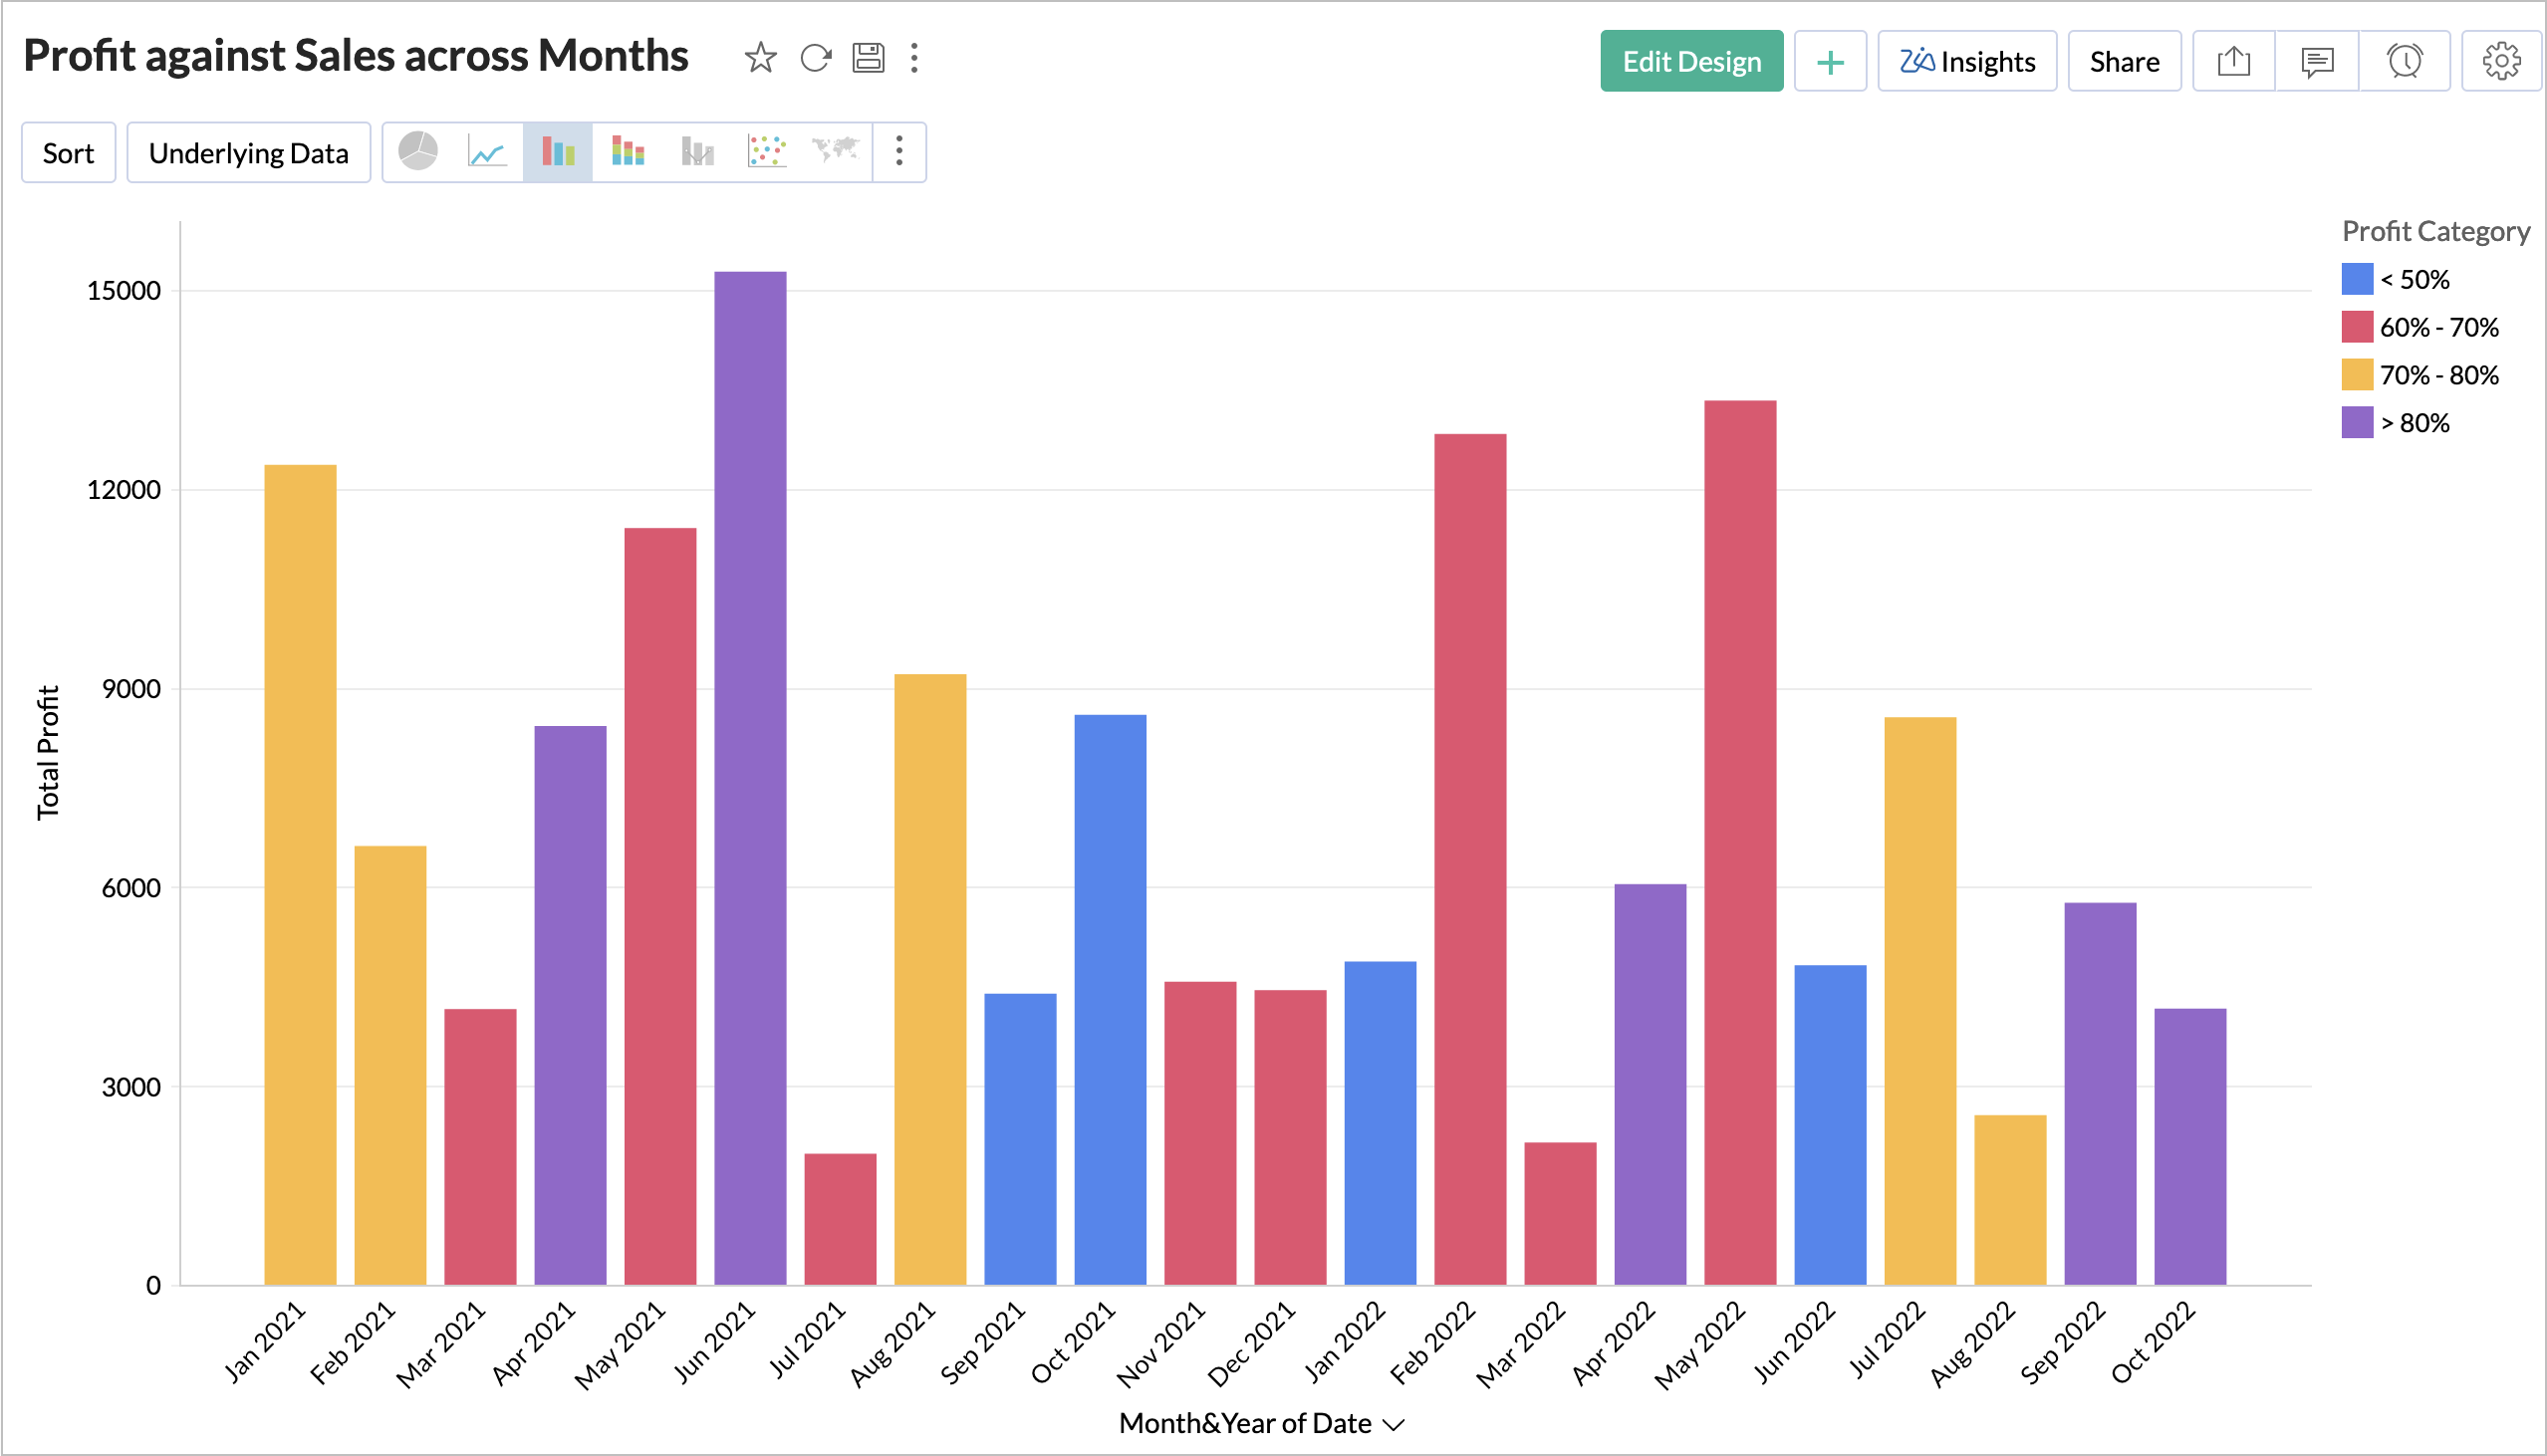
Let's see how to format the same chart by the Profit Percentage based on your sales.
-
Create a formula to calculate the Profit Percentage using the following format.
sum( "Sales"."Profit" )/sum( "Sales"."Sales" )
- Now categorize the profit into groups based on profit percentage. The following formula groups profit into below four groups.
- below 50%
- 50% - 60%
-
60% - 70%
-
Above 70%
if( "Sales"."Profit Percentage" < 0.5,1 , if( "Sales"."Profit Percentage" < 0.6,2, if( "Sales"."Profit Percentage" < 0.7,3,4 )))
-
Now add the
Profit Category
formula in the Color shelf of chart designer.
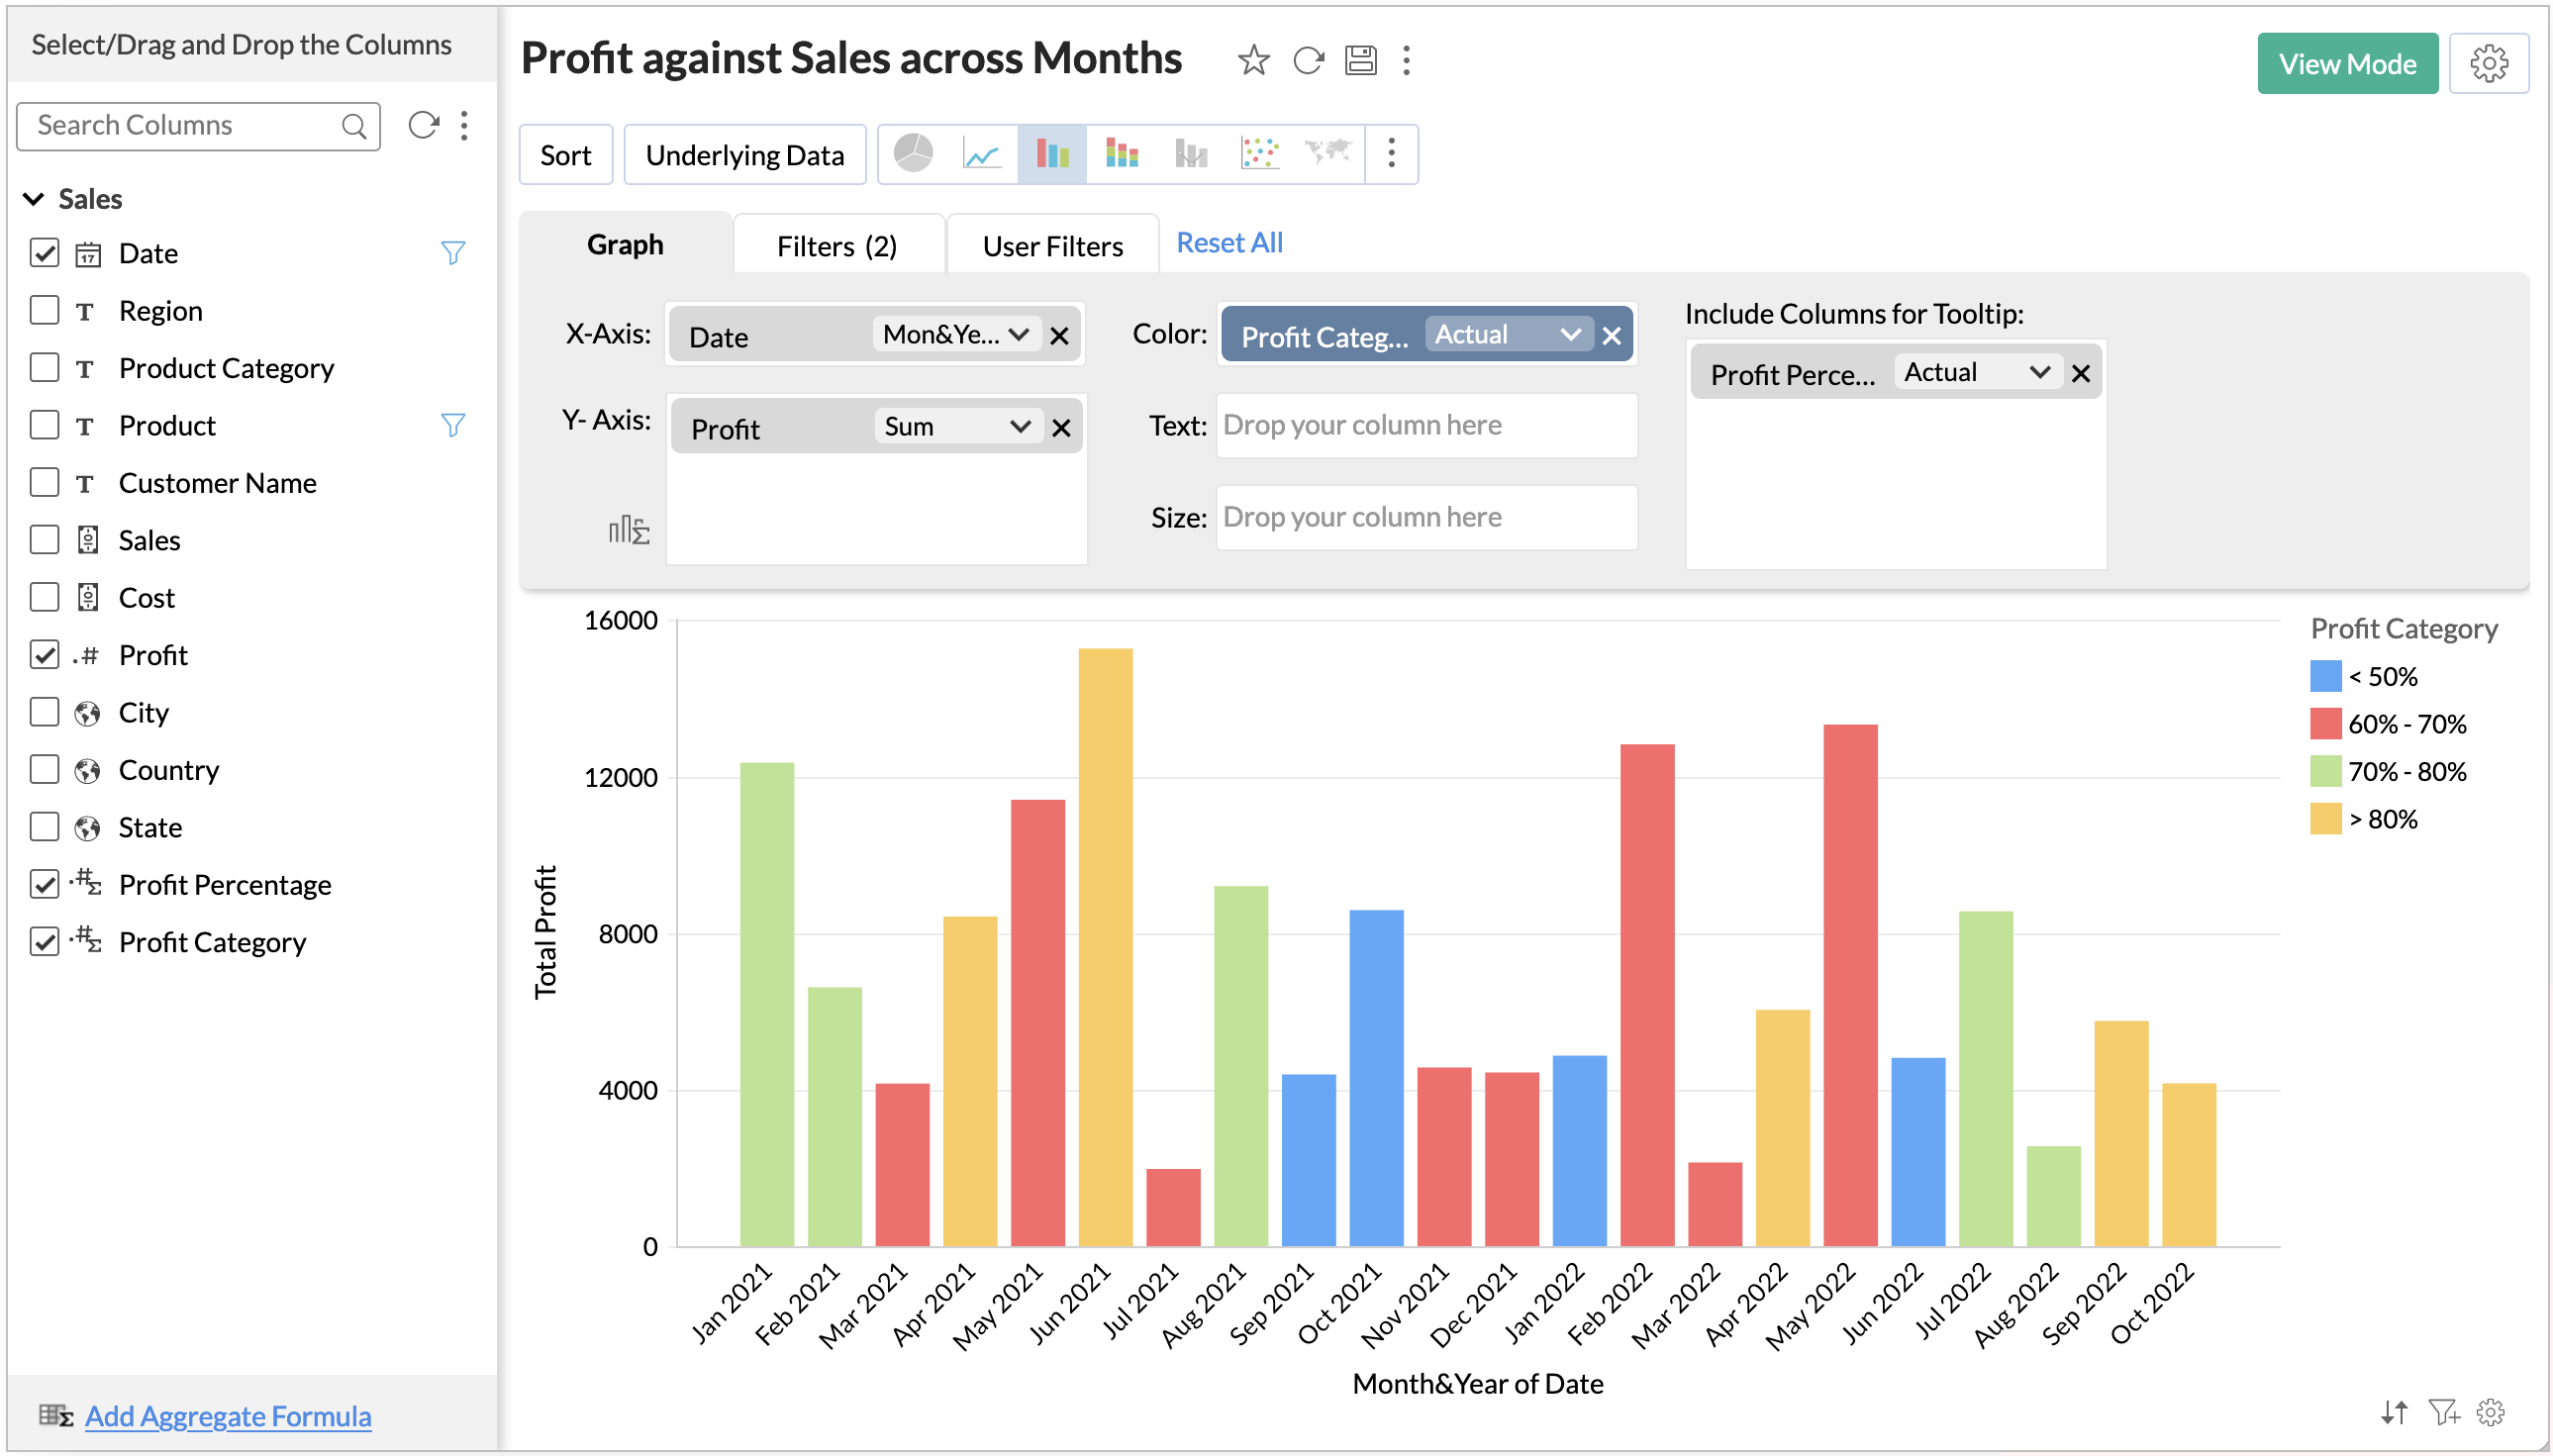
- Open chart settings and customize the Legend.
-
Your final chart is ready.
We believe this will be useful for you. Stay tuned for more nifty tips.
Zoho Campaigns Resources


Topic Participants
Janani Thakshayani
Nora
Ekaterina
Naresh Kumar K K R
Enrico Baumgart
Sticky Posts
What's New in Zoho Analytics - October 2025
Hello Users! We're are back with a fresh set of updates and enhancements to make data analysis faster and more insightful. Take a quick look at what’s new and see how these updates can power up your reports and dashboards. Explore What's New! ExtremeWhat’s New in Zoho Analytics – September 2025
Hello Users!! In this month’s update, we’re raising the bar across multiple touchpoints, from how you bring in data, plan and track projects to how you design and brand your dashboards. We’ve added the all-new Gantt chart for project visualization, expandedAnnouncing Agentic AI - Ask Zia!
We are delighted to roll out the new agentic AI capabilities in Ask Zia, where every stage of the BI workflow is assisted by AI. With a human-in-the-loop approach, Ask Zia ensures that you’re in command of the decision, while AI handles the complexity.Invitation-Based User Access in Zoho Analytics
Hello everyone, We’re rolling out an important update on how users are added to your Zoho Analytics Organization and Workspaces. Previously, when admins added users, they were automatically added to the organization. Moving forward, to improve securityZoholics Europe 2025: Your Ultimate Data Analysis (Zoho Analytics) Workshop Experience
Why should you attend? This year, Zoholics Europe 2025 is putting data analysis centre stage. With a dedicated workshop designed to answer all your data-related questions, you’ll gain practical skills, real-time solutions, and expert insights that you
Zoho CRM Plus Resources
Zoho Books Resources
Zoho Subscriptions Resources
Zoho Projects Resources
Zoho Sprints Resources
Zoho Orchestly Resources
Zoho Creator Resources
Zoho WorkDrive Resources


Zoho CRM Resources
Get Started. Write Away!
Writer is a powerful online word processor, designed for collaborative work.
-
オンラインヘルプ
-
Webセミナー
-
機能活用動画
-
よくある質問
-
Ebook
-
-
Zoho Campaigns
- Zoho サービスのWebセミナー
その他のサービス コンテンツ
ご検討中の方
Recent Topics
SOME FEATURES ARE NOT IN THE ZOHO SHEET IN COMPARISION TO ZOHO SHEET
TO ZOHO sir/maam with due to respect i want to say that i am using ZOHO tool which is spreadsheet i want to say that some features are not there in zoho sheet as comparison to MS EXCEL like advance filter and other Features which should be there in ZOHOZoho sheet for desktop
Hi is zoho sheets available for desktop version for windowsTip #18: 6 Trendlines and when to use them in your spreadsheet data?
Charts are a great tool for visualizing and interpreting large chunks of data in spreadsheets. Zoho Sheet offers you 35+ chart options, along with AI-powered chart recommendations based on the data set you select. There are various chart elements thatPerform customized calculations with the new LAMBDA functions!
We released the LAMBDA function in Zoho Sheet in 2021, enabling customized calculations inside predefined functions. Now, we're extending LAMBDA's capabilities with six new functions. Each of these functions applies LAMBDA to the given input, performsNo chat option
Chat option is not supported.Tip #17: Easily share spreadsheets with non-Zoho account users
With efficient, collaboration-friendly options, Zoho Sheet is a popular choice among users. Sheet's external share links help you collaborate more effectively by sharing your spreadsheets with anyone outside your organization, including users who do notWork seamlessly with Sheet's shortcuts without affecting the browser
Navigating your worksheets and performing specific actions should be a quick and easy process. That's where keyboard shortcuts come in. Shortcut keys help you accomplish tasks more efficiently, eliminating the need to move away from the keyboard. WhatZoho Sheet for iPad: Improved UI, external keyboard support, and more!
The portability and capabilities of the iPad have made it an essential device in the business world. With this in mind, we had launched an exclusive Zoho Sheet app for iPad, with device-specific improvements and enhanced usability. Now, we're improvingThe new Zoho Sheet for Android: Seamless UI and advanced features
At Zoho Sheet, we know mobile apps have become the go-to platforms for creating, sharing, and storing information. And we understand the importance of an efficient and seamless app experience. We've been working hard on improving the overall user experienceZia in Zoho Sheet now makes suggestions on conditional formats, picklists, and checkboxes
Zia, Zoho's popular AI assistant, has been helping users succeed across Zoho applications since inception. In Zoho Sheet, Zia helps users efficiently build reports and analyze data with recommendations about data cleaning, charts, and pivot table. Also,VBA attached to button no longer works on external shared sheet
Hi - we have a Sheet that our clients use, which requires them to press a button once they've entered data. The button then triggers a flow via a webhook. The button works fine when editing within Zoho Sheet - however when shared externally it no longercan I use zoho sheet for survey?
Hi I wanna use zoho sheet for my ARY to know consumer better so i wanna have permission to do soHow to Avoid Impacting Other Users When Hiding Columns in Zoho Sheet
Hi Team, We’re experiencing a challenge with the column-hiding feature on Zoho Sheet during collaborative sessions. When one user hides a column, it becomes hidden for all users working on the file, which disrupts others' workflows. In comparison, ExcelWhat are the benefits of procurement software in a growing business setup?
I’ve been exploring tools that can help automate purchasing and vendor-related tasks. I keep hearing about the benefits of procurement software, especially for businesses that are scaling. I want to understand how it helps in streamlining operations,Object required error
Hi, I am getting an 'Object required' error on the line Call HideColumnsOutsideRange(ws, startOfWeek, endOfWeek) when I run the ShowCurrentWeek macro but not when I run the ShowCurrentMonth macro. Any ideas? Regards, GW Option Explicit Sub HideColumnsOutsideRange(wsWhat formula to use in computing total hrs and decimal hrss
So , my data includes log im column , 2 breaks with 2 columns that says back and lunch and 1 column that says back and logged out. What formula should i use to be able to automatically have my total hours as I input time in each column? ThankyouReplacing email ID,
In zoho sheets If I am sending it as an email attachments can I replace sender email ID from notifications to my email ID.Latest Enhancements and Bug Fixes in Zoho Meeting
Hello there, We hope you're doing well. The latest updates from Zoho Meeting include enhancements like adding names for instant meetings, renaming participants, enabling text notifications for participant entry/exit, viewing details of bandwidth optimization,Multi-video feed in webinars, custom domain options, and our integration with MS Outlook
Hi there, We hope you're doing well. With your help, we have been able to release many useful features and enhancements in 2020. We, the Zoho Meeting team, would like to thank you all for the feedback, support, and encouragement you've given as we workedAdd co-hosts in meetings, manage webinar registration and other enhancements
Hello all, This month's updates allow you to add co-hosts while scheduling meetings. You can also control your webinar registrations better by allowing or blocking registrations from the domain or country of your choice. Read on to learn more. MeetingA new UI for distraction-free engagement in online meetings and webinars that scale up for 3000 attendees
Hello all, We're excited to share our new, refined UI for online meetings. Here's how the new UI will improve your experience during online meetings: We've re-designed Zoho Meeting's online meeting UI to enable users to fully engage in conversationsDirect “Add to Google Calendar” Option in Zoho Meeting
Hello Zoho Meeting Team, Hope you are doing well. We would like to request an enhancement related to the “Add to Calendar” functionality in Zoho Meeting. Currently, when we open Zoho Meeting and view our meetings under My Calendar, there is an Add toI Can't Clone Webinar that I Co-Organize
How do i get our account admin to give me permission to clone our webinars? I am a co-organizerLatest updates in Zoho Meeting | Calendar view, Zia integration with OpenAI, edit the recurring pattern in a recurring meeting, device error notifications revamp, and more.
Hello everyone, We’re glad to share a few updates and enhancements in Zoho Meeting, including the Calendar view, being able to edit the recurring pattern in a recurring meeting, revamped device error notifications, and other enhancements that you’ll findNew enhancements in the latest version of the Zoho Meeting Android mobile app.
Hello all, In the latest version of Zoho meeting Android mobile app (v2.2.6), we have brought in support for the below enhancements. Close account: Now users will be able to close their Zoho account directly from the app. Unmute toast message: If a userShare material, Lock Meeting and revamped feedback UI in the latest version of the Meeting iOS app.
Hello all, In the latest version of the Zoho Meeting iOS mobile app (v1.6), we have brought in the below enhancements. Share material in meeting: We have introduced share material during meeting that allows participants to view supported materials suchLatest updates in Zoho Meeting | New chat feature between an organizer and co-organizer in webinars, recording consent for webinar co-organizers and attendees in the Android app, and more.
Hello everyone, We’re excited to share a few updates for Zoho Meeting. Here's what we've been working on lately: A new chat feature between an organizer and co-organizer in webinars, recording consent for webinar co-organizers and attendees in the AndroidLatest updates in Zoho Meeting | A new Files tab to manage all your PDFs, PPTs, Video files and recordings, live transcription , ability to lock settings and adaptive echo cancellation.
Hello everyone, We’re excited to share a few updates for Zoho Meeting. Here's what we've been working on lately: A new Files tab to manage all your PDFs, PPTs, Video files and recordings, live transcription during sessions, ability to lock settings andLatest updates in Zoho Meeting | Meeting Rooms , Pin video feeds and customize from and reply-to email addresses
Hello everyone, We’re excited to share a few updates for Zoho Meeting. Here's what we've been working on lately: Introducing Zoho Meeting Rooms, an immersive solution for teams to connect over virtual meetings in video conference rooms. You can also pinLatest updates in Zoho Meeting | New top bar video layout, a revamp of our in-session settings and now import webinar registrations with a CSV file
Hello everyone, We’re excited to share a few updates for Zoho Meeting. Here's are some of them : We have moved audio, video, virtual background and preferences under a single settings pop-up for better user navigation. You can now upload a CSV file containingImportant update: Changes in email sender policies
Hello, This is to announce important changes to email sender policies from Google that may impact your use of Zoho Meeting. Restriction on public domains Effective February 1, 2024, Google is implementing policies that will affect the configuration ofCamera access
My picture doesn't appear in a group discussion. (The audio is fine.) The guide says "Click the lock icon on address bar," but I can't find it. Advise, pleaseChat for webinar session, schedule meeting session for 24 hours - Zoho Meeting iOS app update
Hello, everyone! In the most recent iOS version of the Zoho Meeting app, we have introduced the chat functionality for the webinar session. To access this feature, the Organizer should have the 'Public chat' option enabled on the Zoho Meeting desktopInvoice Copy 2005116990189
Please provide the invoice for the trancaction 2005116990189Darshan Hiranandani About
Hi, I’m Darshan Hiranandani, a dedicated software developer with a strong passion for creating efficient and user-friendly applications. With a degree in Computer Science and several years of experience in the tech industry, I specialize in full-stackLatest update in Zoho Meeting | On-demand webinars
Hello everyone, We’re excited to introduce our new on-demand webinar feature, you can now provide pre-recorded sessions that your audience can access immediately, no need to wait for scheduled sessions. Benefits of On-demand webinars : Scheduling flexibilityZoho Meeting iOS app update - Join breakout rooms, access polls, paste links and join sessions, in session host controls
Hello, everyone! In the latest iOS version(v1.7) of the Zoho Meeting app, we have brought in support for the following features: Polls in meeting session Join Breakout rooms Paste link in join meeting screen Foreign time zone in the meeting details screen.Zoho Meeting app update.
Hello, everyone! In the latest Android (v2.3.7) and iOS (v1.7.1) versions of the Zoho Meeting app, we have brought in support for the following features: Report Abuse option. WorkDrive integration. Report Abuse option You can now report to us any deceptiveZoho Meeting Android app update - v2.4.0
Hello everyone! We are excited to announce that we have brought in support for the following features in the latest version of the Zoho Meeting Android app(v2.4.0): 1. Start Personal Meeting Rooms 2. Revamp of the schedule meeting screen and meeting detailsIntroducing Zoho Desk integration and a few minor enhancements
Zoho Desk Integration We've now introduced an integration between Zoho Meeting and Zoho Desk to efficiently manage meeting-related customer inquiries. With this integration, you can track, respond to, and resolve meeting-related tickets directly fromNext Page