Waterfall
Overview
The Waterfall component is a dynamic visualization tool that helps you understand how a starting value changes over time or across categories due to a sequence of positive and negative contributions. Unlike traditional column charts that display individual values in isolation, the Waterfall chart focuses on cumulative impact—highlighting how each step moves the total upward or downward.
This makes it especially useful for analyzing processes like revenue breakdowns, expense tracking, or any scenario where understanding the net change from a series of contributing factors is essential. By visualizing both increases and decreases in a single flow, the Waterfall component enables you to clearly identify where value is added or lost, empowering better insights and more informed decisions.
Let's say you’re tracking revenue fluctuations, monitoring process efficiencies, or forecasting future trends; a waterfall component will offer a clear, intuitive way to understand the dynamics of your data.
Let’s say you want to understand how your total subscriber count is impacted by different subscription status. A Waterfall component that shows the number of subscribers across statuses like Active, Trial, Upgraded, Churned, and Expired gives you a clear idea of the total subscription.
For example, you might see that while Active and Trial users drive major gains, losses from Churned and Expired users reduce the net total. This helps you identify how much total value is effected by churned and expired subscriptions and whether it needs attention to retain or recover subscriptions.

Feature Availability
Available for Enterprise and editions editions of Zoho CRM.
Variants
Basic
Cumulative
Breakdown
Projection
Basic
Visualizes categorical changes where each stage is assigned as either a positive (adding) or negative (reducing) factor. The final bar represents the net result after accounting for all additions and subtractions.
Useful for cases where predefined picklist values represent distinct stages, such as sales stages or process steps.
Let’s say you want to understand how revenue accumulates or drops across different stages in your sales pipeline. A Waterfall component showing the revenue by stage helps you track how each stage contributes to—or reduces—the overall revenue.
For example, you may notice that stages like Qualification, Proposal, and Negotiation add significant value, but stages like Closed Lost and Closed Lost to Competitor pull down the total. This view helps you identify where your pipeline gains most of its value and where you're losing potential revenue.
Cumulative
Focuses on tracking cumulative changes over time. Users can optionally enable intermediate sums (quarterly, yearly) for better clarity. The final bar represents the total cumulative value at the end of the period.
Useful for scenarios where values accumulate over time—such as monthly profits, expenses, or revenue trends—making it easier to track growth, fluctuations, and periodic performance.
Let’s say you want to monitor how profit has grown or declined over time. A Cumulative Waterfall that shows profit across months, with quarterly intermediate sums, helps you track month-over-month changes and quarterly performance in one view.
For instance, while you may see steady growth in Q1 and Q4, Q2 and Q3 show noticeable dips in specific months like May and October. This helps you quickly spot which months drove growth, which pulled performance down, and how each quarter contributed to your overall profit.
Breakdown
The Breakdown variant is similar to Cumulative but provides a more granular view by breaking down each time period into different segments based on the business requirements.
It's useful for tracking various subcategories within each time period — the breakdown is among the picklist options like product type, regions, etc. even though the grouping is a time-related field.
Let’s say you want to compare product-wise subscription trends over the past few years. A Breakdown Waterfall component showing the product wise subscriptions across the year and broken down by product category gives you a clear picture of which product lines grew or declined year over year.
For instance, you might find that Mobile subscriptions dropped sharply in 2022, while Tabs showed consistent growth across all three years. This helps you evaluate product performance within each time period and understand what’s driving your overall subscription trend.
Projection
Perfect for financial forecasting and scenario planning, this variant starts with a user-defined initial value and tracks incremental changes over time. The initial bar’s value can be set as "All Time" (historical total) or "Previous Period" (last period’s final value). The final bar will show the total after incorporating all positive and negative changes over time.
It is ideal for scenarios where past values influence the present and future.
Let’s say you want to visualize how profit is expected to grow across the current year, starting from an initial value. A Projection Waterfall that shows the profit across quarters, with an initial value set from all-time data, helps you track projected gains quarter over quarter.
For example, you might see growth of 4k, 3k, 2k, and 3k in the quarters, building toward a total profit of 15k by year-end. This helps in forecasting quarterly performance and understanding how current trends may shape your overall annual outcome.
Creating a Waterfall component
To create a waterfall component:
1. Navigate to the Analytics module, and select a dashboard.
2. Click Add Component, and select Waterfall.
3. Select the variant based on your requirement.
3.1 for Basic variant
- Provide the Component Name
- Select the Primary Module and the Related Module
- Select the measure for the waterfall.
- Next, select the Grouping field.
Add criteria if needed for the grouping.- Set the objective of the grouping values for the component—same or varied.
- For Same Objective, select whether the groupings should be positive or negative.
- For Varied Objectives, choose between automatic objectives or customize your own objectives by setting positive and negative stages for varied purposes.
3.2 for Cumulative variant
- Provide the Component Name
- Select the Primary Module and the Related Module
- Select the measure for the waterfall.
- Next, select the Grouping field.
Add criteria if needed for the grouping.- Select the intermediate sum, and select the required value from the dropdown.
3.3 for Breakdown variant
- Provide the Component Name
- Select the Primary Module and the Related Module
- Select the measure for the waterfall.
- Next, select the Grouping field.
- Choose the required Breakdown from the dropdown.
Add criteria if needed for the grouping.
3.4 for Projection variant
- Provide the Component Name
- Select the Primary Module and the Related Module
- Select the measure for the waterfall.
- Next, select the Duration — the date/time field and the duration.
- Choose the frequency from the drop-down based on the duration.
- Set additional criteria if required.
- Set the initial value to All Time or Previous Period.
5. Select display as shortened numbers if needed, and choose the format and decimal places.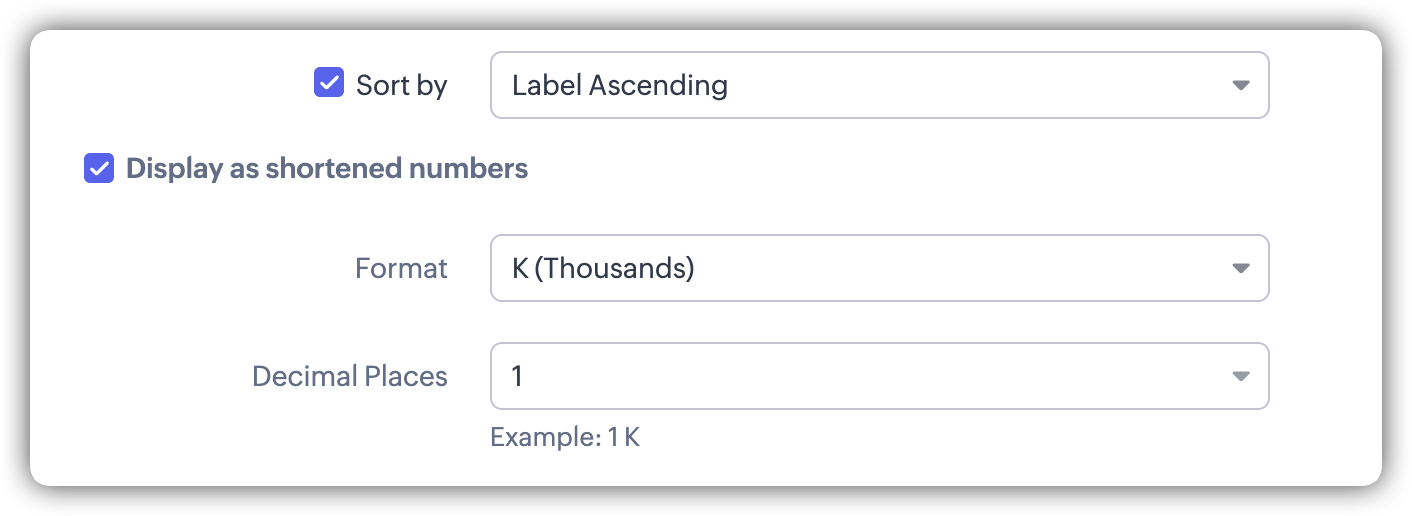 6. Click Save.