Create buckets - Number
The bucketing transformation groups values in multiple ranges or buckets for easier understanding of highly scaled data. The granular details of such data can prevent us from getting a broad view of the data. This form of grouping values in a range not only helps in observing the overall view of the data, but also in finding data patterns.
Bucketing works on the top of the base data types: Number, Text, and Date.
To find bucketing operation:
-
Right-click the column in the Studio page.
-
Select Create Buckets option from the context menu.
Bucketing in a number column
Buckets can be formed in two ways in a numeric column:
Automatic
and
Manual
.
Automatic bucketing
Automatic bucketing creates buckets based on the column data pattern and the number of buckets required.
You can edit this value under the
Number of buckets
option. By default, the automatic bucketing option creates ten buckets.
To apply
Automatic bucketing
in a column:
-
Right-click the column in the Studio page .
-
Select Create Buckets option from the context menu.
-
Give a name to your new column under Base column name.
-
In the Transform panel, the Automatic option In the transforms panel, the Automatic option is selected by default.
-
By default, the value for Number of buckets is ten. You can edit the value as per your requirement.
-
The auto bucketing option groups each value by taking the lowest and the highest values from the column, and divides it by the number of buckets chosen.
-
Preview of the resultant column is shown in the data grid.
-
Click Apply.
Manual bucketing
Manual bucketing requires input from the user, such as the range values and associated conditions.
To apply
Manual bucketing
in a column:
-
Right-click the column in the Studio page.
-
Select the Create Buckets option from the context menu.
-
In the Transform panel, the option Automatic is selected by default. Choose the Manual option.
-
Select one of the bucketing methods.
-
Fixed intervals
-
Custom range
-
Specific values
-
Give a name to your new column under Base column name .
-
Enter the conditions, interval size, and labels as required for the selected bucketing method.
-
A preview of the resultant column will be shown in the data grid.
-
Click Apply .
Fixed intervals
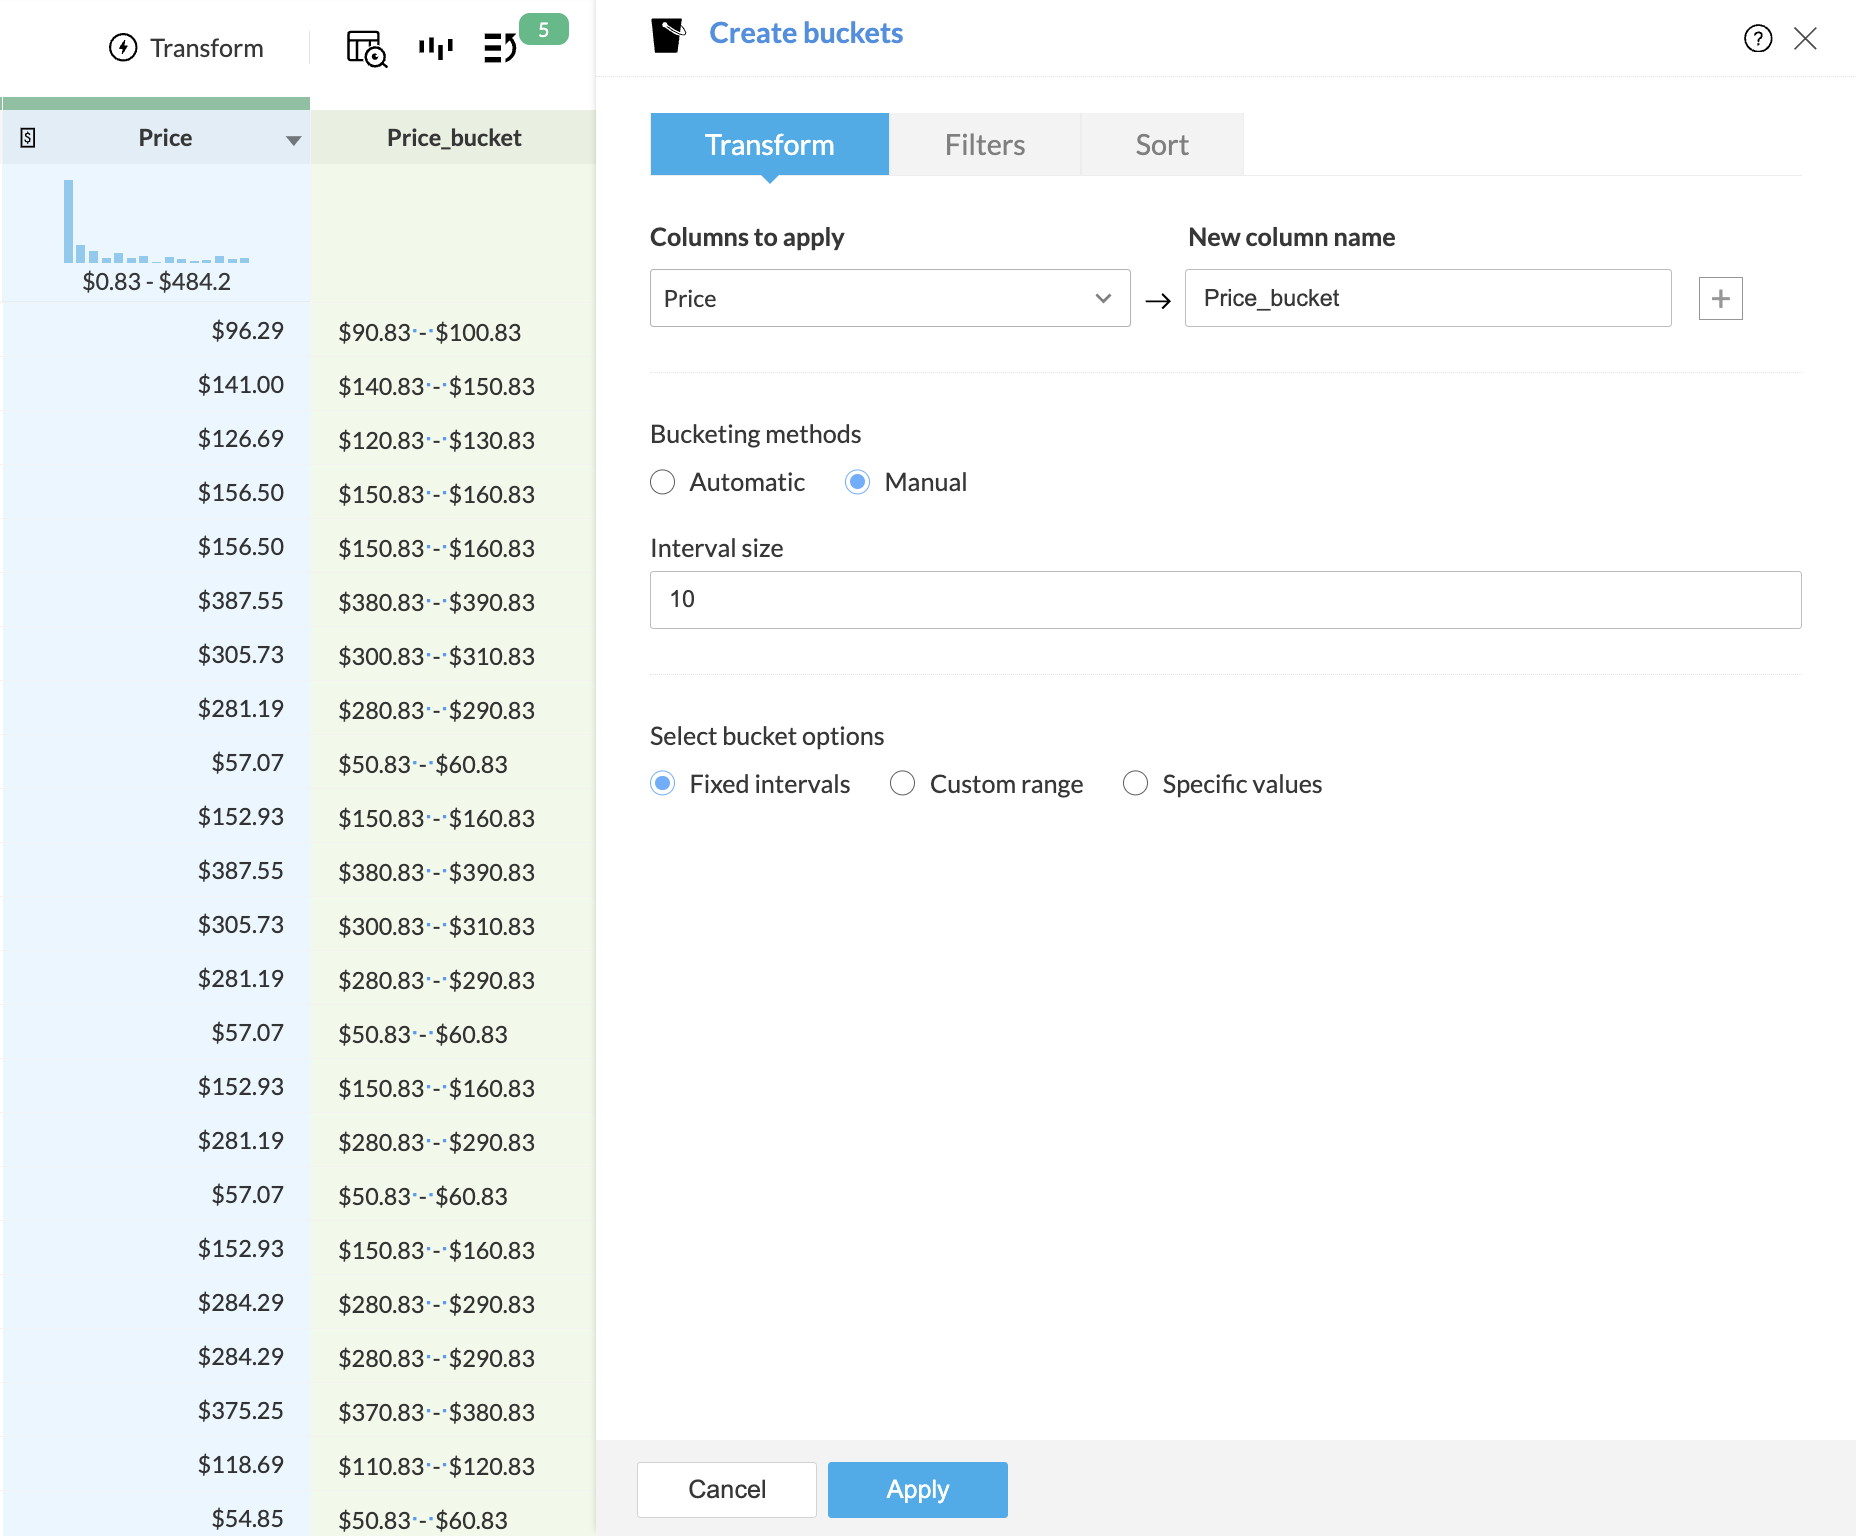
You can input the interval size using the Fixed intervals option.
- For example, if the selected numerical column has data between 0 to 100, and the interval size is given as 10, the created range of intervals i.e. bucket values will be 0-9, 10-19, 20-29, and so on till 90-99.
-
In the newly created column, the bucket values are placed against each value in the selected numerical column that fits in a particular interval.
-
If a numerical column has some invalid data such as text or date values, then the resultant column will have 'NA'.

Custom range
Using the
Custom range,
you can input the conditions to determine bucket labels.
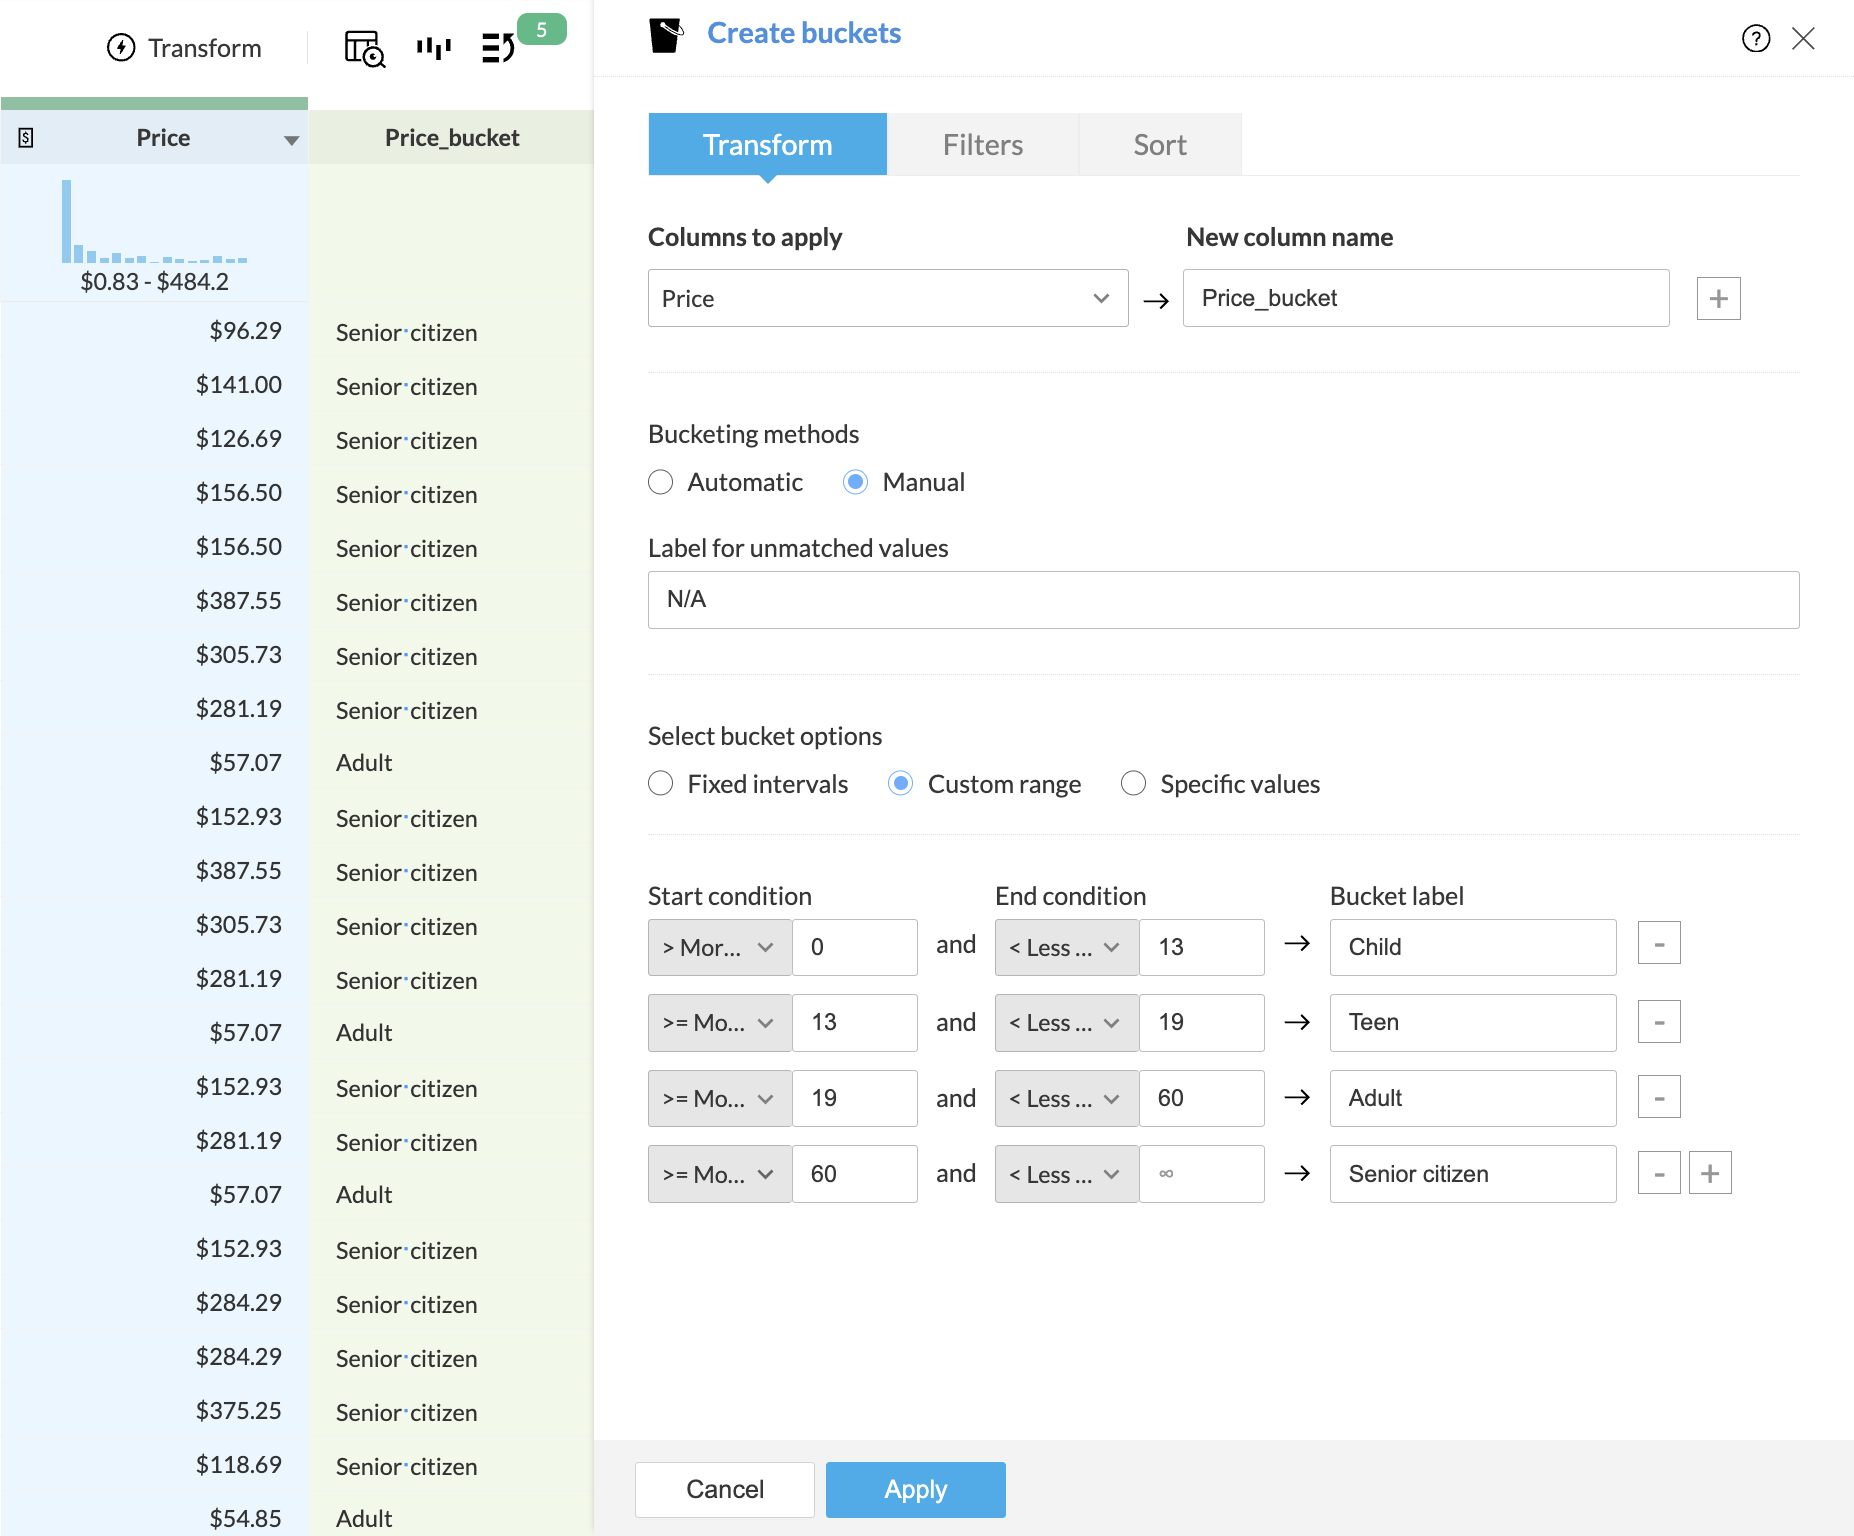
For example, if the numerical column has age data between 0 to 100, you can input the conditions in such a way that more than 0 and less than 13 falls under the bucket label "Child", equal to or more than 13, and less than 19 falls under the label "Teens", more than 19 and less than 60 falls under the label "Adults", and finally, greater than 60 will fall under the label "Senior citizens".
This is accomplished by providing conditions using these comparative operators:
-
Equal to (=), More than (>), More than or equal to (>=), as part of the Start condition , and
-
Less than (<), Less than or equal to (<=), as part of the End condition .
If the selected column has values that won't fit in any condition, it is marked with a separate label 'NA'.
You can edit this label under the
Label for unmatched values
option.
Use the + button to add another condition below the current one, or the - button to delete the current condition.
In the newly created column, the buckets are placed against each value in the selected numerical column that fits in a particular range.

Specific values
Using the
Specific values
option, you can enter specific values from the selected numerical column and label them as a bucket.
For example, if the selected numeric column is "Item code", you can create a new column "Category", and define the condition such that the item codes 101 and 102 fall under the bucket "Books", 200 and 202 fall under the bucket "Magazines", and 300 and 301 fall under the bucket "Pens". You can leave the default label for unmatched values as NA.
The values that were selected inside the "in" conditions will have the appropriate label defined in the new column. The ones that do not match the condition will have the default value: NA.
|
Item
|
Item code
|
Category
|
|
Gandhi's Biography
|
101
|
Books
|
|
Parker Frontier Stainless Steel Roller Ball
|
301
|
Pens
|
|
Startup city India
|
202
|
Magazines
|
|
Murder on the Orient express
|
102
|
Books
|
|
Pens
Coca-cola
|
789
|
N/A
|
To apply filters
If you want to apply some filters along with this transform, you can use the filters functionality.
1. Click the
Filters
tab.
2. Click the
 icon and add the required columns in the
Filters
section. You can also reorder the filters using the drag and drop method.
3. For every column added, you can select one of the following options from the drop-down:
- Actual: This option lets you filter rows based on the actual values in the column. Click here to know more.
- Data quality: This option lets you filter rows based on the quality of data in the column. Click here to know more.
- Patterns: This option helps you filter rows based on the data patterns in the selected column. Click here to know more.
- Outliers: This option allows you to filter rows based on the outliers present in the data of the selected column. Click here to know more.

Note: The filter options are displayed based on the datatype of the column added for the filter.
4. When you add more than one filter to the
Filters
section, the logical operators, AND or OR appear next to the filters. You can click to toggle the logical operator between AND and OR.
-
Using the logical operators, you can combine the conditions and apply logic to determine the rule of precedence. The final expression is displayed in the
Criteria expression
box. You can click
Edit
to alter the default expression using logical operators and parenthesis to specify the precedence or the sequential order as to which condition should be evaluated first. Click
Save
after making the required changes.
- For example, In the expression, ((1 OR 2) AND (3 OR 4)) , at first the condition ( 1 OR 2 ) will be executed and the condition ( 3 OR 4 ) will be executed next. Thirdly, since, the AND operator is used, the filter will be applied when both the conditions are true.
5. You can further drill down to choose specific values based on the filter option selected for each filter, in the next section.
For example, in the above screenshot, the
Data quality
option is selected for the All columns filter in the
Filters
section. Based on the selection, further options to filter specific values are displayed in the
All columns (Data quality)
section.
6. You can choose to include or exclude the selected items in the last section.
7. If you want to remove all the filters for some reason, you can use the
Clear
button.
8. A live preview of the filter transform is shown as you make changes.
9. Click the
Apply
button to apply the transform along with the filters.
To sort data

To sort data
Under the Sort tab, you can sort data in the ascending or descending order based on any column. You can choose the column in the Sort by column drop down and choose the order to be sorted.

You can use this functionality only with the transform and not as a standalone function. However, you can use the Sort transform if you want only to sort data.
SEE ALSO
Zoho CRM Training Programs
Learn how to use the best tools for sales force automation and better customer engagement from Zoho's implementation specialists.
Zoho DataPrep Personalized Demo
If you'd like a personalized walk-through of our data preparation tool, please request a demo and we'll be happy to show you how to get the best out of Zoho DataPrep.
Centralize Knowledge. Transform Learning.
All-in-one knowledge management and training platform for your employees and customers.
New to Zoho Writer?
You are currently viewing the help pages of Qntrl’s earlier version. Click here to view our latest version—Qntrl 3.0's help articles.
Zoho Sheet Resources
Zoho Forms Resources
New to Zoho Sign?
Zoho Sign Resources
New to Zoho TeamInbox?
Zoho TeamInbox Resources
New to Zoho ZeptoMail?
New to Zoho Workerly?
New to Zoho Recruit?
New to Zoho CRM?
New to Zoho Projects?
New to Zoho Sprints?
New to Zoho Assist?
New to Bigin?
Related Articles
Create buckets - Date
You can classify a group of date values or individual dates using the bucketing technique. The bucketing options for a date column are: Weekday or not Month of the year Week of the year Week of the month Day of the year Day of the month Minute of ...Create buckets - Text
You can choose to implement bucketing in a text column using conditions. Consider a situation where you need to assign people to specific teams. You can implement the logic of adding values to a bucket, which in this case is the team name. Name Team ...Create a new pipeline
Pipelines are fundamental entities that allow users to create ETL pipelines / data flows in DataPrep, with multiple data stages and using various flow‑level transforms. You can create a new pipeline from scratch (for your data integration and data ...Import pipeline from .zdpt file
Pipelines are fundamental entities that allow users to create ETL pipelines / data flows in DataPrep, with multiple data stages and using various flow‑level transforms. You can create a pipeline by importing a saved pipeline template from a ...Change number format
DataPrep allows different regional formats for numbers. For example, in India, one million is written as 10,00,000 whereas, in the United States, it is written as 1,000,000. To change the format of numerical values In the DataPrep studio page, ...
New to Zoho LandingPage?
Zoho LandingPage Resources


