CRM Usage Metrics

This integration is currently limited to select accounts and will be available for early access soon.
CRM Usage Metrics (powered by Zoho MICS) is a solution you can integrate with Zoho CRM to derive meaningful insights and metrics from user engagement and analyze the feature usage of your Zoho CRM. By leveraging CRM Usage Metrics, you can:
- Optimize CRM strategies using real-time data
- Improve user productivity with targeted insights
- Drive higher adoption of CRM features across teams
CRM Usage Metrics includes multiple tabs or views—Home, Activity, Trends, Funnel, Hub, and User Analytics—each designed to offer unique perspectives on CRM usage. From high-level metrics (e.g., active users, hits) to deeper user behavior analytics (e.g., attendance, session time, funnel conversion rates), CRM Usage Metrics helps admins make data-driven decisions.
Views of CRM Usage Metrics
Home
Once you've integrated CRM Usage Metrics, you can find it in the modules list. The first page you land on is the Home tab. It provides a high-level summary of user engagement metrics within Zoho CRM. Admins can quickly gauge overall CRM activity—such as hits, feature usage, user attendance, active, and inactive users—to spot trends and adjust strategies as needed.
Let's say, at Zylker Corporation, an admin notices a drop in features used. From the Home tab, they can discover there's a fall of 3% for features used compared to the previous month. With this info, they can address specific issues and boost the feature usage among the users.
Components
Let's take a quick look at the different components available at the home tab.
- Summary metrics
- Total hits: Total clicks/interactions in the last 30 days.
- Features used: Number of unique features accessed in the last 30 days.
- Attendance (days): Total days users logged into the CRM.
- Active users: Number of users who interacted with the CRM in the past 30 days.
- Inactive users: Number of users who did not interact with the CRM in the last 30 days.
Each of these metrics also includes a percentage change from the previous month, helping you track month-over-month growth or decline. - Hits table
Weekly breakdown of CRM clicks, grouped by week to highlight usage peaks. - Attendance table
Displays daily login frequency over the past five weeks, revealing user consistency patterns. - Users with most hits and attendance
- Most hits: Identifies the top users based on interactions.
- Most attendance: Highlights who logged in most frequently.
Activity
Next to the Home tab, you'll find the Activity tab. This tab offers a detailed analysis of user interactions across different modules in Zoho CRM. Besides summarizing hits, attendance, and active users, it allows admins to examine usage trends for up to 60 days, helping pinpoint which CRM features receive the most or least attention.
For example, at Zylker Corporation, an admin evaluates the Leads Module following a new feature launch. The Activity tab reveals:
- Total hits in Leads for the last 60 days
- A timeline indicating higher activity after the new feature’s release
This validates the feature’s success and shows who may need more guidance.
Components
- Summary metrics
- Total hits: Interactions across all CRM modules in the last 30 days.
- Features used: Unique modules/features accessed, with a comparison to the previous month.
- Attendance (days): Days users logged into the CRM, compared to the previous month.
- Active users: Who used the CRM in the past 30 days.
- Inactive users: Who hasn’t logged in during that time.
- Feature-specific activity
- Usage activity (last 60 days): Total hits for each module—Leads, Contacts, Deals, etc.
- Graphical representation: A timeline chart (x-axis = dates, y-axis = hits) shows usage spikes and inactivity periods.
- Search and filter options
- Search by user: Look up activity by User ID or Primary Contact Email.
- Search by feature: Filter for specific modules/features, creating a customized view of user activity.
Trends
The trends view focuses on how CRM features are utilized over time. By examining usage fluctuations—daily, weekly, and monthly—admins gain insights into performance patterns, helping them make data-driven improvements.
At Zylker Corporation, a sales manager oversees 1,000+ monthly leads. Using the trends view, they track daily or monthly lead creation patterns, identifying peak periods, and optimizing resource allocation.
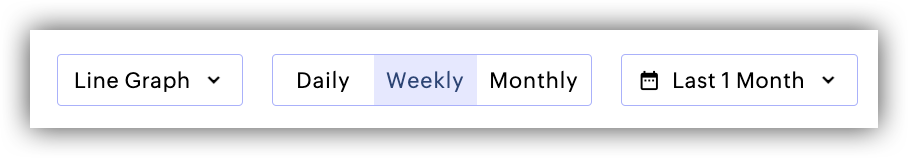
You can view the trends in two ways:
- Line Graph
- Table View
You can also switch between Daily, Weekly, and Monthly views and change the range accordingly, based on business requirements.
Funnel
The funnel view examines how users move through sequential stages of a CRM process. Visualizing conversion and drop-off rates reveals bottlenecks and informs optimization to improve efficiency.
For example, consider the steps in Lead Management Process:
- Step 1→ Lead Creation
- Step 2 → Lead Conversion.
Using a funnel, you can configure each step of this process and analyse:
- Flow completion rate: The percentage of leads successfully converted from the total number of leads created.
- Drop-off rate: The percentage of leads lost at each stage, helping identify process bottlenecks.
Hub
The Hub in CRM Usage Metrics offers two distinct views—Popularity and Frequency—allowing admins to analyze how CRM features are used within a specific timeframe.
- Popularity: Shows how many users engaged with a particular feature, helping identify which modules or actions are most commonly used.
- Frequency: Displays how often users interact with a feature by grouping them into buckets (e.g., 1–10 hits, 10–100 hits), revealing which user segments have high or low engagement.
Let's say, at Zylker, an admin wants to see which CRM modules are most popular among their sales teams. By configuring the Leads, Contacts, and Deals modules in the Popularity view (with a time range of one month), they discover that Leads is the most accessed module. Similarly, using the Frequency view, they find that a large group of users (50+) interact with Leads more than 50 times a month, indicating high engagement among those users.
User analytics
The user analytics view offers insights into individual user activity. Admins can see who is most active, who might need more support, and how frequently users interact with specific CRM features.
Example 1
An organization admin wants to identify the monthly active users in Zoho CRM and understand how they engage with key CRM features. By configuring a User Analytics view, the admin can:
- Track active users: Determine how many users log in and use CRM consistently each month.
- Evaluate key feature engagement: Check which features or modules are frequently accessed, revealing adoption levels across the team.
These insights help the admin pinpoint areas of success (highly adopted features) and areas that may require additional training or resources.
Example 2
At Zylker Corporation, an admin notices that although many employees log in daily, few of them explore important CRM features or spend enough productive time in Zoho CRM. To investigate, the admin applies the following filters in User Analytics:
- Activity
- Last seen: Less than 1 day (indicating daily logins).
- Session time: Greater than 300 minutes (over 5 hours).
- Feature used
- Modules: Records added (to gauge meaningful interactions).
Upon analyzing the filtered data, the admin discovers that fewer than 20% of these daily active users are performing valuable tasks, such as adding records. This finding highlights a need for focused user education and training on how to leverage CRM modules more effectively, ultimately boosting overall productivity.
Below is a breakdown of key user metrics you can analyze in the Activity section, helping you gain deeper insights into individual user behavior and overall engagement.
- Activity section
The Activity section allows administrators to configure user-based filters to analyze user behavior and engagement within Zoho CRM. It provides the following key metrics: - Attendance
The total number of days a user is active in the CRM.
Example: If a user signs up on October 1 and logs in on October 4, 8, 12, and 14, their attendance for the 30-day period ending October 31 would be 4 days. - Increase in attendance
The percentage increase in a user’s active days compared to the previous 30-day period.
Example: If a user is active for 15 days in the month of October but was active for only 10 days in September, the attendance has increased by 50% in October. - Decrease in attendance
The percentage decrease in a user’s active days compared to the previous 30-day period.
Example: If a user is active for 15 days in October but was active for 30 days in September, the attendance has decreased by 50% in the month of October. - Last seen
The most recent date and time the user was active in the CRM.
Example: If a user signs up on October 1, logs in on October 2, 5, and 8, and does not return afterward, their last seen date is October 8. - Session time
Measures how long users remain active in the CRM. A session starts when a user performs their first action and ends after 15 minutes of inactivity (or upon logout).
Example: A user logs in from 9:00 AM to 10:00 AM and again from 8:00 PM to 10:00 PM. Their total session time for that day is 3 hours (180 minutes). - Session count
The total number of sessions a user initiates.
Example: Continuing the above scenario, the user has 2 sessions (one in the morning and one in the evening).
Key components
While each view uses these concepts slightly differently, the core definitions remain the same throughout CRM Usage Metrics.
Feature
A feature is any action, module, or process within Zoho CRM that you want to analyze. This mainly contains a list of the following types of features:
- General features, like Calendar
- Users & control features, like Profiles, Roles, and Users
- Automations, like Assignment Rules
- Channel based features, like Webforms
- Modules, for analyzing details from the system defined modules. You can also choose the All Modules option.
- Customization features, like Pipeline, and
- Reports and analytics
You can use the features from this list for various analysis within CRM Usage Metrics views. For example, you can create a Trends view for the Leads module, or a Funnel view, for analyzing records through different steps like Create Lead, Convert Lead, etc. or in the User Analytics, list which features each user has or hasn’t engaged with.
Properties
(for Trends, Funnel, and User Analytics)
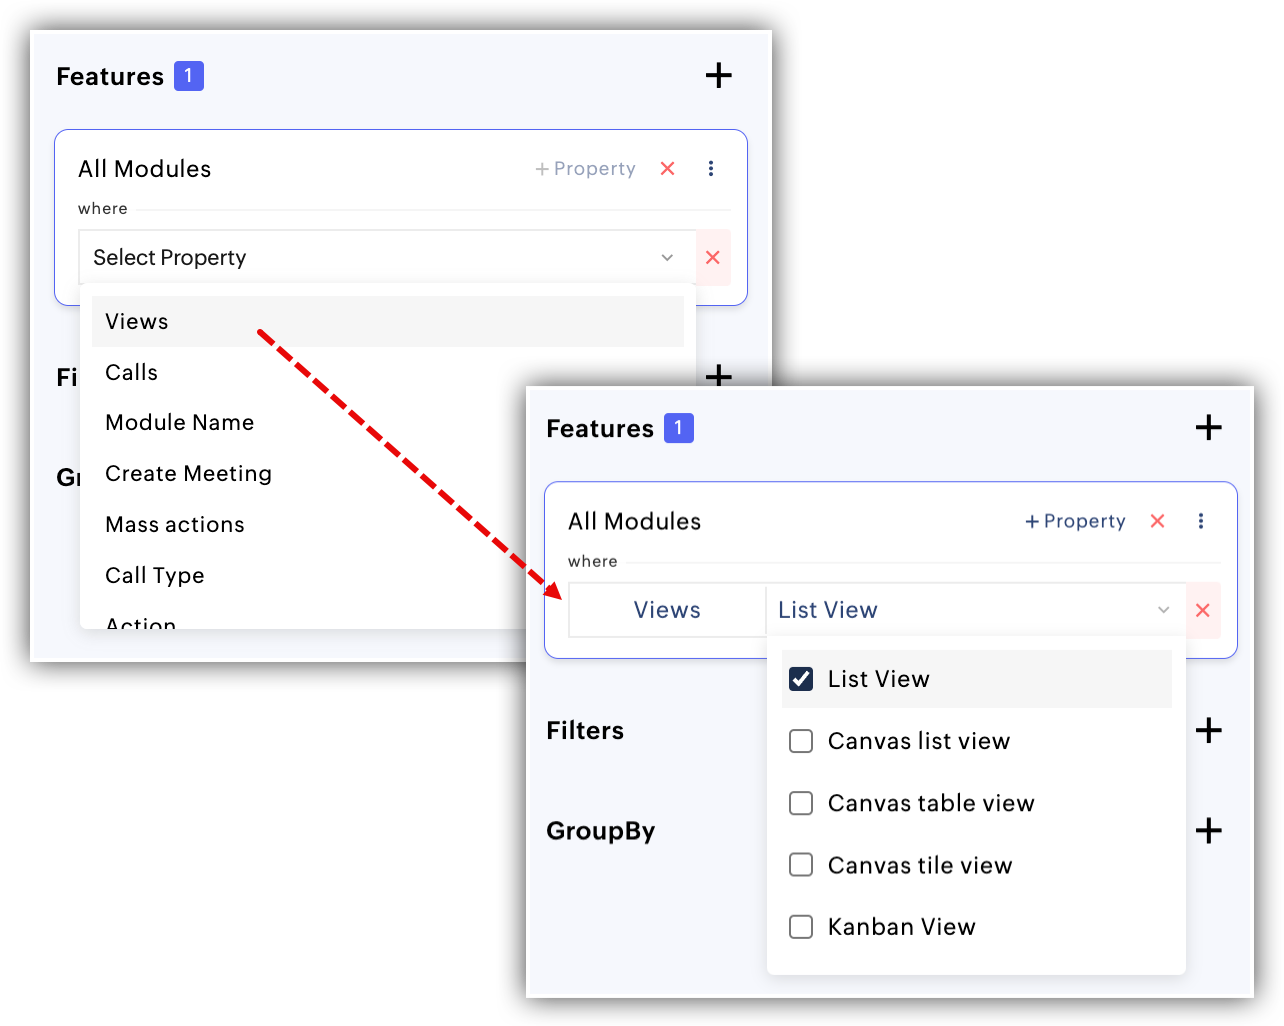
In addition to selecting a feature, you can also specify properties that further define the scope of your analysis within the CRM. The properties vary depending on the feature, and so does the different attributes for the properties.
For example, you can analyze the Leads module as a feature, then specify properties such as Views, Calls, Create Meeting, Buttons, Macros, Task Creation, and more. Once you choose a property (e.g., Views), you can set the corresponding attributes. For instance, if Views is the property, the available attributes might include List View, Kanban View, and Canvas View.
Filter
Filters are optional but powerful tools that allow you to target a specific subset of data for deeper analysis. For instance, you can apply filters based on User Language, User Country, User Time Zone, or User Account Status to focus only on the users or records that meet those criteria. By doing so, you can derive more meaningful insights—like how users from a specific country interact with CRM features, or whether certain user time zones require additional support.
Group by
The group by option allows you to categorize your data based on similar criteria as Filters, i.e. User Language, User Country, User Time Zone, or User Account Status. By organizing results into groups, you can more easily identify patterns and trends across different user segments. For example, grouping by User Country helps reveal which regions exhibit higher CRM engagement, while grouping by User Time Zone can highlight peak usage periods in different locales. This grouping provides a clear comparison across multiple segments, making it simpler to pinpoint where additional support or training might be required.
Integrating CRM Usage Metrics
To integrate CRM Usage Metrics, log into your CRM as Administrator and do the following steps:
- Navigate to Marketplace on the left side-bar.
- Under Integrations, go to Zoho.
- On CRM Usage Metrics card, click Setup now.
- Click Activate.
On the old Zoho CRM UI, navigate to Setup > Marketplace > Zoho, and follow step 3 onwards.