Drill down into your customers' voices
Customer experience is a subjective goal that every business is striving to achieve. VoC is a tool that help extract customer experiences from their responses. It deconstructs different aspects of customer experiences into charts and dashboards, which you can use to understand how many of your customers are feeling a certain way about your business and ascertain the next steps.
However, in this seeing is believing world, simply knowing the number of customers contributing to a particular experience is not sufficient. You need to know who those customers are, what are all the records that are contributing to a particular insight, and such. In other words, you will need a drill down of the insights to
- Substantiate the authenticity of the insight
- Relate the response with the respective customer
- Notice underlying patterns in the contributing records
- Conduct root-cause analyses with granular precision
- Act on the customer records that contributed to a particular insight
Introducing customer drill down for VoC charts
Record Drill Down is the drill down of each plotted value in a chart. Consider a pie chart. The data is represented as sectors, and upon hovering on the chart, the preview of the data pertaining to that sector will be displayed.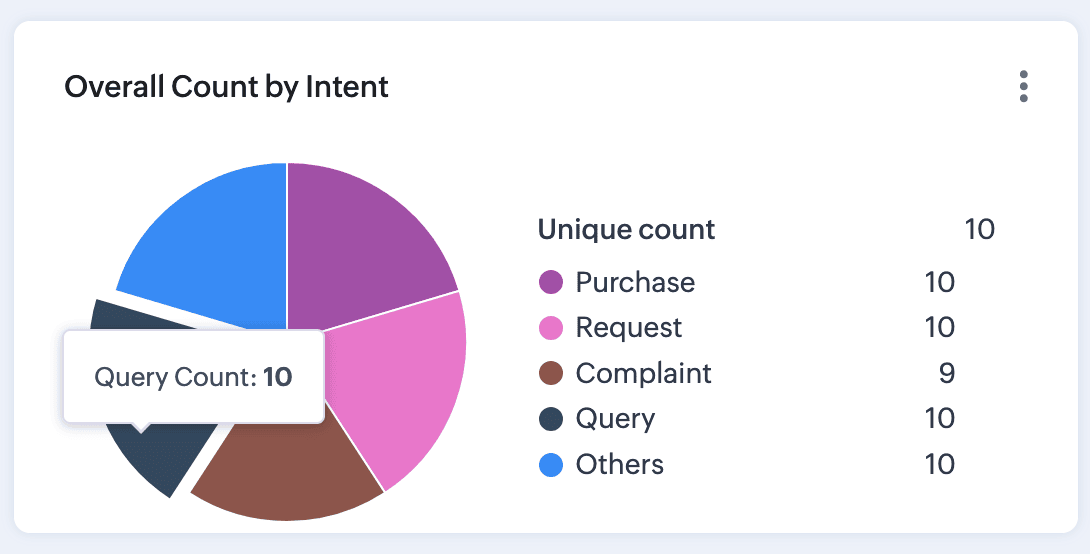
To learn who these nine complaining customers are, you can simply click on that sector. The records related to that data will be displayed as a list view in a sliding pane.
Likewise, you can view the drill down of all charts from the VoC dashboards.

Notes:
- Tabular charts have multiple values. Some values are directly related to records (like record count), and some are aggregations of parameters (like Zoho Survey). Drill down is available only on those records that have a record behind these numbers.
- Drill down is not available for dial charts and quadrant charts.
- If your chart has aggregation based on VoC modules like responses, resources, events, and keywords, like count of responses, then drill down of records will not be available as these are stealth modules used for data processing.
- The drill down will be displayed only when the chart is accessed. Clicking on the legends or labels will include or exclude the chart components and will not display the drill-down.
Quick actions you can perform in a drill down pane
The Drill Down pane is a slider page that loads whenever you click on a plotted value. From here, you can:
- View the number of records contributing to this value
- Determine the number of records to display per page
- Look at the criteria by which these records are grouped together
- Filter the records using field attributes
- View associated responses behind a customer drill down.
- Manage the columns, the order of the records for each column, and the size of each column on display. Further, you can save these columns for quick access if they are drill downs for custom dashboards.
- Select one or more records and send macro, send emails, create tasks, add or remove tags, and perform other quick actions like setting reminders, mass field updates, change owner, trigger or un-enroll from cadences, add to campaigns, update response, print mailing labels, initiate mass mail merge, delete, or update data processing basis.
Business scenarios where drill down can benefit you
Investigating the industry-wise preference for competitors: A trend analysis
Businesses belonging to an industry share similar processes and tools. If your business is among the providers, then your customers likely preferred your brand over multiple other providers in the market. However, at times of poor service or when the customer isn't happy, they tend to express their discontentment by comparing your brand with other providers. In other words, they compare your brand with your competitors, and the trend could hint their behavior to churn. So, before there are evident churn symptoms, it's wise to keep an eye on the customers who compare your brand with others.
Take a look at this cohort chart to analyze the trend. There are 18 businesses or customers from the private sector that mentioned competitors on day 0 of creating these records. It means that these mentions can be of any kind.
They could have said they switched from a particular brand to yours or compare a feature from your competitor's brand, or even say out loud that the competitors are the best.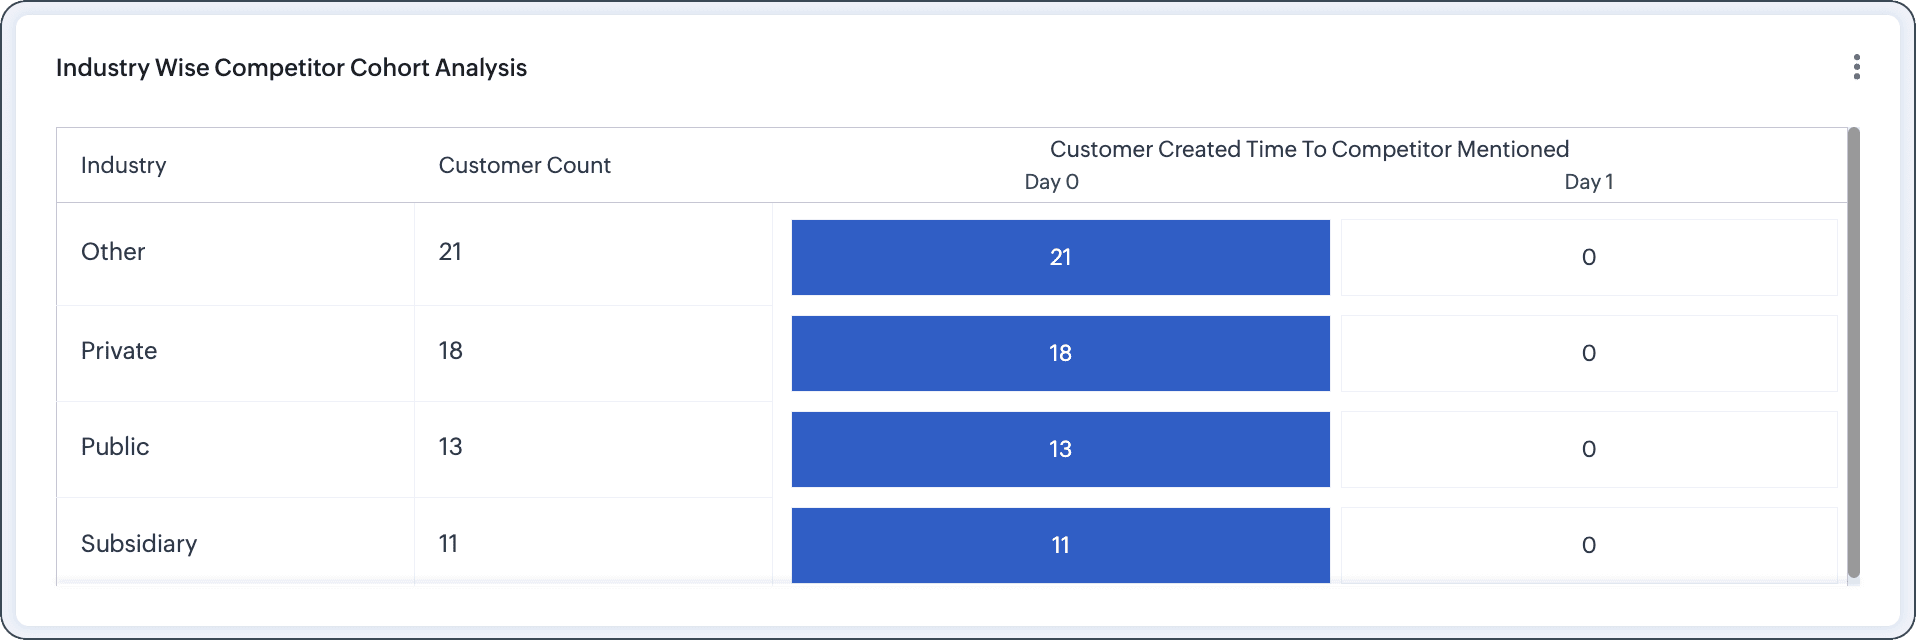
You can investigate more about this trend by clicking on the customer count. This count denotes the total number of records participating at different times.
The drill down displays all the information you need to know about the customer contributed to the private sector that mentioned competitors at day 0. You can engage with them using mass email or cadences, perform other operational field updates with respect to these records right from here. 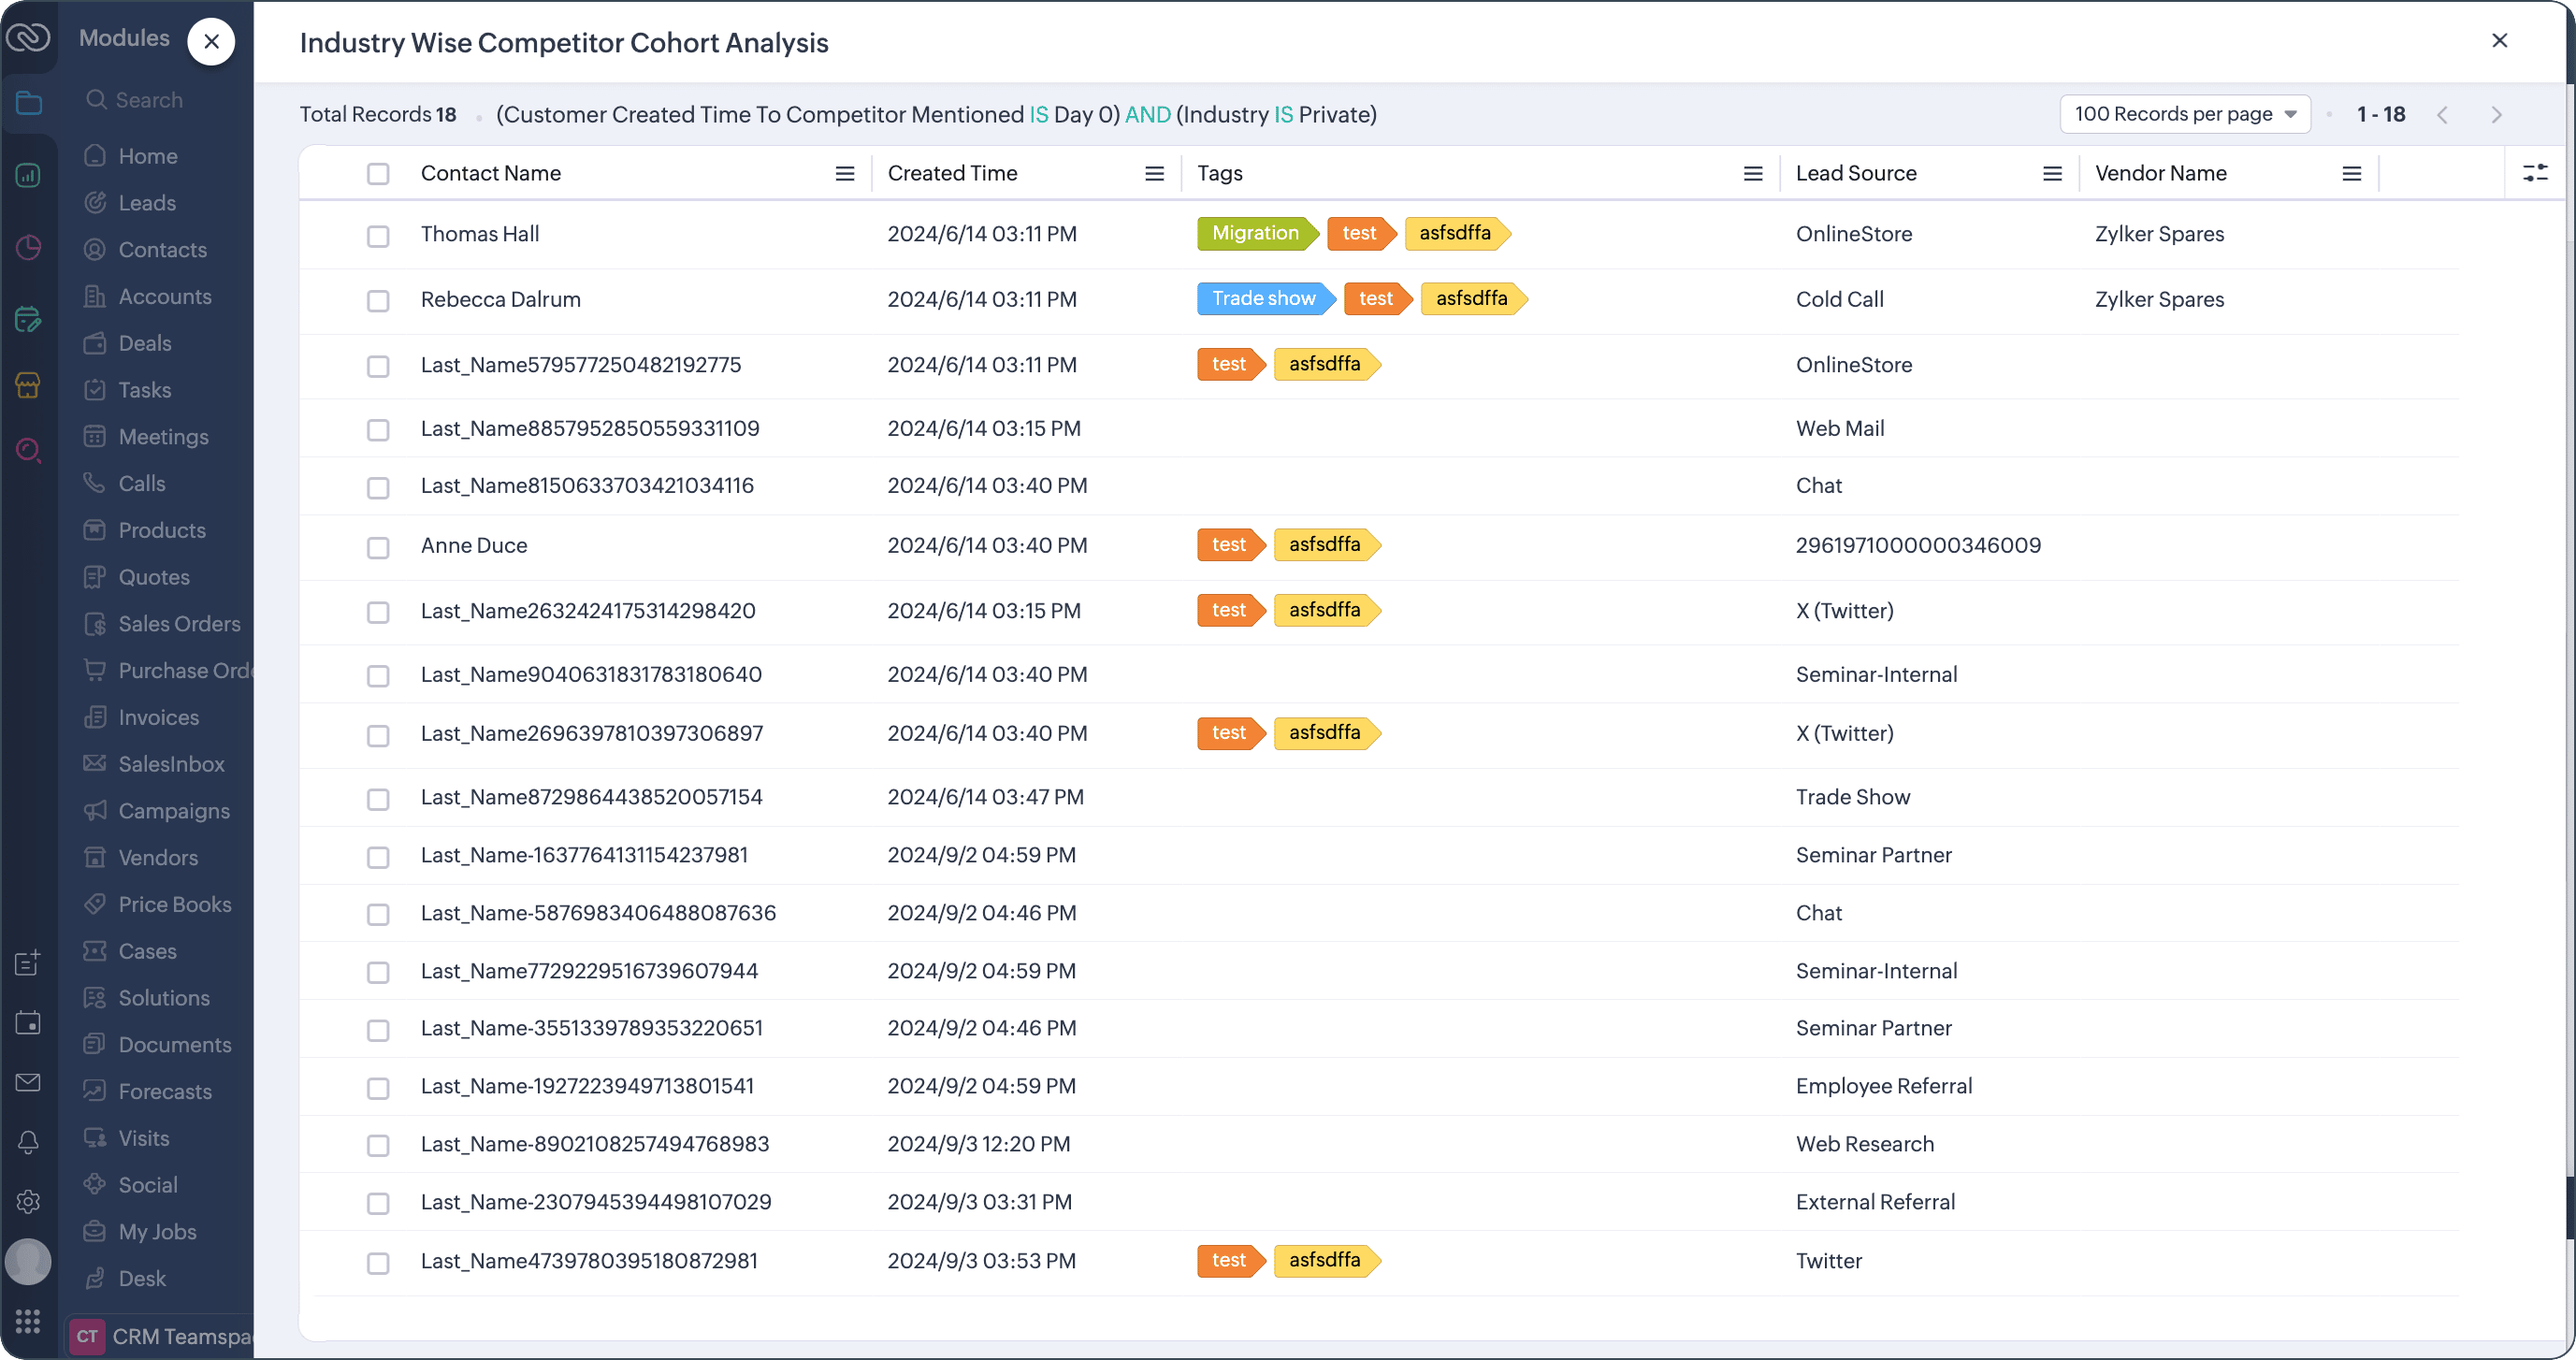
Nurturing customers with negative sentiments
Negative sentiments imply negative perception, which is a trigger for churn. For businesses with retention as a focus, they can create a reconciliation campaign and engage them with exclusive focus. Using the drill down, you can identify all those customers that are experiencing negative sentiments, label them as negative experiences, and subject them to the campaigns right from within the VoC dashboard.
Drilling down into Responses
So far, we saw how you can drill down into a chart value to find the cohort of customers that are contributing to the analyses. For analyses based on VoC Responses module, VoC also comes with the facility to drilldown into the responses.
Say, you want to identify patterns and reduce churn in your organization. By creating a component based on response you can identify churn indicators: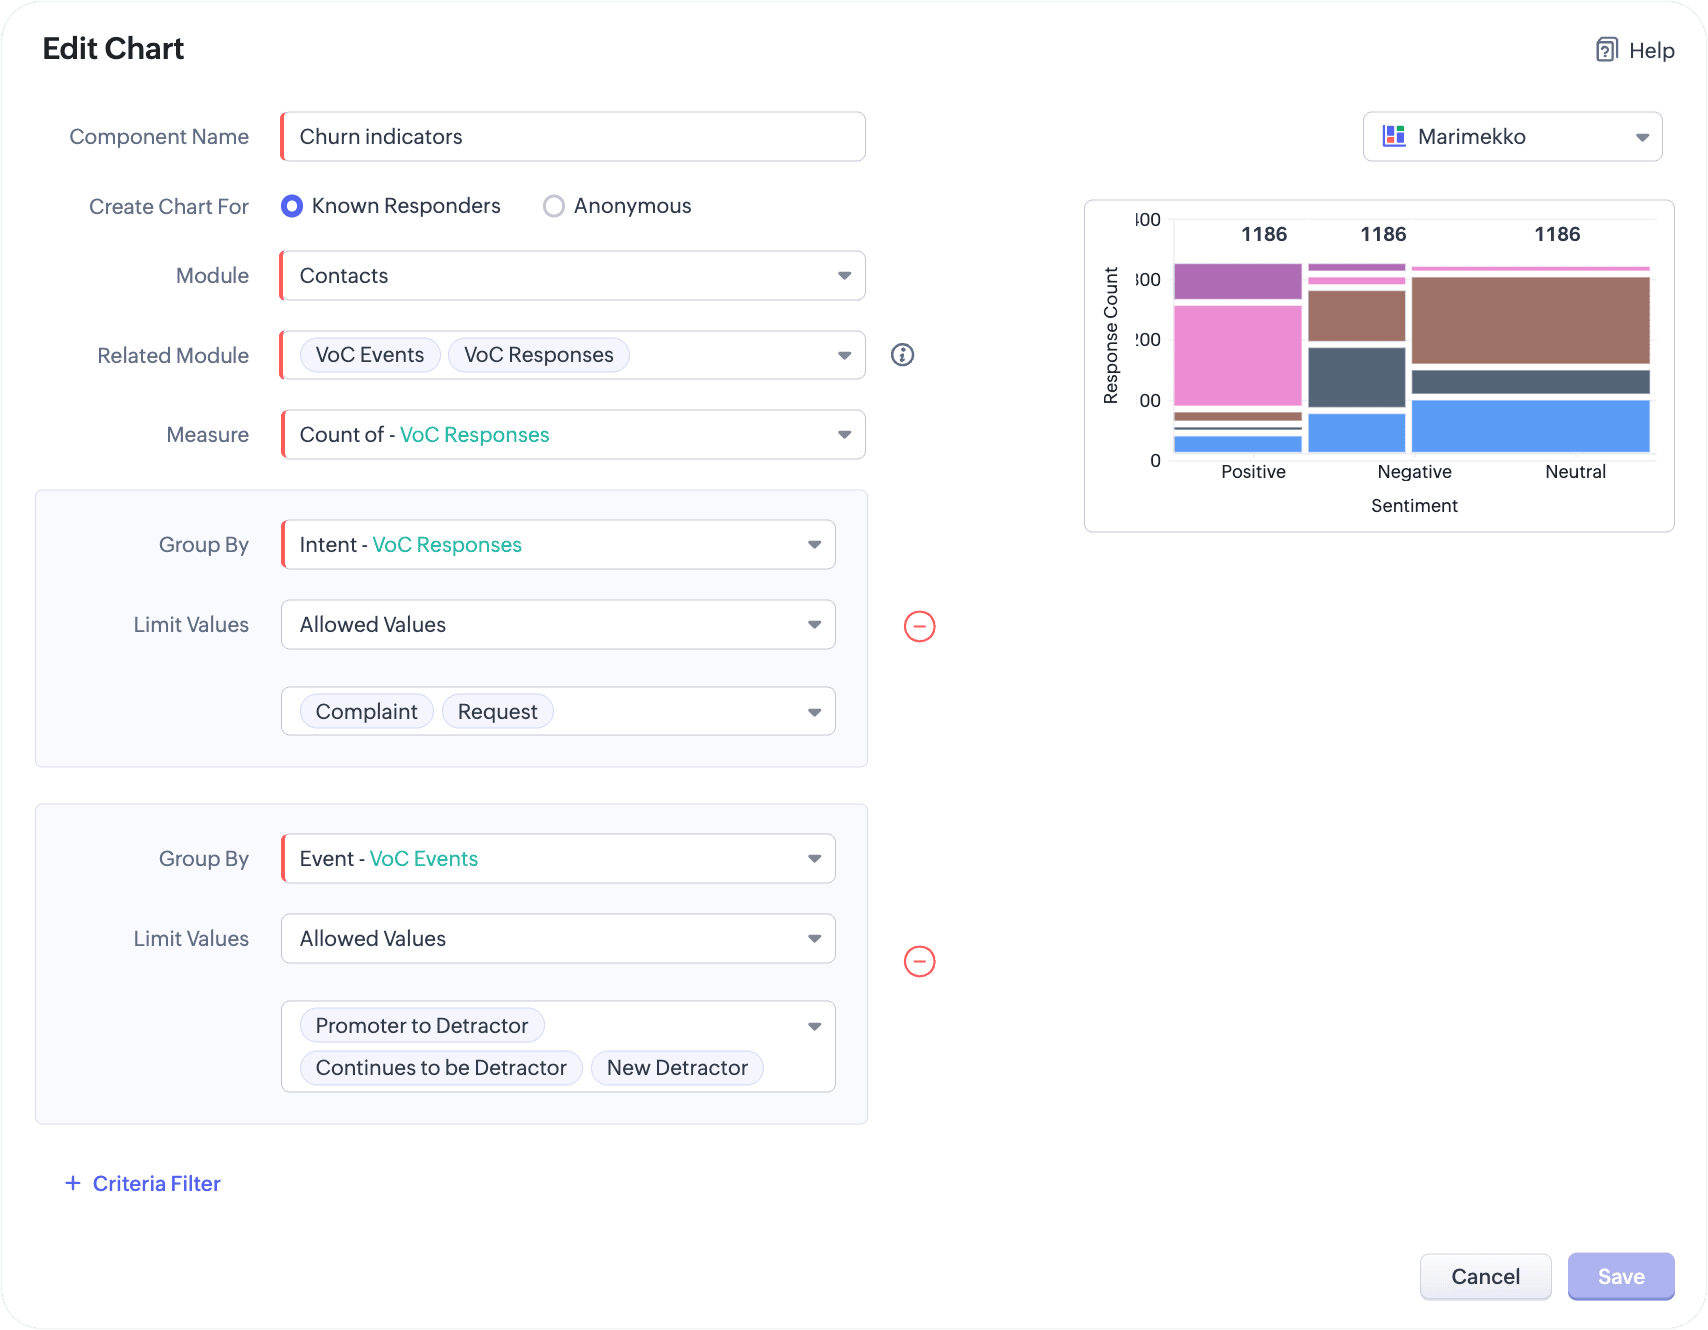
By drilling down into the resultant chart values, you can understand all the responses behind a particular intent, behavior, or actions.
It collates responses from all channels like: Notes, Desk, Survey, Custom review module, Desk, Zoho Social, emails and calls and shows these responses in all formats behind one chart value.
Let’s look at a couple more examples:
A customer happiness executive found a productivity hack and elevated his customers’ experiences.
Evan is a customer happiness executive in an ecommerce business. His job demands he straighten out, sort, and solve customer responses and grievances shared in various channels. He created a response-based sentiment analyses VoC dashboard. Using a clustered bar chart representation, he aggregates the responses based on channels and sentiments. Now, with a view that shows the negative, positive, and neutral responses classified based on channels. While his job is to work on these responses primarily, he need not waste time in collating these reviews in the first place.
A marketer finds a way to identify and acquire prospects
A news aggregator forum will have a collection of reviews, discussions, and opinions from customers and prospects. These insights serve a great opportunity for the marketer to understand the larger market. By creating an anonymous analyses of VoC responses, the marketer can drilldown into all the reviews that are stored in a custom module to further pursue them through the funnel.