Create pivot chart from live application
You can create a pivot chart from the live mode of the application shared with you using shared analytics. To enable this feature, the admin needs to provide Create Report permission.
To create a new report from live application:
- Click the Create Report option in the live application.
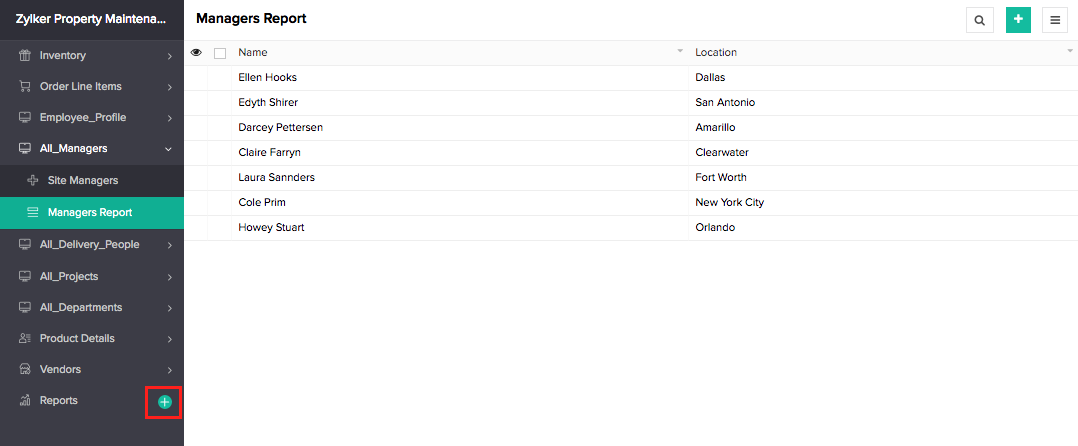
- Select Pivot Chart report.
- Select the Form for which you need to create the report.
- Enter Name of the report.
- Select the profile of users to which the report needs to be shared.
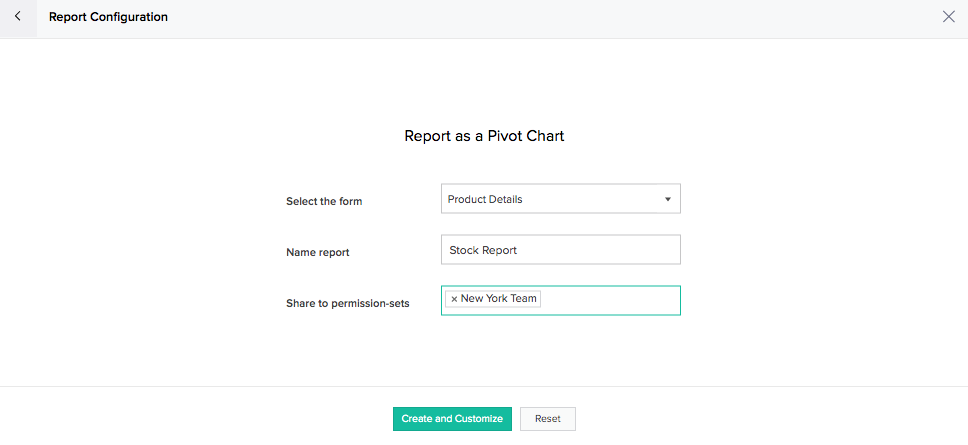
- Click the Create and Customize button.
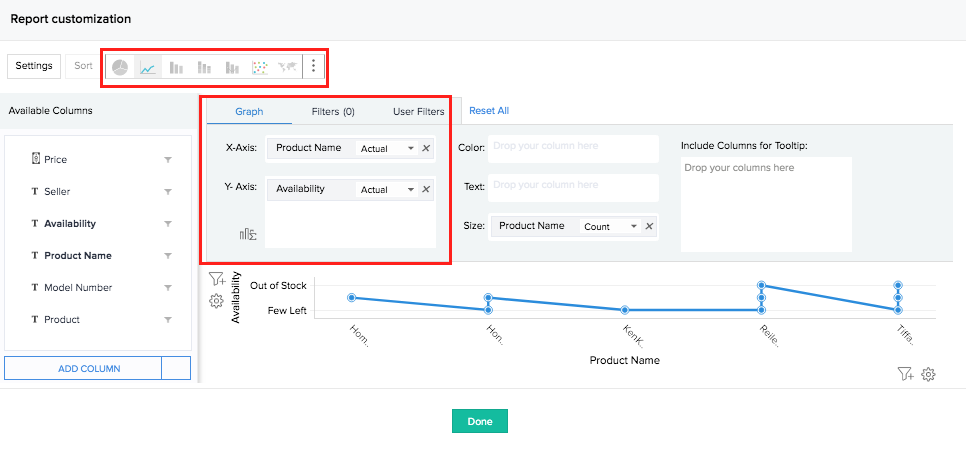
- Customize the report.
- Click Done. The report will be created.
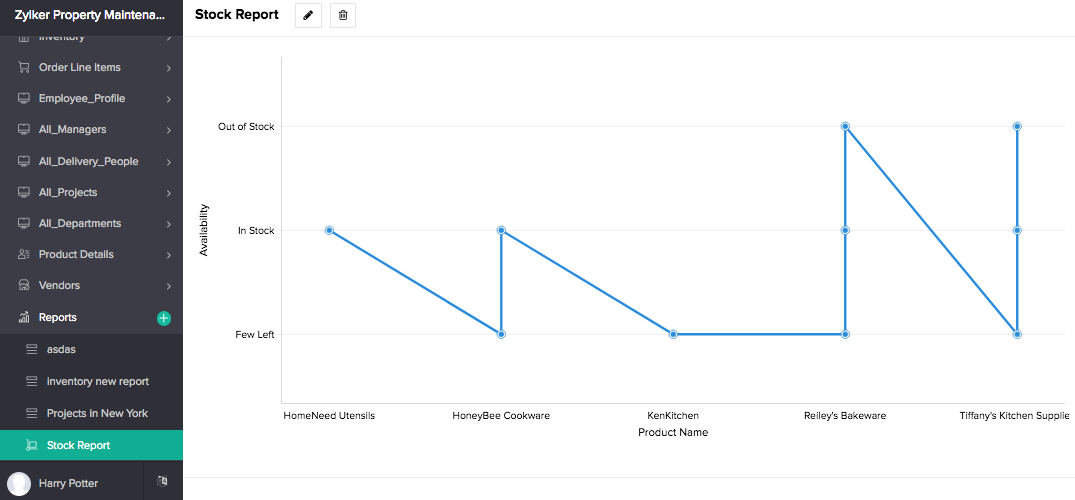
Report customization
You can customize the report according to your requirements. You can define chart properties, set the fields for the chart, add filters, apply chart type and set themes.
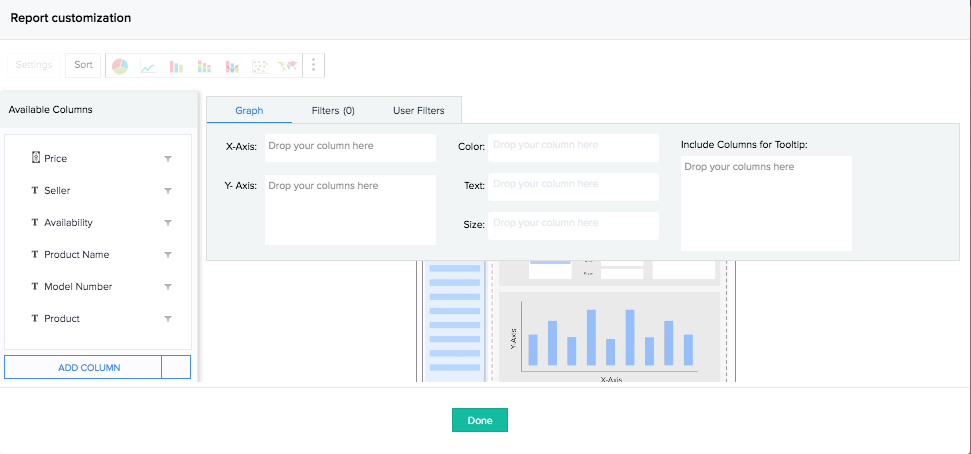
Edit report
To edit the report:
- Navigate to the required report.
- Click on the edit icon alongside the report name. The Report Customization window will be displayed.
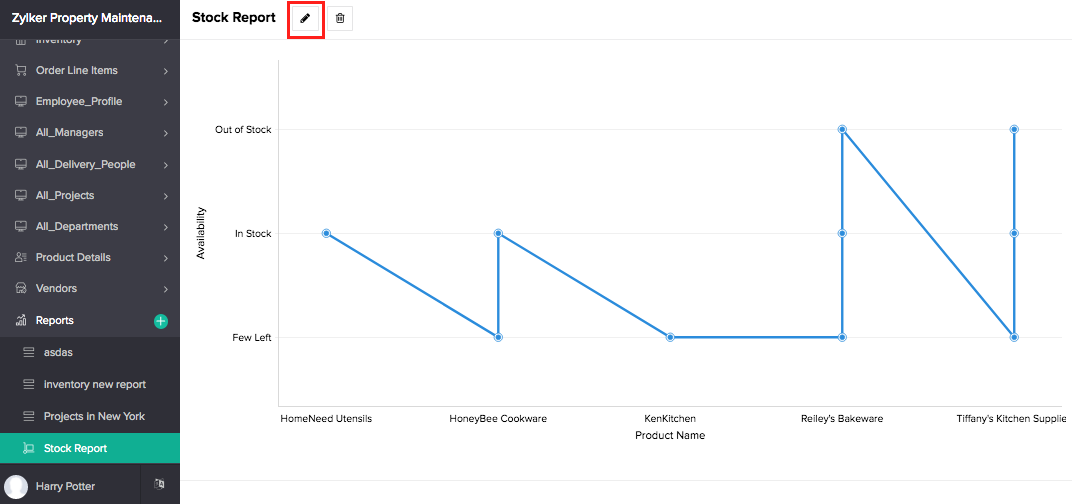
- Modify the properties.
- Click Done to access the report and view the changes.
Delete report
To delete the report:
- Navigate to the required report.
- Click on the delete icon alongside the report name.
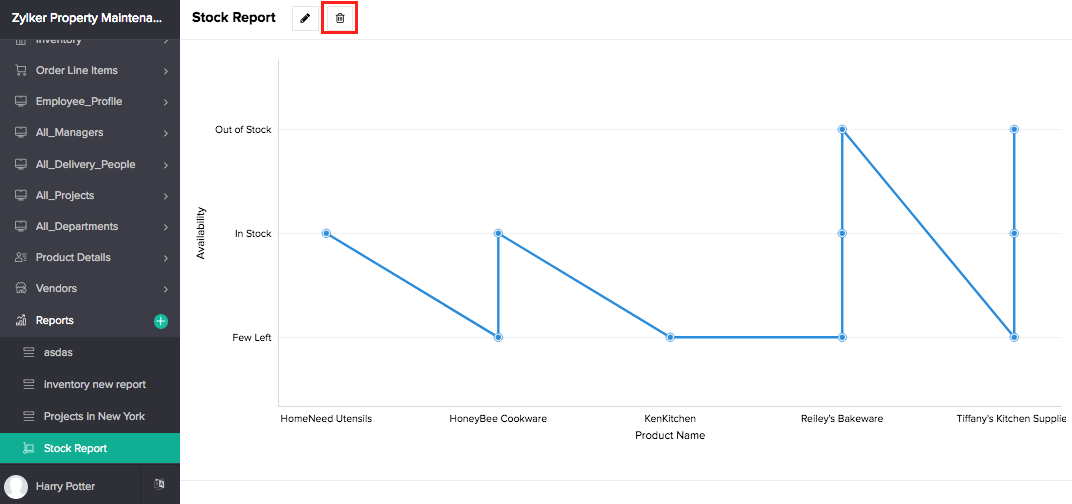
The report will be deleted.
Related Topics
Zoho CRM Training Programs
Learn how to use the best tools for sales force automation and better customer engagement from Zoho's implementation specialists.
Zoho DataPrep Personalized Demo
If you'd like a personalized walk-through of our data preparation tool, please request a demo and we'll be happy to show you how to get the best out of Zoho DataPrep.
All-in-one knowledge management and training platform for your employees and customers.
You are currently viewing the help pages of Qntrl’s earlier version. Click here to view our latest version—Qntrl 3.0's help articles.
Zoho Sheet Resources
Zoho Forms Resources
Zoho Sign Resources
Zoho TeamInbox Resources
Related Articles
Understanding report creation from live mode
Zoho Creator provides users with a conducive method to create reports from the live mode of the application. This enables the admin to provide specific users with the permission to create reports to the forms that they have access to. These users ...Create Report from Live Application
You can create a list and pivot report from the live mode of the application shared with you using shared analytics. To enable this feature, the admin needs to provide Create Report permission. To create a new report list from live application: Click ...Create pivot table from live application
You can create a pivot table from the live mode of the application shared with you using shared analytics. To enable this feature, the admin needs to provide Create Report permission. To create a new report from live application: Click the Create ...Schedule a monthly email with report as pdf
Requirement Schedule a monthly sales report to the sales manger in a PDF with stats on achieved sales versus target for the month. Use Case A sales management app records sales activities and numbers to track the performance of its sales team and the ...Modes of an application
Overview Zoho Creator has two modes through which you can establish an application from start to finish. You can create an application from scratch or from a template and customize it according to your needs in an app-building space. During that ...


