Dashboards
A dashboard is a visual interface comprised of charts, KPIs, and target meters, enabling you to monitor your business performance at a glance using data from various modules.
How can I create a new dashboard?
- Go to the Dashboards tab in Bigin.
- In the View Dashboards drop‑down, click + New Dashboard.
- Click + Component to add charts, KPIs, or target meters.
- In the Dashboard Builder:
- Enter a Dashboards Name
- Choose visibility: Only me, All users, or Custom (select specific users/roles/groups)
- Click Save to create your dashboard.
What types of components can I add?
You can add three types of analytical components:
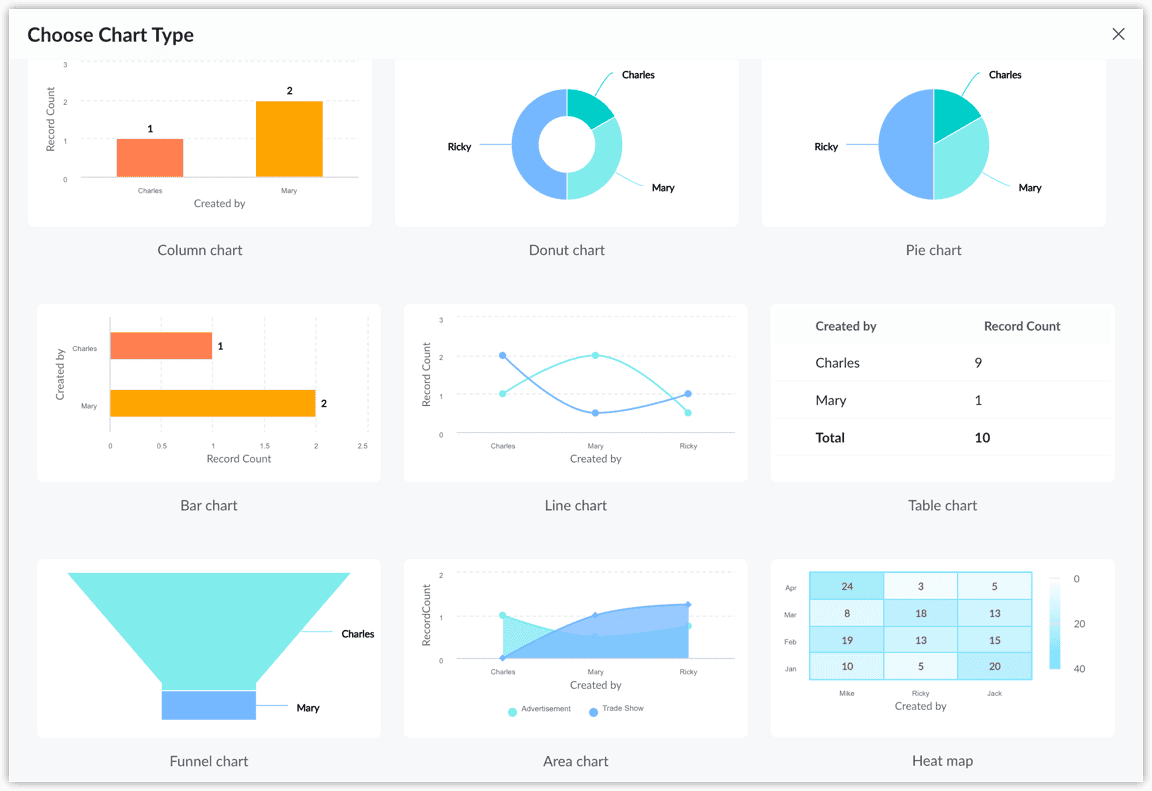
- Charts (column, bar, line, donut, pie, funnel, table, area, heat map)
- KPIs (Standard, Growth Index, Basic, Scorecard, Rankings)
- Target Meters (Dial Gauge, Traffic Light, Single Bar, Multiple Bar)
Which chart types are supported?
You can choose from column, bar, line, pie, donut, funnel, table, area, and heat-map charts.
How do I configure a chart component?
- Click +Component → Chart.
- Select the chart type.
- Provide the component name.
- Choose the module and related module.
- Define Measure (Y‑axis) and Grouping.
(Optional) Add filters, sort options, maximum grouping, and benchmarks.
What is KPI? How do I set it up?
KPIs summarize metrics like revenue or growth in formats such as scorecard or rankings.
To set up KPI:
- Add a KPI via +Component → KPI.
- Choose the KPI style (e.g. Scorecard, Rankings).
- Enter component name and select a KPI metric & module.
- Optionally apply filters and duration.
- Configure comparison indicator and ranking settings (if applicable).
- Click Save

What are Target Meters? How do I configure them?
A Target Meter visualizes performance against goals using dial gauge, traffic lights, or bar meters.
- Add via +Component → Target Meter.
- Choose the type (Dial, Traffic Light, Single or Multiple Bar)
- Provide the component name
- Define “Set Target For” (e.g., users, roles, picklist values).
- Apply filters, choose a duration, and set target values.
- Save and optionally reorder the layout.
How can I manage existing dashboards and components?
Use the More (⋯) icon in dashboards or individual components to:
- Edit
- Delete
- Clone
- Print
You can also manage access permissions for each dashboard via 'Edit' next to the dashboard name.
Can I resize and rearrange components?
Yes, you can adjust component size and layout within the dashboard builder to emphasize key metrics or optimize space.
Go to the Dashboards section and click 'Edit' next to the dashboard name. Select the dashboard component, then adjust its size using the cursor and drag it to change its position.
Are there pre-built dashboards available?
Yes. Bigin provides default dashboards like Call Analytics, Email Analytics, and Deals or Pipeline dashboards you can view or customize.
What is Drill Down in Bigin Dashboards?
The Drill Down feature allows users to click on a chart, KPI, or target meter component in a dashboard and view the underlying data behind it—right down to the individual records.
This helps you move from a high-level overview to detailed insights in just a few clicks.
How does Dashboard Drill Down work?
When you click on a visual component (e.g., a bar in a bar chart or a KPI score):
- A popup window appears showing the list of records (e.g., deals, contacts, activities) that make up that data point.
- You can view, filter, and even edit these records directly from the drill-down view.
- The data respects your role-based access. You only see the records you’re allowed to access.
Who can share dashboards?
Only users with permission to create dashboards (typically admins or users with specific roles in a paid edition) can configure dashboard sharing settings.
How to Share a Dashboard?
When creating or editing a dashboard, you can choose one of the following sharing options:
- Only Me
- The dashboard is private to you.
- No one else can view or access it.
- All Users
- The dashboard is shared with everyone in your Bigin organization.
- All users will see it in their dashboard list.
- Custom
- You can share the dashboard with specific users, roles, or groups.
- This allows for more controlled, role-based access.
What is grouping in Bigin dashboards and how is it useful?
Grouping in Bigin dashboards refers to organizing your data based on a specific field, such as Stage, Owner, or Pipeline. This allows you to visualize how data is distributed across different values within that field. For example, the number of deals per stage.
It helps to break down large datasets into meaningful categories. This enables better analysis, trend identification, and decision-making directly from your dashboard.
What is the maximum number of groups allowed in a Bigin chart dashboard?
Bigin allows a maximum of 75 groups per dashboard component. This means when you group data by a particular field, only the first 75 unique values (groups) will be shown, or, based on sorting order, the first 75 unique values (groups) will be shown.
What happens if the number of groups exceeds 75?
If your grouped field contains more than 75 unique values, only the first 75 will be displayed. The remaining groups will be excluded from the component to maintain performance and readability. To ensure accuracy, consider applying filters to reduce the number of group values before grouping.
How to add existing chart component grouping?
To change grouping on an existing dashboard chart:
- Go to the Dashboards tab.
- Click the More icon (⋯) in the chart component.
- Select Edit.
- Within the edit view, adjust the Grouping dropdown to your preferred field.
- Save your changes; the chart will update automatically.
How many components can I add per dashboard?
Dashboards support up to 10 components each.
Are dashboard features limited by pricing plan?
Yes. Custom dashboards and advanced components are only available on paid editions:
- Express: 10 dashboards
- Premier: 20 dashboards
- Bigin 360 / Zoho One: 50 dashboards
Note:
- Custom dashboards are available only with trail and paid plans.